Summary:
- Alphabet faces a potential forced divestiture of its Chrome browser, risking 15% of ad revenue, raising caution for investors.
- The stock is overvalued by several quant measures I follow, indicating significant risk despite strong cash flow.
- Technical charts reveal downside risk of 45%, making GOOG a “sell” due to high potential for major loss.
- Current market conditions suggest shifting focus to yield ETFs over individual stocks to mitigate above-normal risk.
Justin Sullivan
The cat is out of the bag. Alphabet (NASDAQ:GOOG and NASDAQ:GOOGL), the dominant firm in so many businesses and re-shaper of our daily lives, is in serious danger of being forced to shed its Chrome browser business, and the ad dollars that flow from it, which reportedly are about 15% of all ad revenue. Some might conclude this was inevitable. Others might argue that if there were ever a case for keeping a monopoly intact, this is it, for the public good.
I don’t have a horse in that race. I’m just a chartist and quant investor who wants to figure out whether this decision moves me to action, now or later. In the case of GOOG, I see reason for caution and a good lesson for investors about how modern markets operate.
Increasingly, I try to let the charts speak to me. Or, more properly, the market. Price not only matters, but it is the ultimate truth serum for stocks, and really the only thing that ultimately matters. I’m sure there are plenty of investors (particularly professional ones) who are inclined to wax poetic about the quality of the stocks they own, the great stories embedded in those businesses, and the great long-term value that their collection of stocks represents. Good for them, but I’m a bit more bottom-line.
Specifically, in any investment situation, all I want to determine is this:
1. How much risk of major loss is present?
2. How much return potential do I think I have for that risk I’m taking.
3. Based on that, how high a position weight should I assign in the portfolio, if any.
That sounds simple, but if one doesn’t have a sound, repeatable and demonstrated methodology behind their decisions, that introduces a luck factor into it. And while there are many investors and analysts who know the intricacies of search and Google’s many other business lines way better than I ever will, there is a set of criteria I look for to say “OK, I’ll own some.” I don’t have that with Alphabet’s stock currently. Here’s why.
Brown Shoe Co., Inc. v. U.S. | 370 U.S. 294 (1962)
First, it seems strange to invoke the names of Chief Justice Earl Warren and U.S. prosecutor Archibald Cox. But it was Warren’s court (the same one that presided over the aftermath of the JFK Assassination) and Cox’s litigation in a case of Brown Shoe Company in 1962 that set the precedent for the Google trial just concluded. Back then, the monopolistic issue involved the purchase by Brown of Kinney, a shoe company best known to those of us 55 years old and up. But that was the key precedent, so there you go. I discovered this link to a podcast interview (obviously from this year, not 1962) which provides more color to the Brown Shoe connection to Google’s current predicament.
Now, let’s look at things through my traditional lens, to see how I reached my own verdict. Specifically, that I am not as brave as the habitual “dip buyers” when it comes to this stock. That said, I could get very friendly to it “at a price” which I’ll show below.
Alphabet: quant analysis
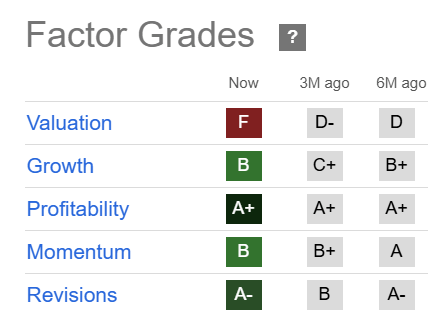
My analysis of the Seeking Alpha factor grades reveals that with a valuation grade of F, there was risk to GOOG even before the long-term concerns about monopoly status went from a threat to a reality. That said, this company is not going to shed its high rating for profitability any time soon. As with many Magnificent 7 stocks, the cash flow is just too strong for that to occur soon.
Seeking Alpha
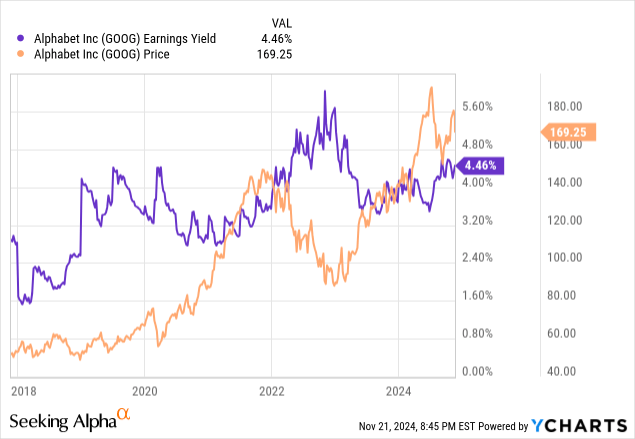
I can’t do my usual Yield At a Reasonable Price (YARP) analysis on a non-dividend stock, but I can substitute earnings yield. What I see here is a positive sign. That figure has remained elevated, even as the stock rose the past year. However, this could be at risk depending on specifically how the US Justice Department’s conclusions play out in specific regulatory directives to the company. And in the same breath, we have to account for the possibility that the incoming Trump Administration stops this breakup process in its tracks. Just another of many political footballs to consider in the new year.
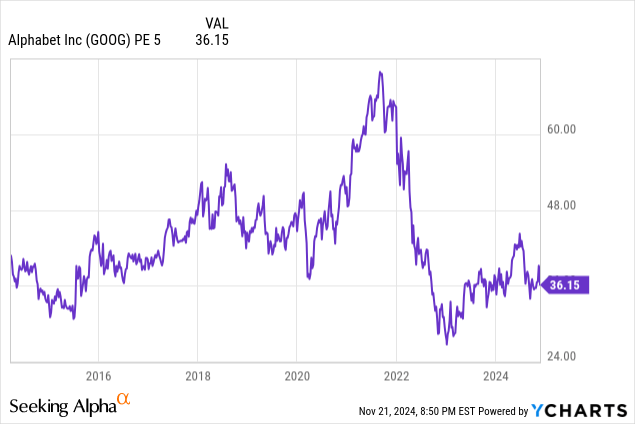
A long-term (5-year smoothed) Price-Earnings Ratio of 36x is not cheap, even for a stock like this. Or is it? At the end of the day, investing in high-expectation mega cap stocks at this stage of the market cycle is as much a confidence game as anything else. And at a multiple well under its historic averages, this non-fundamental analyst would not be surprised to see “relative to itself” valuation arguments from Alphabet bulls.
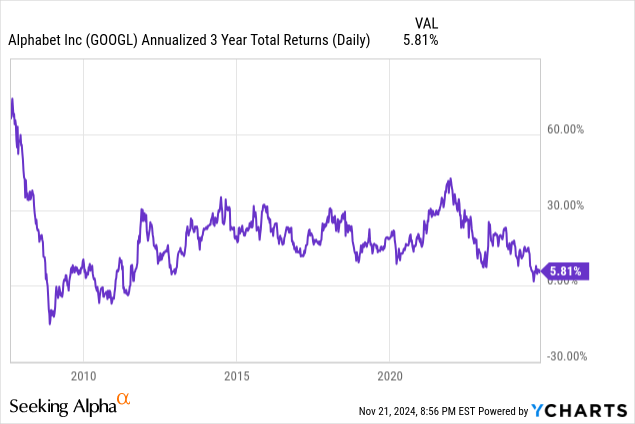
Using the older of the two Alphabet share classes (GOOGL)(GOOG) below, we see that a sub-6% annualized return over the past three years is quite low for this stock. Not since the end of the global financial crisis has Alphabet been this weak a performer. That indicates that the stock is far from frothy on price alone. However, see above, the valuation in nosebleed territory.
Alphabet: technical analysis
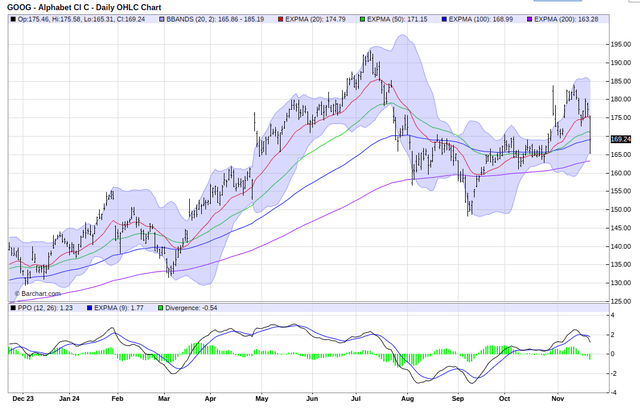
And to conclude, here are the daily and weekly technical charts. This daily doesn’t guarantee anything, especially with the urgent selling Thursday in response to the news. However, when the 20-day moving average (red line at top of chart) rolls over and the PPO indicator (lower section of chart) does too, if I step in, I’m doing so against my long-tenured rules.
Barchart.com
This chart may not turn out to be dangerous, but this is not a guessing game to me. I’m playing the odds, so to speak, and that means not trying to shoehorn a positive spin onto a chart just because I like the company. And while I love to act the part of contrarian investor, this is not the place or time.
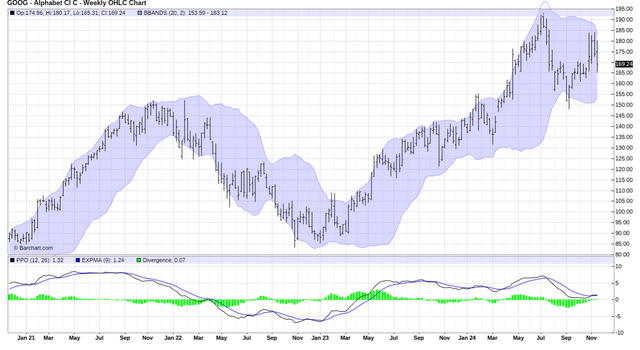
The weekly chart below looks better, but not good to me. That’s mainly because the shockwaves that show up in the daily, short-term chart time frame need time to sustain themselves before bleeding over to the weekly time frame, which is more of a 4-6 month outlook or so. This is neutral and would not cause me to do much if I were a very long-term holder, other than perhaps trim my position a bit.
Barchart.com
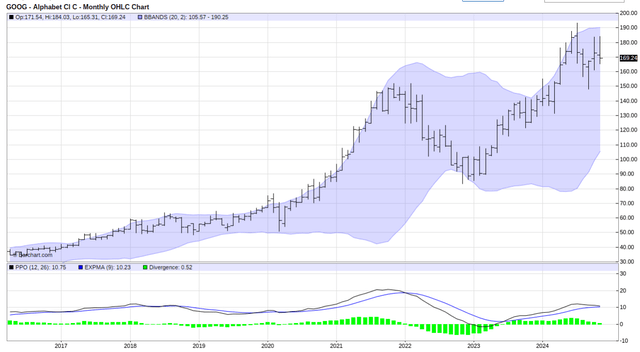
And here’s the longer-term monthly chart. I’m showing this mainly because the Bollinger Bands, that purple shaded area in the chart, is as much of a “tell” to me as anything I’ve shown in this report, albeit with little short-term impact on things.
Barchart
What should we notice about those bands around the stock price? That they tend to mark a trading range, a long-term one in this situation. We can see that in the last major up and down move in GOOG, where the band’s first lifted to a higher range as the stock rose, and then traded down to the bottom of the range when most stocks fell in 2022.
Now, if we use that shaded area to mark the current potential price destination, we see very little upside from here. And, downside that targets $90, not as an expected case, but not as a worst-case scenario either.
Let’s sum this all up. This is just about risk management, and determining if the reward seeking is worth the risk of major loss. No way, I say. And I’m happy to be wrong, since there are many other places to look. But this is not a new thing for me on this stock. As I am in the process of building a portfolio within my YARP portfolio of YieldMax covered call ETFs on some stocks I find attractive. The ETF tied to GOOG was a quick “no” from me, even as others based on Amazon, Nvidia, and Microsoft made the initial cut.
45% downside risk – not a given, but on the table
So there is 45% downside risk here. And even if there were, say, a 1 in 4 chance of that occurring, I can name plenty of stocks and ETFs that don’t carry that high a downside according to my regimen. So GOOG is not nearly in range for me.
Finally, the tough part for me. Fitting my analysis into a traditional rating that won’t prompt cat calls in the comments section a month from now if the stock goes up. Because while my position sizing is at the core of my work, and that translates to either a buy or hold in most cases, this is a level below that. So I’ll place a “sell” rating on GOOG because if I did own it now, I’d reduce it at the very least.
More importantly, this is a hot potato of a stock for a while, and sometimes we just have to say “pass” without a strong opinion. But I will say this: back before the dot com bubble and also the global financial crisis, I saw the same pattern in many stocks that I cited here: that 45%-ish downside risk in the chart. If I begin to see that in many stocks that are atop the S&P 500, not only GOOG and a few others, that will turn the tide for me. That will tell me the risk of major loss is very high at a market-wide level.
Final thoughts for now
Currently, I see a ton of stocks that either look toppy or going nowhere, just gyrating within a range. That is OK if you are collecting option premium and/or a nice dividend payment. But I think there’s a better chance into 2025 that GOOG’s slipping pattern starts to be emulated by a lot of other stocks. I won’t jump to conclusions just yet, but I will say that recent weeks have caused me to pivot from a more single-stock centric posture to using more yield ETFs to fill the void left from having very little to choose from when it comes to stocks I can comfortably hold for a while without above-normal risk attached.
Analyst’s Disclosure: I/we have no stock, option or similar derivative position in any of the companies mentioned, and no plans to initiate any such positions within the next 72 hours. I wrote this article myself, and it expresses my own opinions. I am not receiving compensation for it (other than from Seeking Alpha). I have no business relationship with any company whose stock is mentioned in this article.
Seeking Alpha’s Disclosure: Past performance is no guarantee of future results. No recommendation or advice is being given as to whether any investment is suitable for a particular investor. Any views or opinions expressed above may not reflect those of Seeking Alpha as a whole. Seeking Alpha is not a licensed securities dealer, broker or US investment adviser or investment bank. Our analysts are third party authors that include both professional investors and individual investors who may not be licensed or certified by any institute or regulatory body.
By Rob Isbitts and Sungarden Investment Publishing
A community dedicated to navigating modern markets with consistency, discipline and humility
Full Access $1,500/year
Legacy pricing of $975 for first 35 subscribers, a savings of 35%
-
Direct access to Rob and his live YARP portfolio, featuring a trademarked stock selection process he developed as a private portfolio and fund manager, and his decades of technical analysis experience.
-
24/7 access to Sungarden’s investment research deck
-
Bottom-line analysis of stocks, ETFs, and option strategies
-
Trade alerts and rationale, delivered in real-time
-
Proprietary educational content
-
You won’t get: sales pitches, outlandish claims, greed-driven speculation

