Summary:
- Lucid stock is down over 95% from its all-time highs, with weak technicals and high P/S valuation pressuring it towards penny stock territory.
- The daily and weekly technical analysis shows strong bearish signals, with Lucid stock in a persistent downtrend and no support levels to halt further declines.
- Despite some positive divergence in MACD and RSI, the overall technical outlook remains negative, with moving averages and Bollinger Bands indicating major weakness.
- Fundamentals reveal unstable revenue growth and significant net losses, making the current high P/S ratio unjustifiable and supporting a sell rating for Lucid stock.

Jitalia17
Thesis
Down over 95% from its all time highs, Lucid Group, Inc. (NASDAQ:LCID) stock is now starting to become at risk of becoming a penny stock as it continues to find fresh lows. In the below technical analysis, I determine that both the near term and long term technical outlook is highly bearish as continued signs of weakness heavily outweigh some indications of positive divergence. For the fundamentals, while the latest quarter’s results beat expectations, they are nothing to get excited about as net loss remains significant and while revenue growth was quite strong, the overall stability of revenue growth is still highly in question. For valuation, the P/S ratio nears a 600% premium relative to the sector median and is highly unjustified given the current state of revenues. The P/B ratio is much more reasonable as its slight discount versus the sector median I believe correctly reflects Lucid’s underperformance. Overall, weak technicals and the high P/S valuation will likely continue to pressure the stock moving forward and could push the stock towards near penny stock territory. I therefore initiate Lucid at a sell rating.
Daily Analysis
Chart Analysis
Yahoo Finance
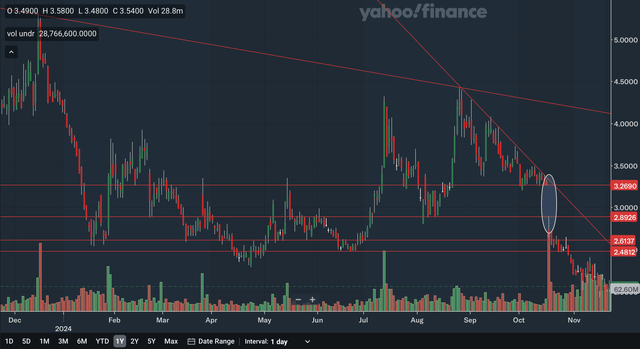
The daily chart is an extremely negative one for Lucid as the stock is in both a longer term downtrend and a sharp near term downtrend. There is also heavy resistance overhead with no support beneath the stock. The nearest resistance level would be in the high 2.4s as that zone was support in June and in October. The next source of resistance would be the sharp downtrend line that has just moved below 2.6. This trend line started back in August and has been touched multiple times already, making it a highly significant line, especially considering its strong downward trajectory. Moving up, there is a resistance level in the low 2.6s as that price level was support throughout the past year. The high 2.8s is another resistance zone as this area was support back in February and in August but was resistance in May and June. We also have a large downside gap at 3.269 that could be a significant source of resistance moving forward. Lastly, the slower longer term downtrend line is distant resistance as it remains above 4.0. Overall, I believe there are no positives to be seen here as there is no support to stop the stock from dropping further.
Moving Average Analysis
Yahoo Finance
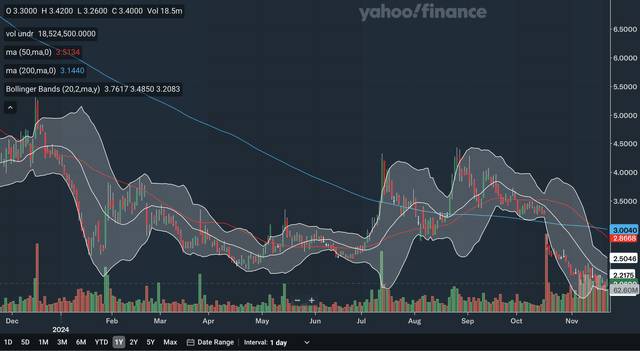
The 50 day SMA had a death cross very recently with the 200 day SMA, of course a highly bearish signal. The gap between the SMAs is quickly expanding and the 50 day SMA’s trajectory is worrying. The stock trades far below both of the SMAs as the 50 day SMA’s resistance is in the mid 2.8s. For the Bollinger Bands, the stock is currently quite near the lower band, making the case that the stock could be near term oversold. The 20 day midline of the Bollinger Bands is the nearest source of MA resistance at 2.2175 since the stock is in a sharp near term downtrend. This midline has already been resistance since September and could continue to pressure the stock. As a whole these SMAs and Bollinger Bands continue the flurry of bearish signals for Lucid stock as there are no signs of strength here.
Indicator Analysis
Yahoo Finance
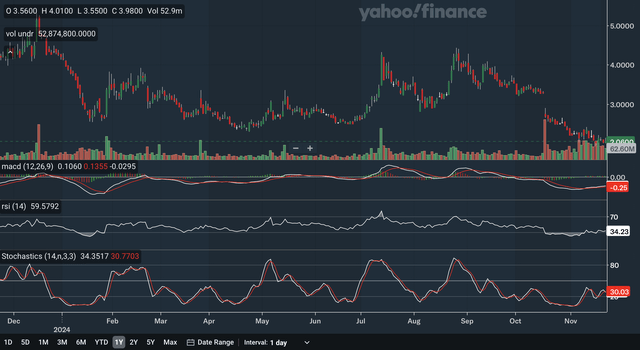
The MACD is above the signal line after it crossed above it earlier this month, the first positive indication with Lucid stock. The gap between the lines have been relatively small though, showing that there is still indecisiveness in the stock. There is also positive divergence with the MACD. While the stock has made new lows recently and is much below the January trough, the MACD is at a higher level than seen back then. This a subtle sign of strength in the stock that investors should find noteworthy. For the RSI, it is currently at 34.23 after being in oversold territory earlier this month. The RSI also shows some bullish divergence as it too remains far higher than levels seen at the January trough. Lastly, for the stochastics, the %K just crossed below the %D, a bearish indication despite the crossover not occurring in the overbought 80 zone. The stochastics has been under the 50 level since early September showing that the bears have been in solid control in the past couple of months. Overall, in my view, despite a mix of bullish and bearish indications, the first real sign of hope for Lucid stock comes with the positive divergence in both the MACD and RSI.
Takeaway
There is no doubt that the near term technical outlook for Lucid stock is negative but there are some positive signs when digging into the indicators. The chart showed that the stock remains in both a slower and sharper downtrend while the MAs and Bollinger Bands showed major weakness in the stock. Lastly, hope for the stock comes in the form of positive divergence that could indicate some strength beneath the surface.
Weekly Analysis
Chart Analysis
Yahoo Finance
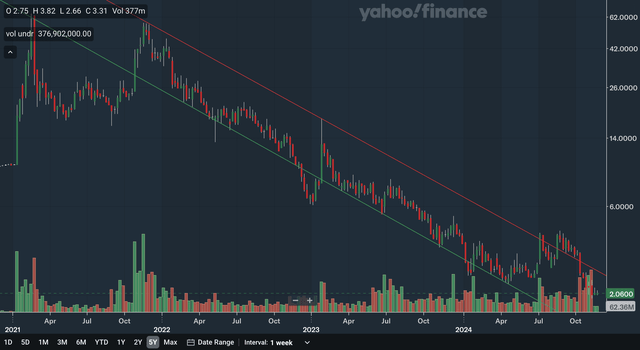
The weekly chart here is in a log scale to make seeing the long term picture easier. The stock is bound in a downward channel that began in late 2021. There was a false breakdown below the channel in late 2022 and a false breakout above the channel earlier this year but I would consider this channel to still be intact as both lines have been bounced off multiple times. The stock is currently trading in between the two channel lines making long term support and resistance relatively far away. The support of the lower channel line is out of range on this chart while the resistance of the upper channel line is inching towards the 2.0 area. The false breakout earlier this year is a bearish indication as it shows that the stock does not have the power to break though this years long source of resistance. As a whole, this weekly chart is mainly negative as the stock remains bound in this downward channel with support of the lower channel line out of range.
Moving Average Analysis
Yahoo Finance
Yahoo Finance
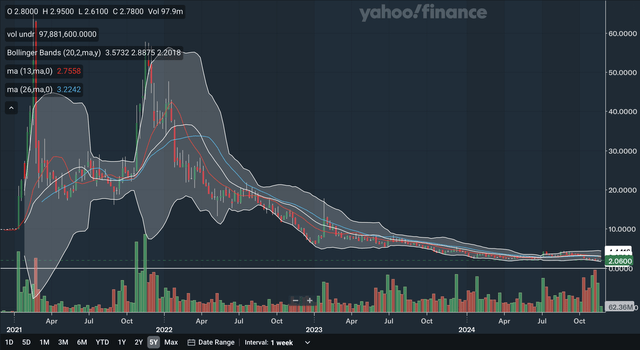
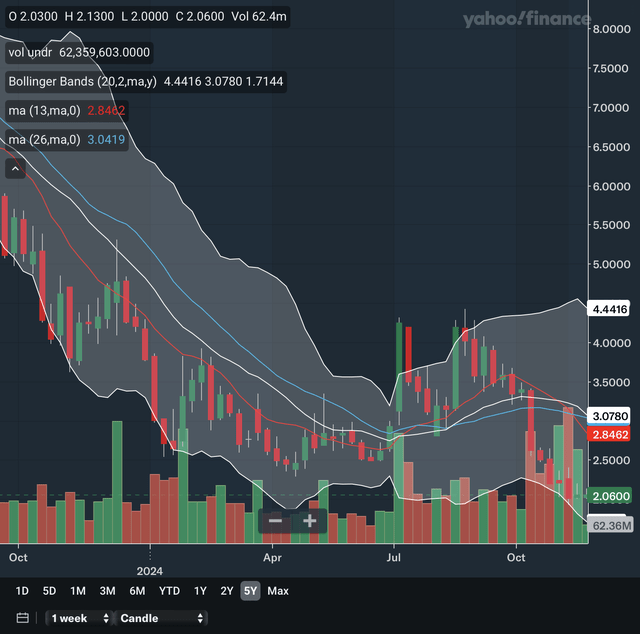
The above chart is a longer term view while the chart on the right is a zoom in to make seeing the near term development easier. The 13 week SMA crossed below the 26 week SMA very recently, a negative signal. The 13 week SMA’s trajectory is worsening quite quickly and so the gap between the SMAs is expected to increase, showing that bearish momentum may be accelerating. The stock is also trading far below both of these weekly MAs as the 13 week SMA’s resistance is only at 2.8462. As for the Bollinger Bands, the stock broke below the 20 week midline in October, ending near term hopes of an uptrend forming. The stock is currently relatively near the lower band perhaps showing that the stock is near oversold. The midline’s resistance remains relatively far, however, as it is still above the 26 week SMA. Like in the daily analysis, there is not much to like here as all signs point toward further weakness in the stock.
Indicator Analysis
Yahoo Finance
Yahoo Finance
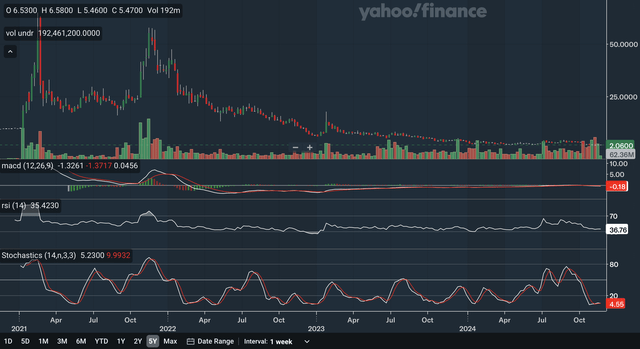
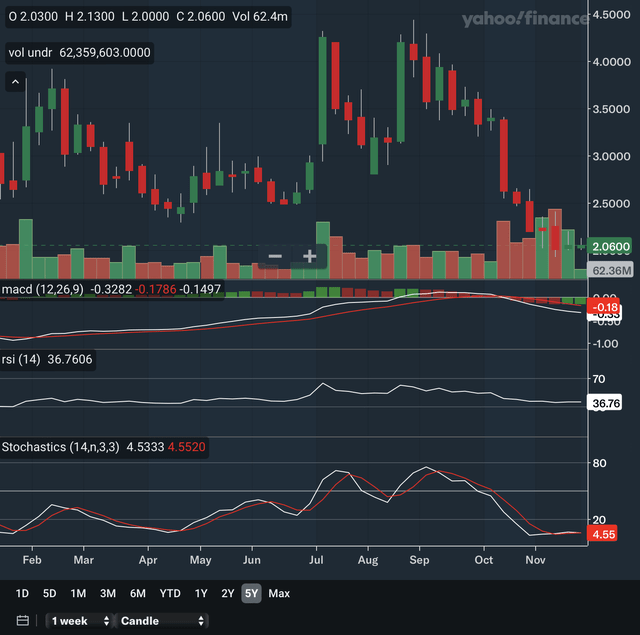
Again, the top chart shows the long term view while a zoom in is on the right. The MACD crossed below the signal line in early October, a bearish indication. The gap has widened quite a bit but has been lately narrowing slightly as indicated by the green histogram. This shows that at least bearish momentum has been relatively contained for the time being. The MACD also shows some positive divergence here as the stock has continued to fall since early 2022 but the MACD has been strengthening since then. The RSI is currently at 36.76 after breaking below the critical 50 level in October, reflecting that the bears are now in control of the stock. There is also positive divergence with the RSI since the stock is lower than in the trough at the beginning of 2023 but the RSI has not dropped below the oversold 30 level since that period. For the stochastics, the %K and %D have been inseparable lately and there has been no crossover signals for quite a while. However, the current stochastics reading of 4.55 is at or very near all time low levels, making the case that stock’s recent slump is in fact confirmed. In my view, the immediate signals here are quite bearish with many red flags in the indicators while the long term signals are a bit mixed as the positive divergence in the MACD and RSI are bullish but the extremely low stochastics provides indication that there is in fact major weakness in the stock as it slumps to all time lows.
Takeaway
The overall longer term technical outlook for Lucid stock is also a negative one as bearish signals outweigh indications of strength by the MACD and RSI. The chart shows the stock is bound in a strong downward channel after a failed breakout earlier in the year while the MAs and Bollinger Bands were extremely bearish. For the indicators, as discussed above, while there are signs of strength from the positive divergences, the stochastics’ extremely low reading highly offsets those bullish indications.
Fundamentals & Valuation
Earnings
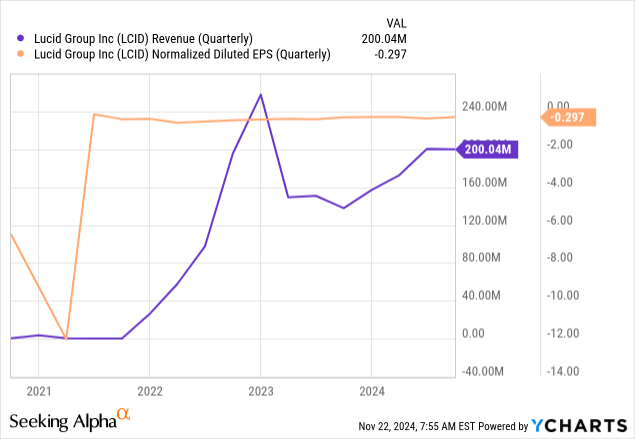
Lucid reported their 2024 Q3 earnings on November 7th and generally showed mixed results. They reported revenues of $200.038 million up significantly from the prior year period’s $137.814 million. For EPS, they reported an adjusted net loss figure of $0.28, virtually unchanged from the prior year period’s $0.27. Both revenue and EPS managed to slightly beat expectations as revenue was able to beat by $1.90 million while adjusted EPS beat by $0.03. As you can see in the above chart, revenue has rebounded somewhat but remains quite far from the peak levels seen at the end of 2022 while adjusted EPS has marginally improved since early 2022. With revenue growth’s stability in question and the net loss still considerable, Lucid is still under pressure to perform better as these results are unlikely to satisfy investors in the long run. Another noteworthy point in their earnings include an increase in ending cash, cash equivalents, and restricted cash from $1.17 billion to $1.89 billion, showing that the company still has capital to burn.
Valuation
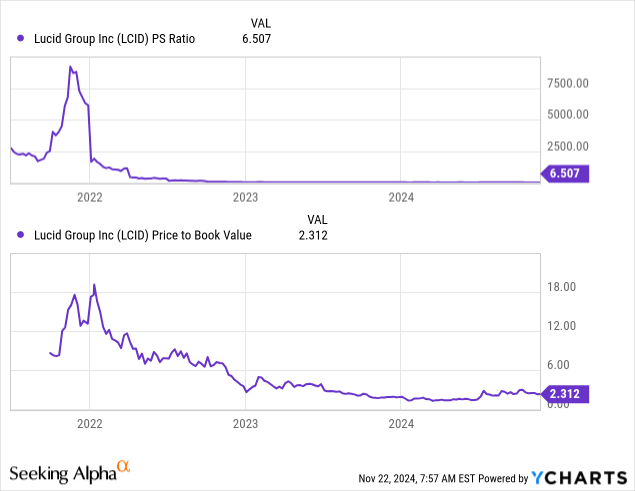
The P/S and P/B ratios are at rock bottom levels compared to Lucid’s valuation history but the P/S ratio is still extremely high compared to its sector. The P/S ratio is currently at 6.507 after being over a laughable 7500 in 2021. The sector median P/S is only at 0.95, making Lucid’s P/S premium a whopping 582.89%. Given the current state of Lucid’s revenues as shown in the revenue chart above, I believe it is hard to justify such a valuation. For the P/B ratio, it is currently at 2.312 after being over 18 at the beginning of 2022. It has rebounded slightly as of late but remains 17.56% below the sector median of 2.18. This could indicate moderate undervaluation in the stock but given that net losses remain quite large for Lucid, this percentage below the median is not unreasonable in my opinion. Overall, I would say that the P/S ratio has gone from an extremely overvalued state to still a very overvalued position while the P/B has gone from an extremely overvalued reading to a quite fair level. Considering these ratios together, however, I would still conclude that the stock is overvalued at current levels as the unstable revenue cannot possibly justify a P/S premium of nearly 600% above the sector median.
Conclusion
Despite some positive divergence signals in the MACD and RSI in both time frames, the vast majority of technical signals were bearish, indicating continued pain for Lucid stock. Charts showed the stock remains in downtrends and moving averages show accelerating bearish momentum. The indicators were a bit more mixed but with the presence of significant bearish indications, I conclude that they show an uncertain outlook at best. As for the fundamentals, while this quarter’s revenue growth was quite strong, the long term trajectory of revenue is still highly unstable and while net loss has narrowed somewhat in the past few years, it remains far from the breakeven level. As discussed above, the large P/S ratio premium is highly unjustified with respect to Lucid’s financials while the P/B ratios’ discount relative to peers is justified due to the company’s weak performance. A combination of bearish technicals and an overall overvalued stock leads me to believe that Lucid could continue to slide and begin to flirt with penny stock territory. Therefore, I initiate this stock at a sell rating.
Analyst’s Disclosure: I/we have no stock, option or similar derivative position in any of the companies mentioned, and no plans to initiate any such positions within the next 72 hours. I wrote this article myself, and it expresses my own opinions. I am not receiving compensation for it (other than from Seeking Alpha). I have no business relationship with any company whose stock is mentioned in this article.
Seeking Alpha’s Disclosure: Past performance is no guarantee of future results. No recommendation or advice is being given as to whether any investment is suitable for a particular investor. Any views or opinions expressed above may not reflect those of Seeking Alpha as a whole. Seeking Alpha is not a licensed securities dealer, broker or US investment adviser or investment bank. Our analysts are third party authors that include both professional investors and individual investors who may not be licensed or certified by any institute or regulatory body.
