Summary:
- AECOM has benefitted from multiples expansion due to its higher returns on capital versus benchmarks and consistent performance over time.
- Its economic characteristics result in high turnover on capital employed in the enterprise.
- Valuations are sensible, and the discounted value of free cash flow could be worth >$0.88 on per dollar of sales if business continues at this steady state.

Pgiam/iStock via Getty Images
Investment Thesis
Founded in 1980 and headquartered in Dallas, Texas, AECOM (NYSE:ACM) is in the construction consulting and advisory business. Its clients include (i) large corporations, (ii) governments and (iii) various organizations in the transportation, energy and utilities markets. The business operates through 3 segments; (1) the Americas and (2) international divisions, which provide core advisory services to public and private sectors; and (3) AECOM Capital (“ACAP”) that predominantly invests in real estate projects.
Global demand for data centres has expanded ad infinitum, with AI backed tailwinds that will result in large capital inflows to AI-linked infrastructure projects. That means multiple opportunities exist outside of tech to prosper, downstream along the AI value chain. Alongside this are secular drivers from energy and core infrastructure.
Governments in G20 nations have ramped up expenditures to 1) upgrade outdated grid infrastructure, 2) allow for more capacity, and 3) prevent grid congestion with the anticipated surge in energy demand. Major public works continue to develop in the US, EU and APAC, where ACM has its tentacles wrapped firmly. On the data centres front, ACM management continues to identify growth opportunities at multiple points along the data centre value chain. For example, it notes transmission and distribution backlog has increased 5x over the last 3yrs, such that it now expects a record year of business in ’25.
My view, based on analysis of the economic facts in the investment debate, is that (i) ACM has an extensive runway to retain and re-deploy earnings to compound the intrinsic worth of the business whilst (ii) throwing off high sums of freely available cash, after all reinvestment considerations to maintain its competitiveness and grow are considered.
Net-net, on the balance of 1) highly profitable revenue growth, 2) record backlog position, and 3) runway to redeploy capital into high-growth markets, I rate ACM a buy.
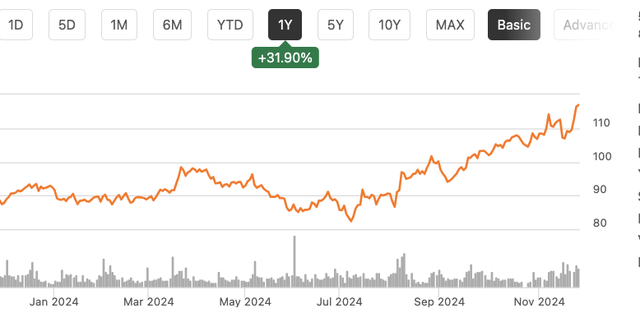
Chart: ACM 12-month price evolution
Seeking Alpha
Compelling upside factors
Industry factors:
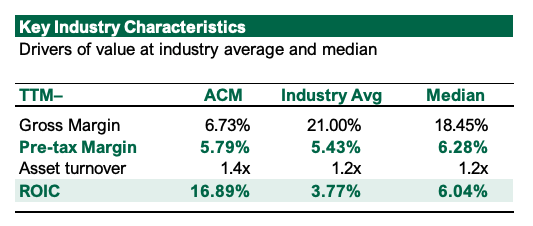
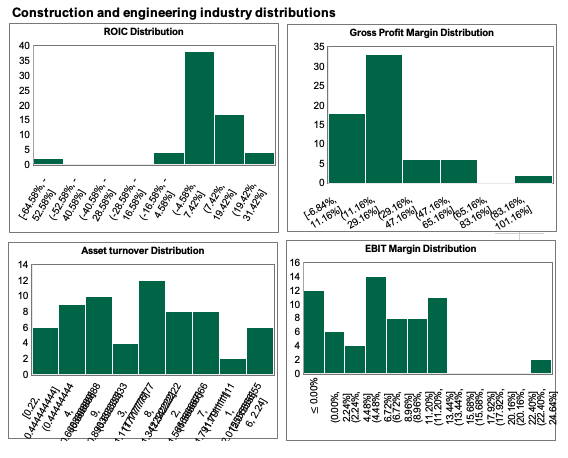
- The construction and engineering industry is broad and presents with commodity like economics. Products are largely the same for those on the construction end, and the services are also largely the same, with all due respect, across various businesses. The points of differentiation are in those businesses that produce operating efficiencies + capital efficiencies. Because it is a profitless race to the bottom in the effort to secure volume of work, operating margins are single digits and some of the worst of any industry, averaging ~5.4% and ~6% median.
- ACM falls within the centre of the distribution on operating margins but sits towards the right of the distribution in asset turnover of 1.4x vs. industry averages of 1.2x (Figure 1). Stripping non-operating assets out of the calculus, the business turns over ~$3 for very $1 that’s been invested into the enterprise. Subsequently, ACM’s legacy and incremental capital produce ~2.5x the return than the industry, meaning the business commands a premium valuation relative to peers.
Figure 1.
Seeking Alpha
Bloomberg, Author
Financial outlook:
- Looking to FY’25, management expects net service revenue (“NSR“) to expand 500bps–800bps YoY. Consensus is calling for 6% growth at the top, getting to $17Bn in revenue, stretching up to $18Bn by FY’27. ACM’s current book-to-bill ratio is 1.2x (a ratio of >1x is preferred, indicating more orders in demand than being serviced). Several tailwinds exist in international markets, including Australia, where a $120 billion project underway as part of a 10-year infrastructure plan in the country.
- These economic characteristics are attractive in my eyes and allow for a long runway to retain and re-deploy earnings at a statistical advantage.
Business economics:
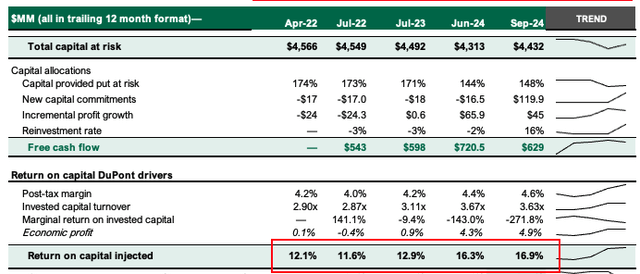
- ACM earns high rates on the net tangible assets it requires to operate. It earned 12% on capital in ’22, stretching up to 17% in the last 12 months ( this outstrips long-term average returns on ‘market’ capital, assumed at 12% here).
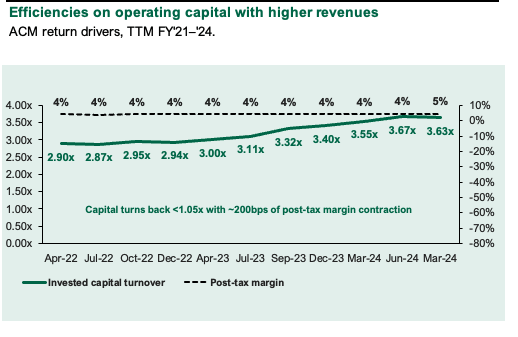
- There have been no additional gains at after-tax margins, which are steady at ~4% of sales across the testing period. But turnover has increased substantially such that every dollar of capital invested in the business is returning >$3.60 of sales, up from $2.90 to years ago (Figure 2, Figure 3).
Figure 2.
Company filings
Figure 3.
Company filings
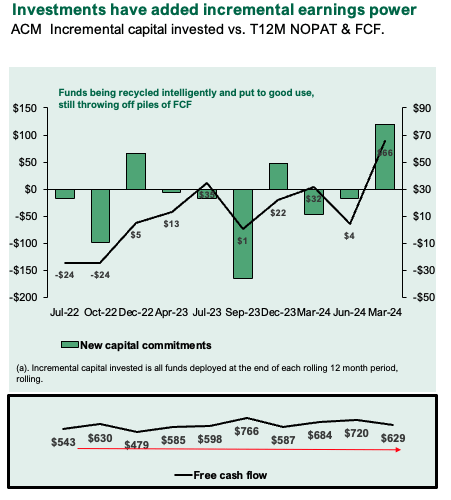
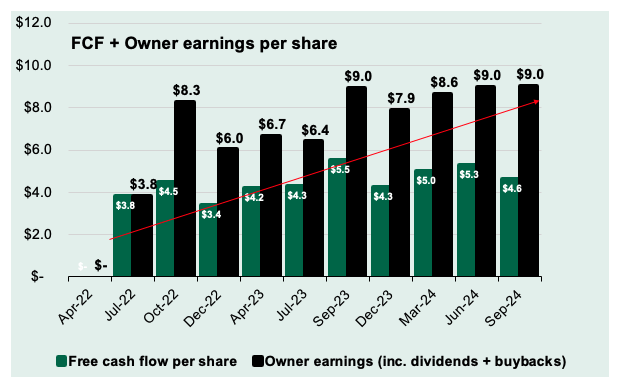
- Incremental profit growth has been positive since ’22 on a rolling 12 month basis, despite the business shedding capital through buybacks this year. In my opinion, funds are being recycled intelligently and put to good use, still throwing off >$600mm in freely available cash after all CapEx required to maintain competitiveness and grow (Figure 4). As a result, FCF has been steady and large, and ranged between $3.40 to $5.50/share. But owner earnings, defined as a free cash flow per share plus all dividends and buybacks returned to owners – has lifted from $3.80 per up to $9 per share in the last 12 months, a 54% compounding growth rate (Figure 5).
Figure 4.
Company filings
Company filings
Figure 5.

Company filings
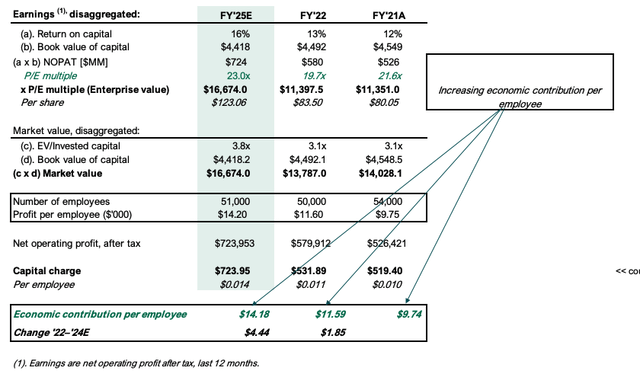
- Being in the services domain, gauging the economic contribution of employees is essential. The business earned ~17% on capital in the last 12 months, with 51,000 employees on the book. It had 3,000 employees less than FY’21, but 1,000 more than FY’22. Critically, profit per employee has increased from $9,750, up to $14,200 at the time of writing (Figure 6). The change in economic contribution from 2022 to date is $4,400/employee. This puts it towards the right side of the distribution of the industry. Notably, the business trades at ~23x NOPAT vs. ~22x NOPAT vs. FY’21.
Figure 6.
Author
Valuation insights
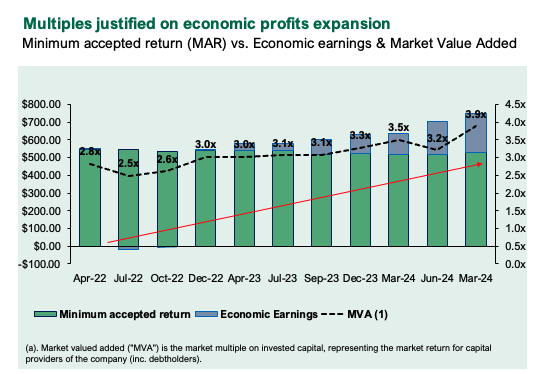
Because ACM’s revenue growth has been highly cash generative, it has attracted investors seeking to move up the quality spectrum and likely participate in AI-related themes, albeit in opportunities outside of tech. Investors have willingly paid higher multiples on the business’s invested capital knowing that a dollar invested in any AI theme is likely worth many multiples more in the market, and that for ACM, underneath every dollar of earnings has been >$1 of free cash flow (1.15x earnings in FY’24). The market has valued ACM’s invested capital higher because it is earning a higher return (which is increasing) than most peers.
Figure 7.

Bloomberg, Author
Figure 8.
Author
Critically, ACM hit a 10% FCF margin on NSR in FY’24, and I’m going to look at its cash production in 2 ways here.
- Firstly, if that, beneath a dollar of earnings lies $1.15 in freely available cash, when capitalized at our opportunity cost of 12%, it is worth nearly $9.60. Management projects ~13% bottom line growth in FY’25, where it could earn $5.10 per share at the midpoint. At this same conversion, the cash underneath these earnings could be worth ~$5.86 on the dollar at maturity, implying ~$48.80/share additional market value (5.1×1.15 x $5.86; $5.86/0.12 = $48.80). This gets us to ~$165/share.
- There’s also the $0.10 FCF margin on NSR. This is worth $0.88 when capitalized and a 12% opportunity cost ($0.1/0.12 = $0.88). The 500bps projected growth in sales could produce up to $17Bn in sales, up from $16.05Bn last year. My estimates on NSR on this, based on the average margin of NSR to total sales over the last 2yrs, is 45%, getting us to ~$7.8Bn in NSR ($58/share) vs. $17Bn in total sales. At the 10% margin this would throw off $778mm in FCF ($5.88/share). This is valued at $49/share to me at a 12% discount rate ($5.88/0.12 = $49), similar to above, again getting me to ~$165/share.
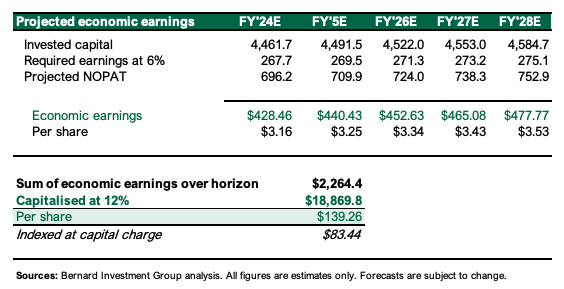
- Finally, the discounted value of freely available cash above investments of less perceived risk, sum to $140 per share or 4x EV/IC. This to me is the valuation range, supporting a buy rating.
Figure 9.
Author
Risks to thesis
On the downside, 1) growth rates could stall and 2) AI related tailwinds could fade, meaning returns could compress and lead to compression in multiples. Higher prices are being paid for a dollar of earnings in the future, and expectations are high. A rotation out of industries adjacent to tech into defensives could follow if that’s the case. Investors should also keep a very close eye on the inflation/rates and what it could mean on the directional bias of markets.
In short
ACM is a high quality business with a lengthy runway to retain and reinvest earnings at an advantage. It is a non-tech beneficiary of the structural tailwinds AI is breezing behind markets, supported by large sums of tangible investment into the sector. The investment case is supported by the growth outlook of this particular segment on a global scale. My view is ACM can 1) continue to produce modest sales growth with earnings leverage, 2) on reasonable amounts of incremental capital invested into high margin segments [services, water, and so forth], where 3) underneath every dollar of incremental sales is free cash flow valued at ~$0.88 once these assets/programs are at full utilization. My view is the stock is worth $140–$165 per share today. Net – net rate buy.
Analyst’s Disclosure: I/we have a beneficial long position in the shares of ACM either through stock ownership, options, or other derivatives. I wrote this article myself, and it expresses my own opinions. I am not receiving compensation for it (other than from Seeking Alpha). I have no business relationship with any company whose stock is mentioned in this article.
Seeking Alpha’s Disclosure: Past performance is no guarantee of future results. No recommendation or advice is being given as to whether any investment is suitable for a particular investor. Any views or opinions expressed above may not reflect those of Seeking Alpha as a whole. Seeking Alpha is not a licensed securities dealer, broker or US investment adviser or investment bank. Our analysts are third party authors that include both professional investors and individual investors who may not be licensed or certified by any institute or regulatory body.
