Summary:
- Ardmore Shipping beat earnings expectations in seven out of the last eight quarters, raised its dividend by 47.6%, and 1Y price performance is +66%.
- According to consensus estimates, EPS is projected to grow 24% in FY24.
- Ardmore Shipping showcases a forward dividend yield of over 5.87% and EBIT and net income margins of ~30%.
- Based on strong momentum, profitability, and a solid dividend, SA’s Quant Team rates Ardmore Shipping a Strong Buy.
Kanoke_46/iStock via Getty Images
Ardmore Shipping Corporation (NYSE:ASC) exceeded consensus expectations for the fifth consecutive quarter on May 8, beating earnings seven times in two years, and raised its dividend by 47%. ASC is up 66% in the past year, almost 50% YTD, with EPS projected to rise 24% in FY24, according to consensus estimates. In light of booming momentum, a solid dividend, attractive profitability metrics, and low volatility, SA’s Quant Team rates ASC a Strong Buy.
Ardmore Shipping Corporation (ASC)
-
Market Capitalization: $881.32M
-
Quant Rating: Strong Buy
-
Quant Sector Ranking (as of 5/14/24): 3 out of 238
-
Quant Industry Ranking (as of 5/14/24): 2 out of 55
ASC is the #2 quant-rated stock in the Oil and Gas Transportation industry, as of this writing, and a top quant-rated stock in the Energy sector. ASC, founded in 2010, engages in the seaborne transportation of petroleum products and chemicals worldwide, with 26 vessels in operation, including 20 Medium Range tankers and six product/chemical tankers, as of Q124. SA Factor Grades rate investment characteristics on a sector-relative basis. ASC’s Strong Buy Quant Rating is driven by As in Profitability, Momentum, EPS Revisions, and Bs in Valuation and Growth. ASC also has bullish ratings from SA and Wall Street sell-side analysts.
ASC Factor Grades (SA Premium)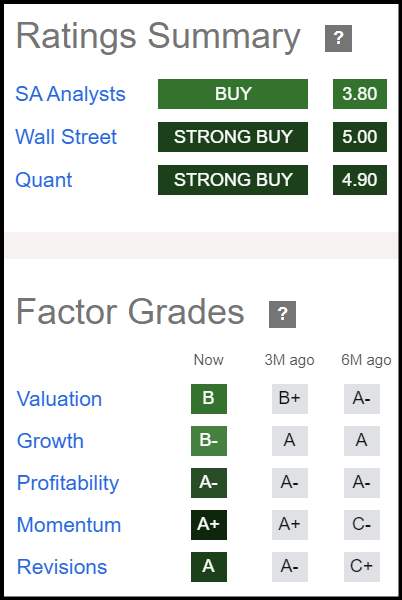
ASC Q124 Results & Outlook
Ardmore’s Q124 results delivered Non-GAAP EPS of $0.92, beating by $0.04, and revenue of $106.3M (-10.10% YoY), beating by $33.51M. In its Q124 presentation, Ardmore said tailwinds from geopolitical events and disruptions underpinned by strong demand have allowed ASC to capitalize on sequential increases in Time Charter Equivalent (TCE) rates. ASC said TCE rates remained elevated in Q124 and have strengthened into the second quarter.
ASC Tanker Outlook (ASC Investor Presentation)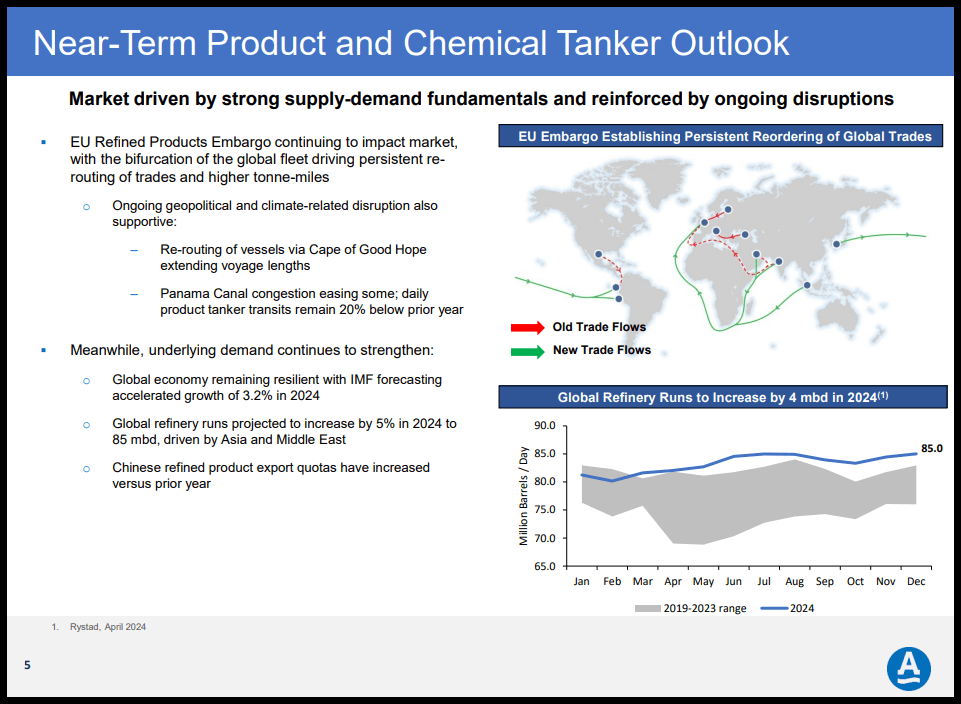
ASC provided positive guidance regarding potential TCE rates based on 60% total revenue days fixed for the second quarter. ASC said the company’s fleet average TCE rate is expected to rise to $37,400 per day in Q2 from $34,700 per day in Q1. According to consensus estimates, ASC EPS is projected to rise 24% in FY24, including nearly +70% in Q224.
ASC Stock Momentum
ASC is up 66% in the past year and nearly 50% YTD, beating the S&P 500 and the Energy Select Sector Index (XLE).
ASC Price Performance (SA Premium)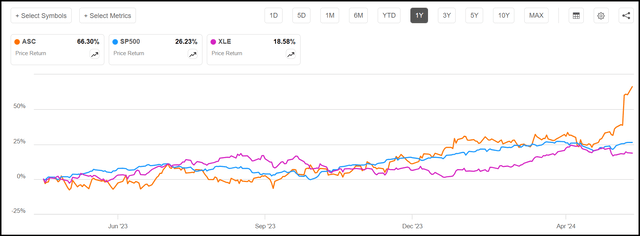
ASC momentum is crushing the median of quant-rated energy sector stocks in 1Y, 9M, 6M, and 3M price performance, driving an ‘A+’ Momentum Factor Grade. Total returns is up nearly 75% in the past year and almost 395% in the past three years, crushing the S&P 500 total 3Y return of +33%.
ASC Stock Profitability & Valuation
ASC ‘A-’ Profitability Grade is driven by Levered Free Cash Flow Margin TTM of almost 20%, more than 220% above the energy sector median of 6%, and EBIT margin TTM of over 30%. Impressive net income margin of nearly 30% outperforms the sector by over 150%. ASC also showcased ROE of 20%, ROTC of 11%, and ROA of 15%.
ASC Profitability Grade (SA Premium)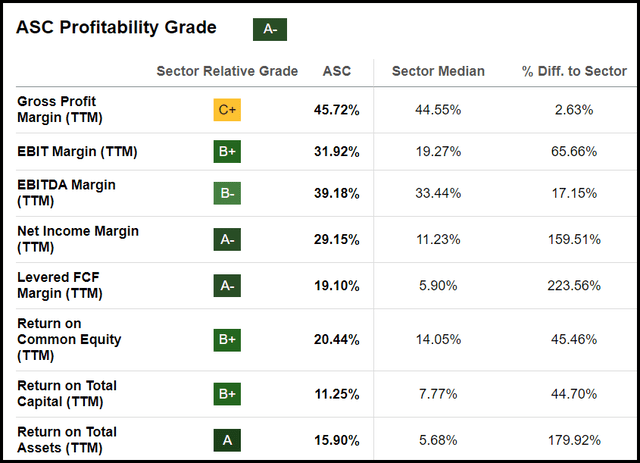
ASC is trading at 6.18x earnings forward, representing a 46% discount to the sector median of 11.46x for a ‘B’ in Valuation. EV/EBITDA FWD of 4.88 is also solid vs. the sector’s 5.74 and EV/EBIT FWD is 6.14 vs. 9.49 for the sector.
ASC’s SA Quant Dividend Scorecard
ASC, on May 8, declared a quarterly dividend of $0.31 per share, up 47.6% from the prior dividend of $0.21, in accordance with the company’s policy of paying out one-third of earnings. ASC’s ‘A’ SA Quant Dividend Growth Grade is driven by a dividend per share growth rate FWD of almost 30% vs. ~9% for the sector. ASC has a ‘B-’ Dividend Safety Grade, highlighted by a cash dividend payout ratio of 33% vs. 42% for the sector.
ASC Dividend Scorecard (SA Premium)
ASC garners a ‘B-’ in Yield with a dividend yield TTM of 4.31% and dividend yield FWD of 5.87%. 1Y yield on cost is 7%, 3Y almost 20%, and 5Y 12%.
ASC Dividend Yield Grade (SA Premium)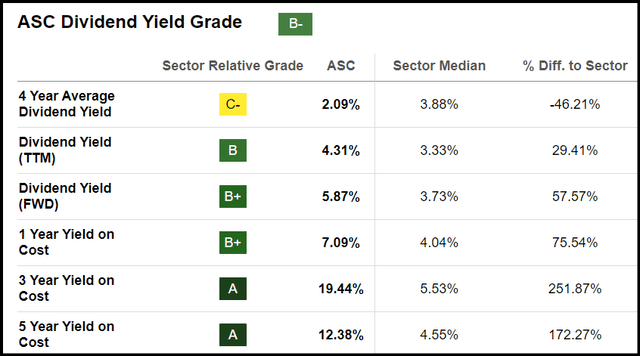
ASC Stock Risk And Financial Health
The overall SA Quant Rating also takes into account a stock’s risk, in addition to size, which are not included among the five factor grades. ASC has a 60M Beta of 0.37, indicating the stock is significantly less volatile than the market. ASC’s Altman Z Score, calculated based on profitability, leverage, and liquidity metrics, of 4.97 is well above the 1.8 financial distress level. ASC has a solid balance sheet compared to other small-cap industry peers, with debt of $72M, cash of $48.62M, and D/E ratio of 11.9%. ASC has lowered its debt over the past four quarters by over 50%. ASC also showcases a solid covered ratio of 11.11, indicating the company’s operating profit is significantly higher than debt payments.
ASC Balance Sheet vs. Peers
ASC Balance Sheet vs. Peers (SA Premium)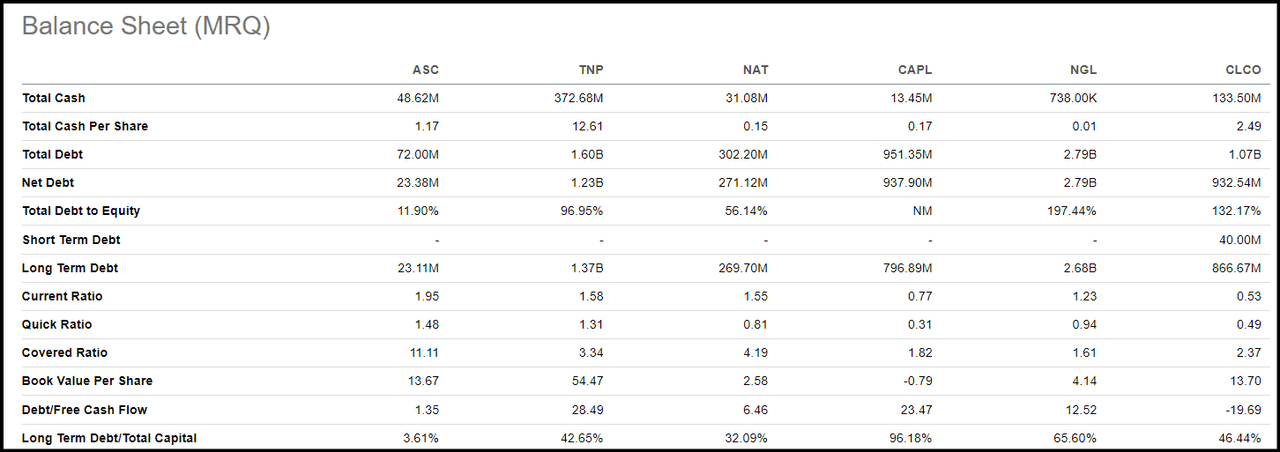
Although dividend safety and growth grades are solid, ASC has low marks in consistency, with zero consecutive years of payments and growth. Consensus EPS forecasted growth for FY24 is strong, however, earnings are projected to fall in FY25 and FY26.
Concluding Summary
Ardmore Shipping has exhibited strong momentum, growth, and profitability over the past year and is coming off another earnings beat – its seventh in two years. The company raised its dividend by 47.6% and EPS is projected to grow 24% in FY24, and profit margins are crushing the sector. SA’s Quant Team rates ASC a Strong Buy. If you’re seeking a limited number of monthly ideas from the hundreds of top quant Strong Buy rated stocks, the Quant Team’s best-of-the-best, consider exploring Alpha Picks.
Analyst’s Disclosure: I/we have no stock, option or similar derivative position in any of the companies mentioned, and no plans to initiate any such positions within the next 72 hours. I wrote this article myself, and it expresses my own opinions. I am not receiving compensation for it. I have no business relationship with any company whose stock is mentioned in this article.
Seeking Alpha’s Disclosure: Past performance is no guarantee of future results. No recommendation or advice is being given that any particular security, portfolio, transaction or investment strategy is suitable for any specific person. The author is not advising you personally concerning the nature, potential, value or suitability of any particular security or other matter. You alone are solely responsible for determining whether any investment, security or strategy, or any product or service, is appropriate or suitable for you based on your investment objectives and personal and financial situation. Steven Cress is the Head of Quantitative Strategy at Seeking Alpha. Any views or opinions expressed herein may not reflect those of Seeking Alpha as a whole. Seeking Alpha is not a licensed securities dealer, broker or US investment adviser or investment bank.
I am Steven Cress, Head of Quantitative Strategies at Seeking Alpha. I manage the quant ratings and factor grades on stocks and ETFs in Seeking Alpha Premium. I also lead Alpha Picks, which selects the two most attractive stocks to buy each month, and also determines when to sell them.
