Summary:
- Procter & Gamble’s stock has outperformed its large-cap staple peers in 2024, but now faces a critical Q1-25 earnings event that could influence future performance.
- PG has missed topline estimates for three straight quarters now, and the weak organic growth trend may not necessarily reverse in Q1 given a difficult base.
- PG’s largest product segment-Fabric Care isn’t firing on all cylinders, while its second largest market-China too will likely face challenges.
- PG’s forward valuations are not prohibitive, particularly in light of the implied operating leverage over the next 3 years.
- Yet, we also highlight why the PG stock does not represent a good BUY now.
monticelllo/iStock Editorial via Getty Images
Introduction
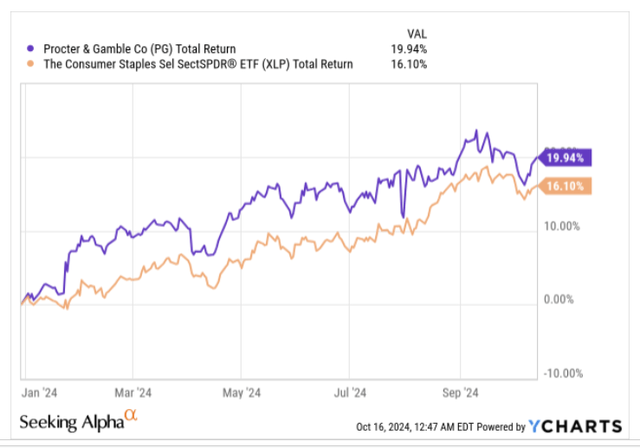
Procter & Gamble (NYSE:PG), one of the prominent consumer goods entities in the world, has seen its stock perform rather well this year; all through 2024, it has managed to consistently stay ahead of other staple peers from the S&P500 (on average), and as things stand, is up by a healthy 20% on YTD basis.
In a couple of days, the PG stock will encounter a catalyst that could be instrumental in facilitating even further outperformance (or vice versa, like the previous quarter, where the share ended up gapping down and falling lower by 7%). The catalyst in question is the Q1-25 earnings event (PG follows a June ending fiscal) which is due to take place on the 18th of October before market hours. In this article, we’ll touch upon some of the key sub-plots that could dominate the event.
Earnings- What To Keep An Eye On?
Stakeholders of PG may likely be experiencing some degree of trepidation, as the company’s performance during earnings season has been quite mixed in recent periods. On the bottom-line front, there hasn’t really been a problem. For context, over the last 3 years, it has missed quarterly consensus EPS numbers just once (the June 2022 quarter), and just about met street estimates once (the December 2022 quarter). However, on all the other 10 instances, it has managed to beat street estimates, and on average, you’re looking at a business that facilitates earnings beat to the tune of +3% every quarter.
Seeking Alpha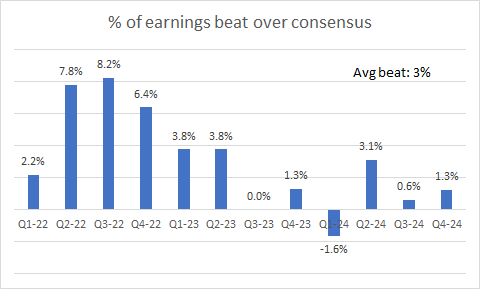
It’s the top line where things appear to be dicey, as PG has now wobbled in each of the last 3 quarters. In Q2-24, the topline miss came in only at -0.3%, but in Q3 and Q4-24, the magnitude of topline attrition (relative to consensus numbers) has exceeded the 1% mark.
For the upcoming Q1, the two key headline numbers to watch are an EPS of $1.90 and a revenue figure of $22.01bn.
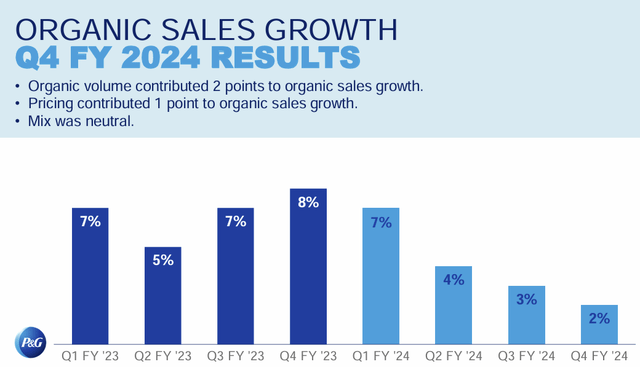
Keen scrutiny will fall on PG’s organic sales growth, as this was a big miss in the previous quarter (delivered only 2% growth whereas consensus was budgeting for +3.4%), and was instrumental in sending the share price lower. Separately note that it has been trending lower for 4 straight quarters now, so if PG can show signs of arresting this trend, it should be taken well by the market. However, it won’t be easy to facilitate, as last year’s base effect (Q1-24) too was quite high at 7%. Even if we don’t quite see an uplift in Q1, better trends are expected in the quarters ahead, as PG expects to close next year having delivered organic sales growth of +4%
PG is also poorly positioned as its largest product segment- Fabric care (24% of group sales, twice as much as the next largest contributor-Home Care), is currently not generating any organic growth, and globally it lost share by 1% last quarter. The European component of fabric care is unlikely to stage any dramatic growth numbers any time soon, as it is up against difficult comparables from last year. However, we would be looking for signs for the North American business to show some signs of life (despite higher promotions) as PG had launched a new innovation bundle (for instance, combining high penetration products with low penetration products such as liquid detergent and fabric enhancers) in the Spring season.
What could also prove to be a drag in Q3 is the Chinese Fabric portfolio where PG is in the midst of undertaking portfolio rationalization decisions (focusing only on the profitable part of the business and trimming the rest) that will have an adverse short-term impact but could work well in the long-run.
Speaking of China, this is a key terrain not just for Fabric, but the overall PG business, as it is the second-largest business for them. PG does deserve some credit for holding share in both their online and offline businesses (excluding the impact of high-end skincare brand SK-II on account of the Japanese linkage) there when consumer confidence had almost dipped to record lows last month. The jury is still out on whether the government’s fiscal measures will be sufficient to stimulate consumer momentum, but if PG management can provide positive granular details on a pickup in trends here, it should be taken well by the market. The ongoing drop-off in SK-II sales, a super-premium brand with strong ASPs (average selling prices) has played a part in the ’mix’ facet being only a neutral contributor to PG’s organic sales growth, but in September, PG management highlighted how consumers were now becoming more receptive to the revamped version of the brand again.
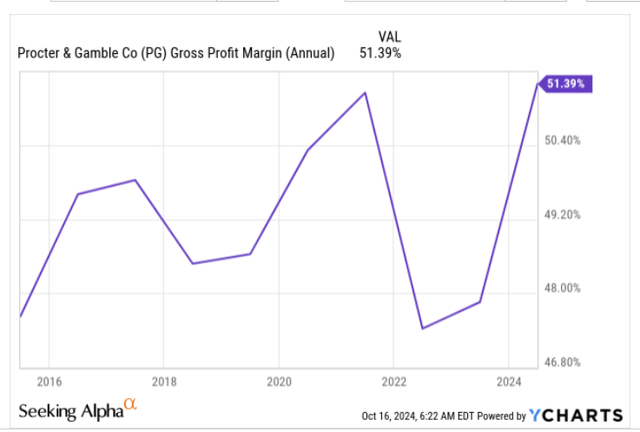
Despite a weak mix effect, note that PG’s gross margins (GM) are at decade highs now, and in the last quarter grew by 120bps. We would expect GM progress to persist in Q1-25, as PG still has a long-term goal of extracting$1.5bn worth of pre-tax gross savings from the cost of goods line due to productivity initiatives.
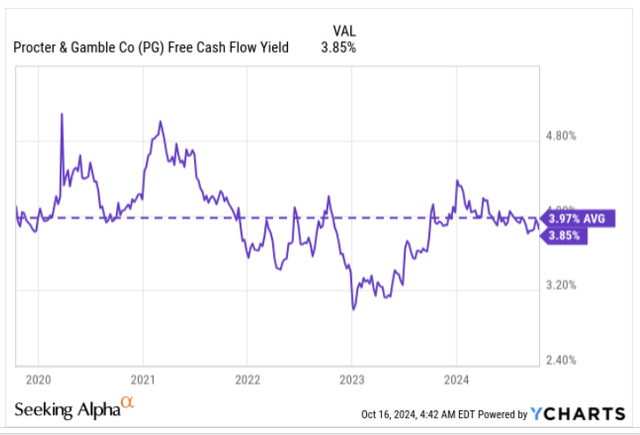
PG’s free cash performance will also receive plenty of attention too, as it serves as the foundation of the company’s stellar dividend profile. Note that at the current share price, the PG’s shares’ FCF yield is already below its long-term average. One key metric to watch here will be the adjusted free cash flow productivity ratio which essentially shows how effectively PG is converting its adjusted net earnings to FCF.
Investors shouldn’t expect the moon here in Q1-25, as Q4 already saw an inordinately high figure of 148% in Q4 which certainly won’t be easy to replicate again. Besides, after coming in at 105% for the whole year, the expected adjusted FCF productivity for FY25 is likely to be around the 90% mark.
What Does The Medium-term Outlook and Forward Valuations Look Like?
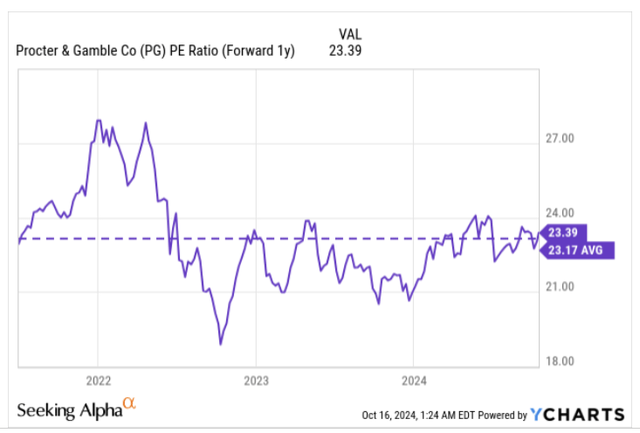
PG’s forward valuations don’t look overly prohibitive; based on the June 2026 EPS of 7.42, the stock is currently priced at P/E of 23.4x which is roughly in line with the stock’s long-term rolling average of around 23x.
If you want to juxtapose the quantum of medium-term earnings growth (single-digit earnings growth) with the double-digit P/E multiple of PG, we acknowledge, the stock may not come across as a beacon of value, but we’d ask investors to view things through a different lens.
Seeking Alpha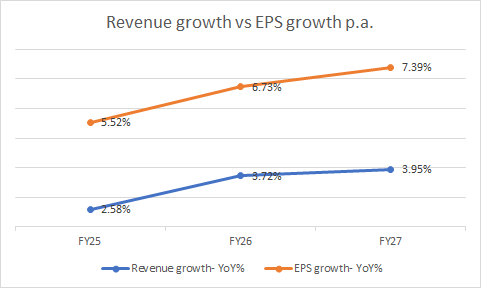
Between FY24 and FY27, PG’s topline growth p.a. is expected to improve for three straight years, but the pace of growth on the bottom line too will lead the topline growth by a much superior margin in each of those years. To facilitate this degree of operating leverage in 1 year is hard enough, but to likely do it 3 years running is a feat not too many staple companies can boast off.
Closing Thoughts- What Do The Charts Suggest?
Based on what the charts are suggesting, we don’t believe it makes a great deal of sense to load up on PG now.
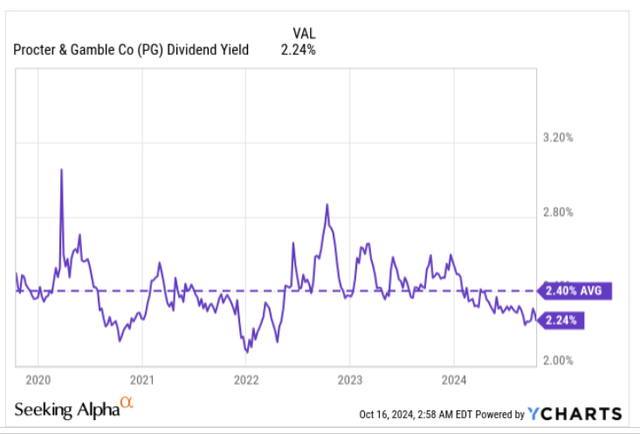
The dividend is an important component of PG’s story, as it has been doing it out for 134 years, and growing it for 68 years. The most recent hike in dividends was also quite compelling at 7% (the previous hike was only 3%), but despite the hefty hike, note that such has been the appreciation in the share price, that the yield at current levels is quite sub-par at only 2.24%, which is 16bps lower than its long-term average.
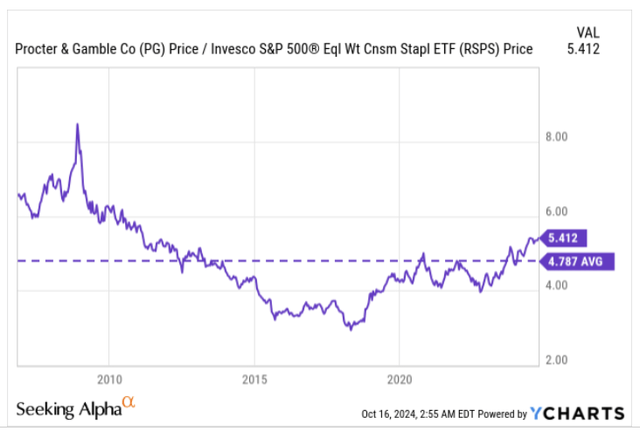
Meanwhile, investors looking out for suitable mean-reversion opportunities within the large-cap consumer staple universe are unlikely to gravitate to the Procter & Gamble stock now. The prospect looks unlikely as PG’s relative strength (RS) ratio vs an equally weighted basket of staple stocks has more than mean-reverted and is now trading 13% more than its long-term average.
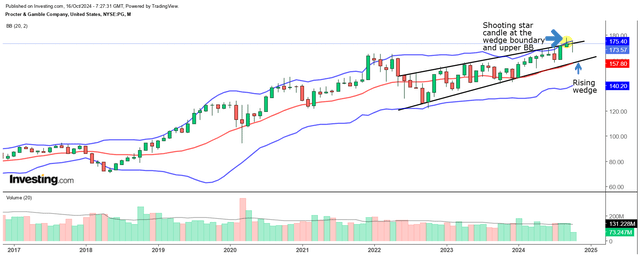
Finally, also take a look at PG’s long-term monthly chart where the price action is showing signs of fatigue. Since the stock bottomed out in Oct 2022, the price has trended up in the shape of a rising wedge pattern (marked by the two converging black lines). The rising wedge pattern is perceived to be a reversal pattern, and even if we don’t necessarily see a monumental shift in sentiment, do consider that the price looks quite stretched as it is hugging the upper boundary of the wedge. Last month’s close was also concerning as it represented a shooting star candle (highlighted in yellow) at the upper Bollinger band boundary, which already represents a degree of overextension as it is 2 standard deviations away from the 20-period moving average.
To close, we feel a hold rating on PG feels fitting now.
Analyst’s Disclosure: I/we have no stock, option or similar derivative position in any of the companies mentioned, and no plans to initiate any such positions within the next 72 hours. I wrote this article myself, and it expresses my own opinions. I am not receiving compensation for it (other than from Seeking Alpha). I have no business relationship with any company whose stock is mentioned in this article.
Seeking Alpha’s Disclosure: Past performance is no guarantee of future results. No recommendation or advice is being given as to whether any investment is suitable for a particular investor. Any views or opinions expressed above may not reflect those of Seeking Alpha as a whole. Seeking Alpha is not a licensed securities dealer, broker or US investment adviser or investment bank. Our analysts are third party authors that include both professional investors and individual investors who may not be licensed or certified by any institute or regulatory body.

