Summary:
- Johnson & Johnson offers investors an effective combination of dividend income and dividend growth, evidenced by its Dividend Yield [TTM] of 3.13% and 5-Year Dividend Growth Rate [CAGR] of 5.61%.
- The company from the Pharmaceuticals Industry, which has an Aaa credit rating from Moody’s, can serve as a strategically important core-position within your dividend portfolio.
- Allocating the largest proportion of your dividend portfolio to Johnson & Johnson can position your portfolio for reduced volatility and help to decrease its overall risk level.
- I have selected two ETFs and 10 dividend paying companies for this dividend portfolio, which blends dividend income and dividend growth while offering investors a lowered level of risk.
William_Potter
Investment Thesis
Allocating the largest proportion of your dividend portfolio to Johnson & Johnson (NYSE:JNJ) (NEOE:JNJ:CA) can help you to effectively reduce the volatility of your investment portfolio, serving as a strategic defensive move to better position it for a recession or stock market decline.
In this article, I will show you how to build a defensive $25,000 dividend portfolio that holds Johnson & Johnson as a core holding, offering you a reduced volatility and lowered risk level while combining dividend income and dividend growth.
I have selected the Schwab U.S. Dividend Equity ETF (SCHD) and the Vanguard S&P 500 ETF (VOO) in addition to 10 dividend paying companies that blend dividend income and dividend growth while allocating the largest proportion to Johnson & Johnson.
The reduced risk level of this dividend portfolio, and its elevated chances for reaching successful investment outcomes, is reflected through a variety of characteristics:
One of these characteristics is the portfolio’s equal sector distribution: due to the careful selection process, no sector represents more than 16% of the overall portfolio.
Additionally, it can be highlighted that nine of the ten individually selected companies exhibit EBIT Margins [TTM] above 15%, reflecting their strong financial health and the excellent competitive position they hold within their respective industry.
Additionally, it can be noted that the four largest individual positions of this dividend portfolio, which are Johnson & Johnson (with a 60M Beta Factor of 0.52), Realty Income (60M Beta Factor of 0.99), Unilever (0.23), and BHP Group (0.86) exhibit 60M Beta Factors below 1, indicating that they are able to contribute to a reduced volatility and lower risk level.
In addition to the above, it is worth highlighting that the Weighted Average Dividend Yield [TTM] of this dividend portfolio stands at 3.15%, while its 5-Year Weighted Average Dividend Growth Rate [CAGR] is at 7.39%, ensuring both the generation of dividend income for today, and the potential for dividend growth for tomorrow.
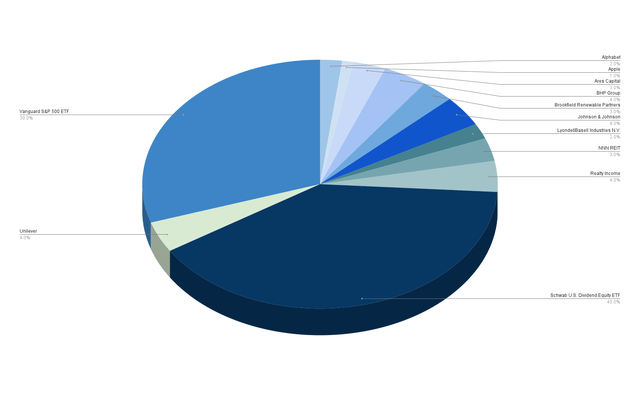
The Schwab U.S. Dividend Equity ETF accounts for 40% of this dividend portfolio, contributing to it blending dividend income with dividend growth.
Since I have provided the Vanguard S&P 500 ETF with a 30% allocation when compared to the overall portfolio, the portfolio has a slightly lower capacity for the generation of dividend income when compared to solely investing in the Schwab U.S. Dividend Equity ETF.
If you would like to prioritize the generation of dividend income with this portfolio, you could substitute the Vanguard S&P 500 ETF with a high yield dividend ETF that complements SCHD.
In such a case, the iShares Select Dividend ETF (DVY) could be an attractive alternative, given its ability to combine dividend income and dividend growth (Dividend Yield [TTM] of 3.28% and 5-Year Dividend Growth Rate [CAGR] of 6.14%) while maintaining relatively low overlap with SCHD in terms of their largest holdings.
Johnson & Johnson is the largest individual position of this dividend portfolio (when allocating the Schwab U.S. Dividend Equity ETF and the Vanguard S&P 500 ETF across their respective companies), representing 4.17%.
Johnson & Johnson
Why Johnson & Johnson could be a Strategically Important Core-Position of your Dividend Portfolio
By providing the largest proportion to Johnson & Johnson, you can make a strategic move to better position your portfolio for reduced volatility, thereby ensuring a reduced risk level. This is because of Johnson & Johnson’s strong financial health, low Beta Factor, its combination of dividend income and dividend growth, the sustainability of its dividend and strong competitive position within the Pharmaceuticals Industry.
Johnson & Johnson’s Financial Health
Among other factors, Johnson & Johnson’s strong financial health is reflected in its EBIT Margin [TTM] of 26.40%, its Return on Equity [TTM] of 20.89%, and an Aaa credit rating from Moody’s.
Johnson & Johnson’s high EBIT Margin [TTM] of 26.40% is not only an indicator of the company’s financial health, but also demonstrates its positioning within the Pharmaceuticals Industry.
Johnson & Johnson’s Low Beta Factors
Johnson & Johnson’s 24M Beta Factor of 0.25 and 60M Beta Factor of 0.52 indicate that you can effectively reduce the volatility of your portfolio by allocating a higher proportion to the company.
Johnson & Johnson’s Combination of Dividend Income and Dividend Growth and its Sustainable Dividend
With a Dividend Yield [TTM] of 3.13% and a 5-Year Dividend Growth Rate [CAGR] of 5.61%, Johnson & Johnson effectively integrates dividend income and dividend growth. It is further worth highlighting the company’s relatively low Payout Ratio of 47.46% and its 61 Consecutive Years of Dividend Growth, which underline the sustainability of its dividend.
The Advantages of Allocating the Largest Proportion of your Dividend Portfolio to Johnson & Johnson
A company that is financially healthy, has an excellent competitive position within its industry, combines dividend income and dividend growth, and pays a sustainable dividend in addition to having a low Beta Factor, can significantly reinforce the stability of your investment portfolio, thereby significantly lowering its risk level.
All of these characteristics make Johnson & Johnson an attractive defense play within your portfolio, like the star defender of your favorite sports team.
Just as a strong defense is crucial to a sports team’s success, including solid defensive positions is important to help you reach attractive investment outcomes over the long term.
However, to reduce the company-specific concentration risk of your dividend portfolio, I suggest setting an allocation limit of 5% when investing in Johnson & Johnson.
With a proportion of 4.17%, this dividend portfolio follows the same allocation limit. The Dividend Income Accelerator Portfolio, which I am documenting here on Seeking Alpha, follows the same allocation limit. Johnson & Johnson presently holds a proportion of 3.10% compared to the overall portfolio. This makes the company the fourth-largest portfolio position, at this moment in time.
The Individual Positions of This Dividend Portfolio
I have selected the following two ETFs for this dividend portfolio:
- Schwab U.S. Dividend Equity ETF
- Vanguard S&P 500 ETF
Additionally, I have selected the following ten dividend paying companies, integrating dividend income with dividend growth:
- BHP Group (BHP)
- Johnson & Johnson
- Apple (AAPL)
- LyondellBasell Industries N.V. (LYB)
- Alphabet (GOOG) (GOOGL)
- NNN REIT (NNN)
- Realty Income (O)
- Brookfield Renewable Partners (BEP) (BEPC)
- Ares Capital (ARCC)
- Unilever (UL)
I have selected the Schwab U.S. Dividend Equity ETF for this dividend portfolio due to the ETF’s low Expense Ratio of 0.06%, in addition to its mix of dividend income and dividend growth (Dividend Yield [TTM] of 3.38% and 3-Year Dividend Growth Rate [CAGR] of 11.13%). Moreover, it is worth mentioning the safety of the dividend from the companies that are part of this ETF. This is thanks to its focus on companies that pay sustainable dividends.
I have selected the Vanguard S&P 500 ETF due to its stronger focus on the Information Technology Sector, which makes it an attractive complementation to the Schwab U.S. Dividend Equity ETF. Additionally, the Vanguard S&P 500 ETF has a stronger focus on the Communication Services Sector (9.11% compared to the 6.60% of the Schwab U.S. Dividend Equity ETF), which helps us to further increase the level of diversification of this dividend portfolio.
Johnson & Johnson has been selected as the largest position. The company represents 4.17% of the overall portfolio (which will be demonstrated in a later section when allocating the Schwab U.S. Dividend Equity ETF and the Vanguard S&P 500 ETF across the companies they are invested in).
Johnson & Johnson’s financial health (Aaa credit rating from Moody’s and EBIT Margin [TTM] of 26.40%), its low 24M Beta Factor of 0.25, and the sustainability of its dividend (underscored by a Payout Ratio of 47.46% and 61 Consecutive Years of Dividend Growth) make it an ideal defense play for an investment portfolio that aims to reach a reduced volatility.
Unilever (60M Beta Factor of 0.23), BHP Group (0.86) and Realty Income (0.99) have not only been selected for this portfolio due to their ability to reduce volatility, but also for their capacity to combine dividend income and dividend growth. This makes them important strategic elements for the stability of this portfolio (in addition to Johnson & Johnson).
Ares Capital has been included due to the company’s strong ability to produce dividend income, reflected in the company’s Dividend Yield [TTM] of 8.92% in addition to its positive growth perspective (underscored by an EPS Diluted Growth Rate [FWD] of 22.68%).
In addition to Realty Income, NNN REIT helps us to further raise the proportion of the Real Estate Sector on the overall portfolio. This is the case as the Schwab U.S. Dividend Equity ETF is not invested in the Real Estate Sector at all, and the Vanguard S&P 500 ETF only holds a small proportion.
Brookfield Renewable Partners and LyondellBasell Industries N.V. help us to increase the proportion of the Utilities and Materials Sectors of this portfolio, in addition to their ability to integrate dividend income and dividend growth.
Both Alphabet and Apple are attractive additions due to their ability to produce dividend growth and their appealing risk-reward profile. Since the Vanguard S&P 500 ETF already holds significant proportions of both Alphabet and Apple, I have allocated a small proportion to Apple (allocating a proportion of 1%) and Alphabet (allocating a proportion of 2%).
This ensures a reduced company-specific concentration risk for the portfolio, even when distributing the Schwab U.S. Dividend Equity ETF and the Vanguard S&P 500 ETF across the companies they are invested in, which gives us an exact idea of the company-allocations.
It is worth highlighting that the Weighted Average Dividend Yield [TTM] of this dividend portfolio stands at 3.15% and its 5-Year Weighted Average Dividend Growth Rate [CAGR] is 7.39%, reflecting an integration of dividend income and dividend growth.
Overview of the Composition of This Dividend Portfolio
|
Symbol |
Name |
Sector |
Industry |
Country |
Dividend Yield [TTM] |
Dividend Growth 5 Yr [CAGR] |
P/E [TTM] |
60M Beta |
Allocation |
Amount in $ |
|
SCHD |
Schwab U.S. Dividend Equity ETF |
ETF |
ETF |
United States |
3.38% |
12.00% |
40.00% |
10000 |
||
|
VOO |
Vanguard S&P 500 ETF |
ETF |
ETF |
United States |
1.24% |
4.49% |
30.00% |
7500 |
||
|
BHP |
BHP Group |
Materials |
Diversified Metals and Mining |
Australia |
5.61% |
4.24% |
16.68 |
0.86 |
4.00% |
1000 |
|
JNJ |
Johnson & Johnson |
Health Care |
Pharmaceuticals |
United States |
3.13% |
5.61% |
25.59 |
0.52 |
4.00% |
1000 |
|
AAPL |
Apple |
Information Technology |
Technology Hardware, Storage and Peripherals |
United States |
0.44% |
5.43% |
33.85 |
1.24 |
1.00% |
250 |
|
LYB |
LyondellBasell Industries N.V. |
Materials |
Commodity Chemicals |
United States |
6.20% |
4.79% |
12.77 |
1.05 |
2.00% |
500 |
|
GOOG |
Alphabet |
Communication Services |
Interactive Media and Services |
United States |
0.22% |
22.1 |
1.04 |
2.00% |
500 |
|
|
NNN |
NNN REIT |
Real Estate |
Retail REITs |
United States |
5.38% |
2.44% |
12.71 |
1.11 |
3.00% |
750 |
|
O |
Realty Income |
Real Estate |
Retail REITs |
United States |
5.47% |
3.55% |
14.33 |
0.99 |
4.00% |
1000 |
|
BEP |
Brookfield Renewable Partners |
Utilities |
Renewable Electricity |
United States |
5.55% |
11.60% |
26.06 |
1.02 |
3.00% |
750 |
|
ARCC |
Ares Capital |
Financials |
Asset Management and Custody Banks |
United States |
8.92% |
3.84% |
8.46 |
0.93 |
3.00% |
750 |
|
UL |
Unilever |
Consumer Staples |
Personal Care Products |
United Kingdom |
3.24% |
0.55% |
20.32 |
0.23 |
4.00% |
1000 |
|
3.15% |
7.39% |
100.00% |
25,000 |
Source: The Author, data from Seeking Alpha
I have considered the following factors when determining the allocation for each company:
- The risk-reward profile of the company
- The company’s current Valuation
- The sustainability of the company’s dividend
- The company’s ability to blend dividend income with dividend growth
- The financial health of the company
- The company’s competitive advantages
- The company’s growth outlook
- The company’s competitive position within its industry
Risk Analysis of This Dividend Portfolio
Risk Analysis of the Portfolio Allocation per Company/ETF
With a proportion of 40% and 30%, SCHD and VOO represent the largest holdings of this dividend portfolio.
The largest individual positions are Johnson & Johnson, BHP Group, Realty Income and Unilever, each accounting for 4%.
NNN REIT, Brookfield Renewable Partners and Ares Capital represent 3% each.
LyondellBasell Industries N.V. and Alphabet account for 2% of the overall portfolio each, while Apple makes up just 1% (the Vanguard S&P 500 ETF already holds significant stakes in both Alphabet and Apple and by allocating small proportions we are aiming to avoid them accounting for a disproportionally high percentage of the overall portfolio).
Risk Analysis of the Portfolio’s Company-Specific Concentration Risk When Distributing SCHD and VOO Across their Companies
With a proportion of 4.17%, Johnson & Johnson is the largest individual holding of this dividend portfolio. This is because Johnson & Johnson has been selected as an individual position as well indirectly via VOO’s stake in the company.
I have ensured that Johnson & Johnson’s proportion compared to the overall portfolio does not exceed the allocation limit that I set for the company (which is at 5%). This is also the case when allocating SCHD and VOO across the companies they are invested in, thus ensuring a reduced company-specific concentration risk for this dividend portfolio.
With a proportion of 4.03%, Realty Income is the second-largest individual position. The company has been individually selected, while VOO also has a stake in it.
Unilever and BHP Group each account for 4% of the overall portfolio, contributing to reducing the portfolio’s volatility (neither SCHD nor VOO hold positions in Unilever or BHP Group).
Apple is the fifth-largest proportion, accounting for 3.17%. Since VOO already holds a significant stake in Apple, I have only allocated 1% to the company, ensuring a proportion that does not exceed 4% even when distributing SCHD and VOO across their respective companies. This allocation approach is important for reaching one of the main objectives of this dividend portfolio, which is to reach a reduced volatility (Apple has a 60M Beta Factor of 1.24 and therefore increases the portfolio’s volatility).
NNN REIT, Brookfield Renewable Partners and Ares Capital account for 3% of the overall portfolio. All other companies represent less than 3%.
The chart below illustrates the companies that represent at least 1.50% of the overall portfolio. It demonstrates the company allocation when distributing SCHD and VOO across their respective companies.
Source: The Author, data from Seeking Alpha and Morningstar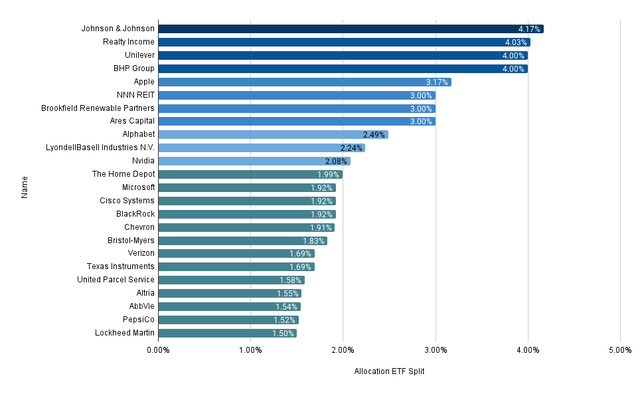
Risk Analysis of the Portfolio’s Sector-Specific Concentration Risk When Distributing SCHD and VOO Across their Sectors
This dividend portfolio reaches an extensive diversification across sectors. This is demonstrated in the chart below, which indicates a relatively equal sector distribution. It can be highlighted that no individual sector represents more than 16% of the overall portfolio.
The Information Technology Sector is the largest sector of this dividend portfolio, representing 15.34%.
With a proportion of 14.95% of the overall portfolio, the Financials Sector makes up the second-largest sector, followed by the Health Care Sector (13.21%) and the Consumer Staples Sector (11.03%).
With a proportion of 7.58%, the Real Estate Sector represents the fifth-largest sector, followed by the Consumer Discretionary Sector with 7.48%, the Industrials Sector (6.96%), the Materials Sector (6.78%), the Communication Services Sector (6.60%), the Energy Sector (6.28%), and the Utilities Sector (3.79%).
Source: The Author, data from Seeking Alpha and Morningstar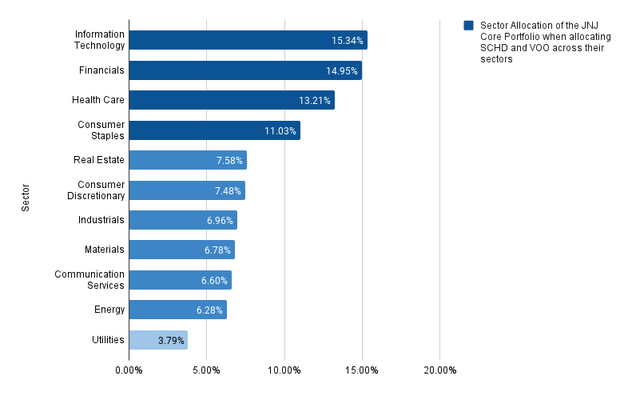
The chart below highlights the portfolio’s broader and more equal sector distribution when compared to only investing in SCHD or VOO.
While the Information Technology Sector is heavily overweighted in VOO (representing 33.02%), its proportion compared to the overall portfolio is only 15.34%, indicating a significantly higher level of sector diversification compared to investing in VOO alone.
While the Financials Sector is overweighted in SCHD, representing 20.03%, it only makes up 15.34% of the portfolio. This indicates an elevated sector diversification when compared to investing in SCHD alone.
Additionally, it can be highlighted that this portfolio has a higher allocation to the Real Estate Sector (7.58%). This Sector is not represented at all within SCHD and is underrepresented within VOO (accounting for only 2.28%).
Source: The Author, data from Seeking Alpha and Morningstar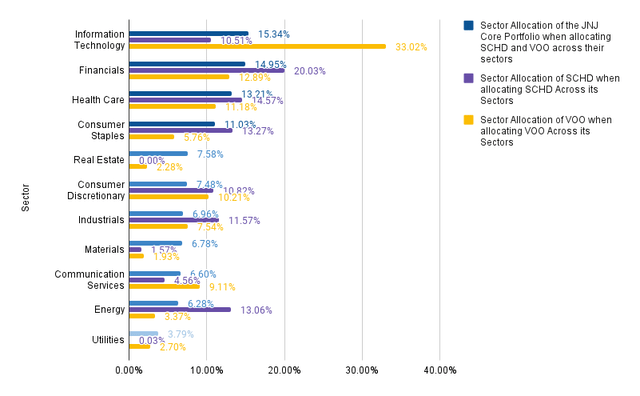
Risk Analysis of the 10 Individual Positions of This Dividend Portfolio
Analysis of the Companies’ Financial Health
The EBIT Margin [TTM]
The financial health of the companies that are part of this dividend portfolio, which holds Johnson & Johnson as a core position, is underlined by their elevated EBIT Margins [TTM].
It can be highlighted that all of the ten individually selected companies have EBIT Margins [TTM] above 7%. Additionally, it is worth noting that nine of the ten exhibit double-digit EBIT Margins [TTM].
The companies with the highest EBIT Margins, which are part of this dividend portfolio, are Ares Capital (EBIT Margin [TTM] of 72.94%), NNN REIT (62.83%), Realty Income (44.29%), BHP Group (40.64%) Alphabet (32.09%), Apple (31.51%) and Johnson & Johnson.
Source: The Author, data from Seeking Alpha![EBIT Margins [TTM]](https://static.seekingalpha.com/uploads/2024/11/27/55029283-17327407098510754.png)
These strong financial metrics underline the portfolio’s reduced risk level, implying an elevated likelihood of achieving positive investment outcomes for investors.
The Return on Total Capital [TTM]
The financial health of the companies included in this portfolio is further underlined by their attractive Return on Total Capital.
Five of the ten companies have shown a double-digit Return on Total Capital [TTM]. The companies with the highest Return on Total Capital [TTM] are Apple (42.54%), Alphabet (21.07%), BHP Group (19.77%), Johnson & Johnson (13.97%), and Unilever (12.72%). This indicates that they use their total capital efficiently to generate profits, further underlining the portfolio’s reduced risk level.
Source: The Author, data from Seeking Alpha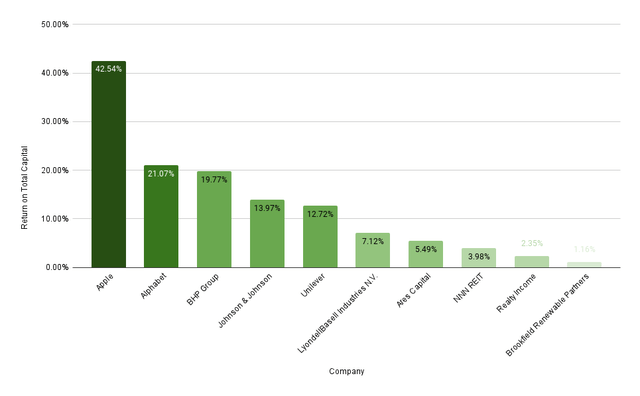
Analysis of the Portfolio’s Volatility
The Companies’ 60M Beta Factors
It is worth highlighting that companies with particularly low 60M Beta Factors represent relatively large proportions compared to the overall portfolio. The four largest positions of this dividend portfolio have 60M Beta Factors below 1, underlining its reduced volatility.
Unilever, which is the third-largest position, has a 60M Beta Factor of 0.23 and will strongly contribute to the portfolio’s reduced volatility.
Johnson & Johnson, which is the largest position, has a 60M Beta Factor of 0.52. This makes the company an important strategic core-element.
BHP Group is the fourth-largest portfolio position and exhibits a 60M Beta Factor of 0.93.
Realty Income, as the second-largest portfolio position, has a 60M Beta Factor of 0.99, and contributes to the reduction of the portfolio’s volatility and risk level.
Source: The Author, data from Seeking Alpha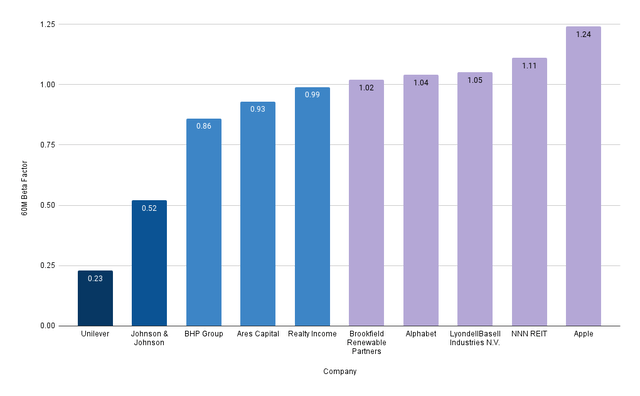
Conclusion
By allocating the largest amount of your dividend portfolio to Johnson & Johnson, you can effectively reduce the volatility and overall risk level of your dividend portfolio.
This is due to Johnson & Johnson’s financial health (reflected in the company’s EBIT Margin [TTM] of 26.40% and its Return on Equity [TTM] of 20.89%), its attractive risk-reward profile, and its combination of dividend income and dividend growth (Johnson & Johnson exhibits a Dividend Yield [TTM] of 3.13% and a 5-Year Dividend Growth Rate [CAGR] of 5.61%).
In addition, there is the sustainability of Johnson & Johnson’s dividend (which is evidenced by the company’s Payout Ratio of 47.46% and 61 Consecutive Years of Dividend Growth), as well as a 24M Beta Factor of 0.25.
Through a careful selection process of two ETFs and 10 dividend paying companies, this dividend portfolio offers an extensive diversification, which is reflected in its equal sector distribution: no sector represents more than 16% of the overall portfolio.
The portfolio’s reduced volatility and low overall risk level is further reflected in the fact that the four largest positions (Johnson & Johnson, Realty Income, Unilever, and BHP Group) have a 60M Beta Factor below 1.
This means that the four largest positions significantly contribute to the portfolio’s reduced volatility and lowered overall risk level.
The portfolio not only provides investors with a reduced volatility and low overall risk level, but it also combines dividend income and dividend growth, evidenced by its Weighted Average Dividend Yield [TTM] of 3.15% and 5-Year Weighted Average Dividend Growth Rate [CAGR] of 7.39%.
This means that investors not only generate a significant amount of dividend income when following such an investment approach, they can also invest with a reduced overall risk level, which enhances the chances of reaching positive investment outcomes.
Author’s Note: Which proportion does Johnson & Johnson hold compared to your overall portfolio? Which companies are presently the core-holdings of your dividend portfolio?
Analyst’s Disclosure: I/we have a beneficial long position in the shares of SCHD, BHP, JNJ, AAPL, GOOG, O, BEP, ARCC, UL either through stock ownership, options, or other derivatives. I wrote this article myself, and it expresses my own opinions. I am not receiving compensation for it (other than from Seeking Alpha). I have no business relationship with any company whose stock is mentioned in this article.
Seeking Alpha’s Disclosure: Past performance is no guarantee of future results. No recommendation or advice is being given as to whether any investment is suitable for a particular investor. Any views or opinions expressed above may not reflect those of Seeking Alpha as a whole. Seeking Alpha is not a licensed securities dealer, broker or US investment adviser or investment bank. Our analysts are third party authors that include both professional investors and individual investors who may not be licensed or certified by any institute or regulatory body.

