Summary:
- Caterpillar designs, manufactures, and sells machinery globally, with a market cap near $200B and a historical annual return of nearly 15%.
- The Company is a Dividend Champion and Aristocrat, having increased its dividend for 31 years, with a recent 8.5% hike and a declining payout ratio.
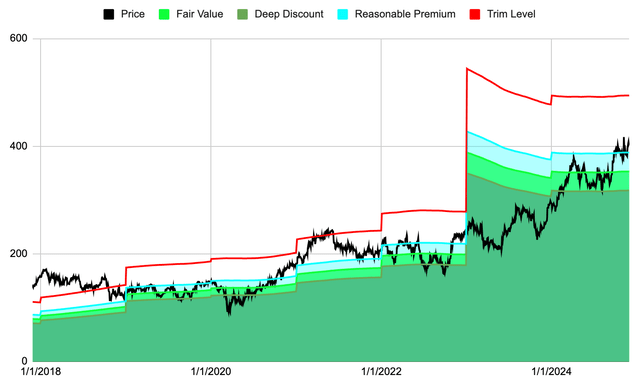
- Valuation suggests CAT is trading for an approximate 15% premium to fair value and will need to pull back some before I consider adding it to my portfolio.
Woodkern/iStock Editorial via Getty Images
Company Description
Caterpillar Inc. (NYSE:CAT) designs, manufactures and sells machinery and industrial equipment through a global network. The company known for its yellow equipment operates through four segments, Construction Industries, Resource Industries, Energy & Transportation and Financial Products. The company has more than 100,000 employees and currently has a market cap of just under $200B. Since 1990 the stock has returned slightly less than 15% annually, with an overall return of more than 12,500%.
Quality Metrics
There are three quantitative characteristics that, I feel, are imperative for any high-quality business to possess. They are a rising revenue stream, a stable gross profit margin and a robust return on invested capital. Let’s examine these metrics for Caterpillar and see how they stack up.
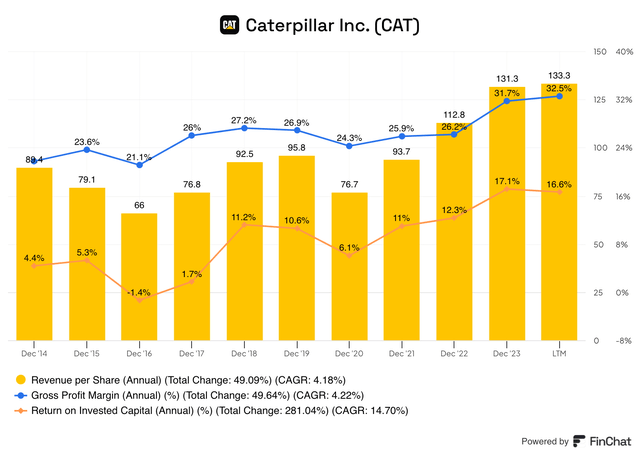
CAT’s revenue per share has been somewhat inconsistent, with some struggles in 2015 and 2016, dropping more than 10% in each fiscal year. During the following two years, the company rebounded nicely with gains of 16.5% and 20.5%, respectively. Obviously, during FY20 CAT struggled as did the majority of companies with a drastic 20% drop in this metric. Since the height of the pandemic this metric has surged with a 22% increase during FY21, a 20% rise in FY22 and lastly a 17% increase in the most recent fiscal year. Overall, their revenue per share has grown at about 4% per year, which is quite good for such a mature company.
The company’s GPM has been slowly increasing over the past decade. The GPM was a chart low of 21.1% in fiscal year 2016, but has basically been on the rise since. In fact, this metric topped 30% just last year, a display of the company’s continuous efforts to improve and be more lean.
Similar to the gross profit margin, the return on invested capital has been trending higher more recently. During 2018 and 2019 the ROIC was north of 10% for the first time on the chart below, but then dipped close to 6% in 2020. However, in each of the last three years the ROIC has been above of 10% including, more than 17% in FY 2023.
Clearly, these metrics are trending in the right direction, the pandemic caused some obvious blips, but the company has bounced back nicely and seems to be trending upward.
Dividend Data
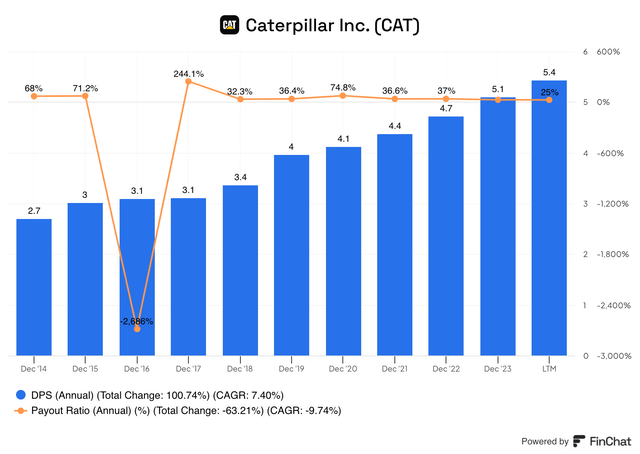
Caterpillar is a Dividend Champion as well as a Dividend Aristocrat having raised its dividend each of the past 31 years. Since 2014 the company has grown its dividend by 7.4% per year, and overall the payout amount has basically doubled. In June of this year, CAT announced a healthy 8.5% increase raising its dividend from $1.30 per quarter to $1.41, or $5.64 annually.
Since 2014 the payout ratio has been trending lower, with 2016 and 2017 as obvious outliers. Following those years, the payout ratio dipped below 40% for a two-year period before shooting up to nearly 75% in fiscal year 2020. From that point until now, the payout ratio has declined to 37% in FY2022 and 25.2% in FY2023. These recent declines in the payout ratio should give current and potential dividend investors confidence the company can increase their dividend for the foreseeable future.
Past Performance
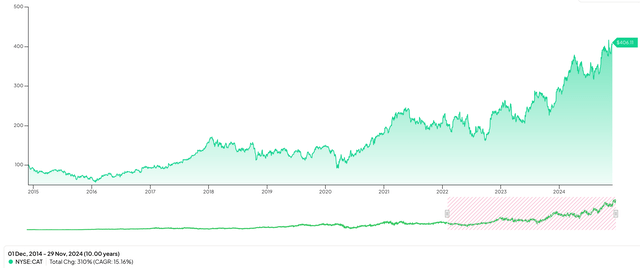
As mentioned earlier, Caterpillar has provided shareholders with market beating returns for quite a long time. The preceding decade shows much of the same for CAT, in fact, even slightly better than what the company has done over the long run. Over the past ten years the CAGR for CAT has been about 15%, and more than 300% overall, providing investors with consistent returns even during the height of the pandemic where it rose almost 27%.
Recent Earnings
About a month ago, Caterpillar announced Q3 2024 earnings with a double miss, adjusted earnings per share were $5.17 for the quarter which missed by $0.18, while revenue was $16.1B which missed analyst expectations by $140M.
Following up on the revenue, it was also down about 4% from the same period a year and was driven by lower sales volume. The GAAP EPS for the quarter was also down for the quarter by about 7% and the same goes for the Non-GAAP EPS, which dipped from $5.45 to $5.17. Restructuring costs were the main cause for the adjusted EPS numbers.
Looking at the revenue by segment, you can see two of the segments were up year-over-year, while two were down. The Construction portion saw sales decrease 9% YoY, while the Resource segment had a similar drop of 10%. Energy and Transportation was a light spot in the quarter for CAT as sales were up 5%. Finally, the Financial Products category rose 6% to just over $1B for the quarter.
Caterpillar Q3 Earnings Release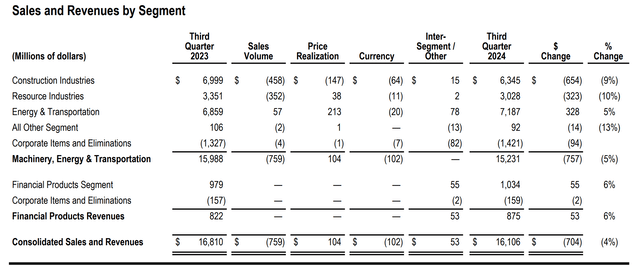
Overall, the market had a mildly negative response to the earnings report as the stock was down about 3% in midday trading. The entirety of the Q3 earnings release can be viewed/read here.
Valuation
The final piece of this puzzle is to determine if CAT is trading for an attractive price and to do so let’s look at it from a free cash flow perspective.
The custom valuation tool believes Caterpillar is trading for an approximate 15% premium to its fair value. The company has done an exceptional job of growing its free cash flow over time, but especially recently. Prior to 2023 their FCF/share never topped $9.81 and last year it basically doubled to $19.18. This caused the stock to trade at a significant discount for all of 2023. However, near the end of 2023 the stock began to rise, and so far, in 2024 the stock has continued to climb but the FCF has only increased minimally, thus creating the current overvaluation. Based on the chart above, the stock is rated a Hold.
Finally, Caterpillar has a current long-term expected rate of return of slightly more than 8%. The components of this estimate are a 1.39% dividend yield, a -2.83% return to fair value factor and an approximate 9.5% earnings growth rate. Typically, I look for companies with an expected RoR of more than 10% and currently CAT comes up short of this minimum. If the stock were to decline some and/or their EPS growth estimate were to get a boost, the stock would be more attractive, until then, I will wait on the sidelines for a potentially more attractive entry point.
Analyst’s Disclosure: I/we have no stock, option or similar derivative position in any of the companies mentioned, and no plans to initiate any such positions within the next 72 hours. I wrote this article myself, and it expresses my own opinions. I am not receiving compensation for it (other than from Seeking Alpha). I have no business relationship with any company whose stock is mentioned in this article.
Seeking Alpha’s Disclosure: Past performance is no guarantee of future results. No recommendation or advice is being given as to whether any investment is suitable for a particular investor. Any views or opinions expressed above may not reflect those of Seeking Alpha as a whole. Seeking Alpha is not a licensed securities dealer, broker or US investment adviser or investment bank. Our analysts are third party authors that include both professional investors and individual investors who may not be licensed or certified by any institute or regulatory body.
