Summary:
- Verizon’s technical analysis shows bullish momentum with strong support levels, upward channels, and positive moving averages, indicating near-term strength.
- Despite technical strength, fundamentals are weak with declining EPS, stagnant revenue growth, and an overvalued P/E ratio, suggesting long-term pressure.
- The stock’s valuation is concerning, with the P/E ratio near five-year highs and EPS growth significantly negative, indicating overvaluation.
- Given the conflicting technical and fundamental signals, I rate Verizon as a hold, suitable for traders but not value investors.
Thomas Barwick
Thesis
Verizon Communications Inc. (NYSE:VZ) is well known for its large dividend yield but today I’m taking a look at the stock’s technicals to evaluate its outlook. In the below technical analysis, I determine that the chart, moving averages, and indicators show that further strength in the stock is likely. However, that is at odds with the fundamentals, as I determine that the stock is overvalued with its P/E ratio unjustifiable due to significant contraction in its EPS. Therefore, I would conclude that the technicals may rule in the near term and the stock may continue to run but there are ominous clouds forming on the horizon in the form of overvaluation that could pressure the stock in the longer timeframe. Due to this assessment of the technicals and fundamentals, I initiate Verizon at a hold rating.
Technicals
Chart Analysis
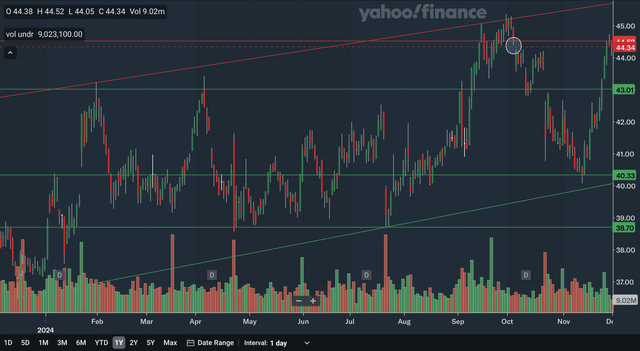
I would say that the overall daily chart is a positive one for Verizon as the stock is bound within an upward channel. The bottom channel line dates back to late 2023 while the upper channel line dates back to earlier this year. The stock also has more support levels below than resistance levels above. The nearest source of resistance would be at about 44.5 where I circled a downward gap that occurred back in early October. This level was also significant resistance only a few days ago. The other source of resistance would be the upper channel line that’s nearing 46 and sloping up. As you can see, the stock can experience healthy gains even if it remains below this line.
For support, the nearest level would be at 43. This price level was resistance in late February, early April, and in early September, showing that this is a highly important price area. Moving down, we also have support at around 40.3. This zone was important resistance very early in the year in January and was key support in November. Next, we have the lower channel line that just moved above the 40 level. As this line continues to slope upward, its relevance will only increase from here. Lastly, we have distant support at around 38.7. This level was resistance back at the end of 2023 and was support multiple times earlier this year.
Overall, I believe it is clear that the stock is in quite a good position technically. There is not much to complain about as the stock is in a gradual upward channel with lots of support underneath.
Moving Average Analysis
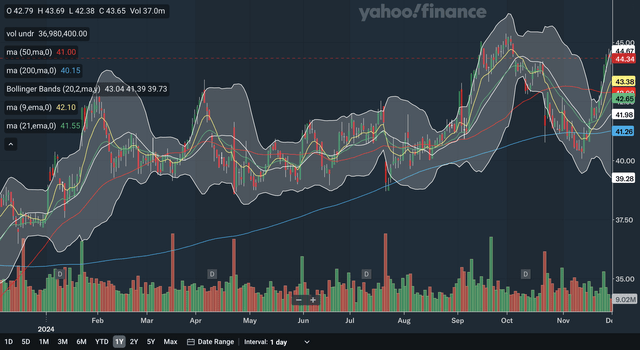
The 50 day SMA and the 200 day SMA has not had a crossover this year but there was a bullish crossover back at the end of 2023. The gap between the SMAs has decreased from its max level but remains quite large, showing that bullish momentum has been resilient. The stock also trades above both of these SMAs by quite a margin, another indication of recent strength. The 9 day EMA and 21 day EMA had a bullish crossover back in November, a strong signal of near term strength. The gap between the EMAs is still expanding at a strong rate, showing that near term bullish momentum is still accelerating. The stock also trades above both of the EMAs, again displaying strength.
For the Bollinger Bands, the stock is currently right at the upper band, making the case that it could be overbought. A near term healthy pullback could therefore occur without much cause for concern. The 20 day midline should act as support since the stock is in an uptrend. The bands are currently expanding due to increased volatility and may create more room for the stock to run in the near future. The nearest MA support for Verizon is the 9 day EMA in the mid 43s.
As a whole, in my view these MAs show a strong outlook for the stock as there are no signs of weakness here. The Bollinger Bands show that an overbought pullback could be imminent but the SMAs and EMAs both show strong bullishness in the stock’s technical picture.
Indicator Analysis
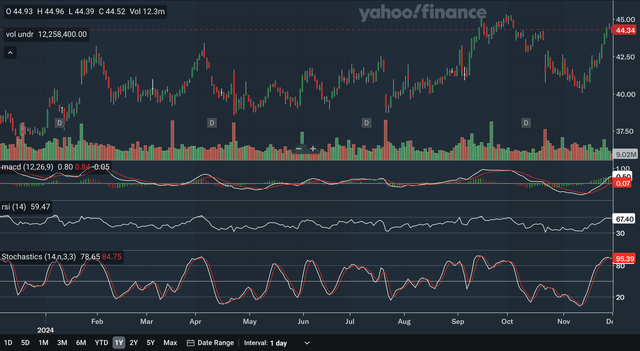
The MACD crossed above the signal line back in mid November, a bullish indication. The gap between the lines have also expanded in a strong manner as shown by the histogram, demonstrating strong bullish momentum in the stock. For the RSI, it is currently at 67.4 and it reclaimed the critical 50 level back in November as well. This shows that the bulls have taken control of the stock from the bears. The recent RSI run up to near one year highs also helps to confirm the validity of the stock’s recent surge to near its one year highs. The only negative signal here would be the stochastics. The %K line just broke below the %D line, a bearish indication. It is particularly bearish since the crossover occurred within the overbought 80 zone. Like in September, there has been cases where the %K was able to bounce back above the %D relatively quickly and so investors should monitor this indicator closely to see if it is a false signal. The gap between the lines has thus far stayed relatively small, creating hope that bullish momentum can be maintained.
From my analysis, although there are some mixed signals within these indicators, there were still more positives than negatives present here, making the outlook net positive in my view.
Fundamentals
Earnings
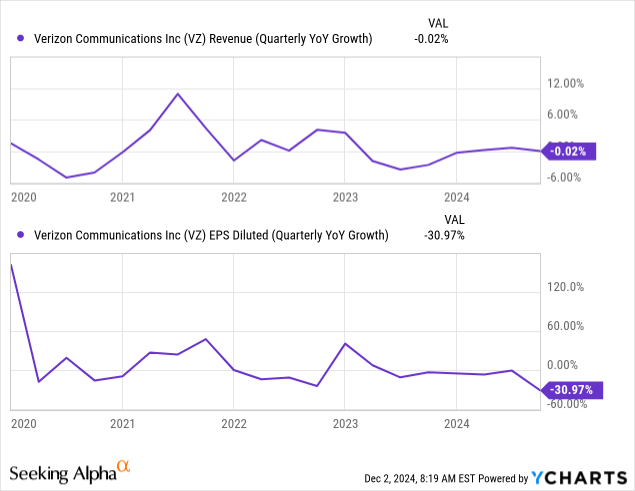
Verizon reported their 2024 Q3 earnings back in late October and in my view showed weak results overall. They reported total operating revenues of $33.33 billion, down very slightly from the prior year period’s $33.336 billion. For EPS, they reported a diluted GAAP figure of $0.78, a major decline from the prior year period’s $1.13. Both revenue and EPS missed expectations as revenue missed by $90.98 million and GAAP EPS missed by $0.38. As you can see in the charts above, revenue growth remains unspectacular as it is at best hovering near the 5 year average while EPS growth is concerning since this quarter’s YoY contraction is significantly worse than the five year average.
Other noteworthy items include their operating and EBITDA margins. For their consumer department, they reported an operating margin of 30.0%, virtually unchanged YoY, and an EBITDA margin of 43.4%, an increase over the prior year period’s 42.8%. For the business department, the operating margin increased 0.5% YoY to 7.7% while the EBITDA margin actually declined from 22.1% to 21.8%. The lack of consensus in the expansion of these margins shows that the efficiency of the business is not stably increasing. For dividends, their most recent payout was $0.68 at the beginning of November. The current stock price and dividend reflects a yield of 6.11%.
Valuation
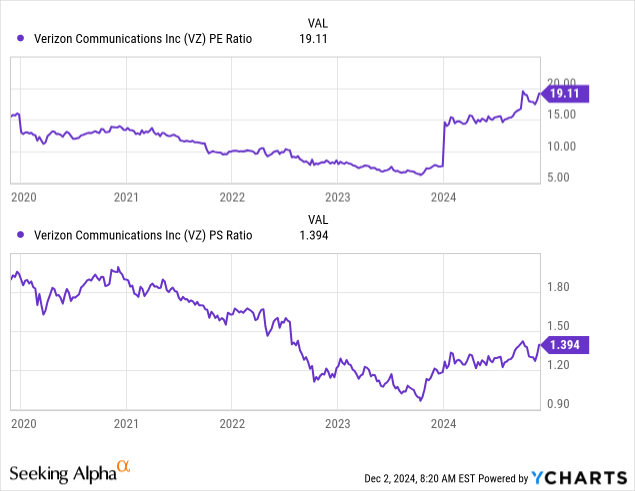
While both the P/E and P/S ratios have rebounded from their 2023 lows, the P/E is now very near 5 year highs while the P/S is still below the 5 year average. The P/E ratio is currently at 19.11 after being as low as under 7.5 in 2023 and is very near the 5 year high set earlier this year. For the P/S, it is currently at 1.39 after being below 1.0 in 2023 and being as high as near 2.0 back in 2020. If you compare the P/E chart to the EPS growth chart above, you can see that the stock is overvalued. While EPS growth has dropped into significantly negative territory, the P/E is at very high levels relative to its history. The worsening trajectory of EPS growth does not justify the current P/E in my view. As for the P/S, when you compare it with the revenue chart above, it shows that the stock is more fairly valued. A slightly below average revenue growth rate is met with a slightly below average P/S ratio, making the case that the stock is currently correctly valued. After considering both of these valuation multiples, I would conclude that the stock is moderately overvalued at current levels.
Conclusion
When you think of Verizon investors, you may imagine they are mainly value investors. However, from the analysis above, the stock may be a better buy for traders than value investors at the moment. The technicals are solidly bullish with the vast majority of indications showing strength in the stock. The fundamentals are concerning for the Verizon, however, as most recent earnings results are weak. Revenue growth remains near zero while EPS showed significant contraction YoY. While the EPS situation looks worrying, the P/E ratio is at five year highs leading me to believe that the stock is overvalued at current levels. With the technicals and fundamentals being at odds with each other, I conclude that the stock is hold at this juncture.
Analyst’s Disclosure: I/we have no stock, option or similar derivative position in any of the companies mentioned, and no plans to initiate any such positions within the next 72 hours. I wrote this article myself, and it expresses my own opinions. I am not receiving compensation for it (other than from Seeking Alpha). I have no business relationship with any company whose stock is mentioned in this article.
Seeking Alpha’s Disclosure: Past performance is no guarantee of future results. No recommendation or advice is being given as to whether any investment is suitable for a particular investor. Any views or opinions expressed above may not reflect those of Seeking Alpha as a whole. Seeking Alpha is not a licensed securities dealer, broker or US investment adviser or investment bank. Our analysts are third party authors that include both professional investors and individual investors who may not be licensed or certified by any institute or regulatory body.

