Summary:
- Advanced Micro Devices’ data center product adoption is driving strong growth and margin expansion. This is likely to continue with the acquisition of ZT Systems.
- Data on guidance surprises vs consensus and normalized EPS estimate revisions suggests that the stock’s growth prospects are fully priced in.
- Valuations are also near fair value levels, both relative to AMD’s historical valuation multiples band and its sectoral peers.
- Relative technicals too suggest a pause to the uptrend as the stock is starting to range at a key 12-monthly resistance vs the S&P 500.
- A look at the net working capital intensity reveals that the EBIT margin growth over the past year is purely optical as the operating cash flow margins have been stable.
Lumina Imaging/DigitalVision via Getty Images
Thesis
I have a neutral outlook on Advanced Micro Devices (NASDAQ:AMD):
- Data center products are driving strong growth and margins
- But the growth seems priced in
- Valuations are near fair value levels
- Relative technicals suggest a pause in the uptrend
- Rise in net working capital days is a key monitorable
Data center products are driving strong growth and margins
AMD’s TTM revenue growth is ticking up over the last 2-3 quarters. This is driven mostly by a growth acceleration in the Data Center segment, which makes up the majority (45.3%) of TTM revenues:
TTM Revenues Breakup (USD mn) (Company Filings, Author’s Analysis)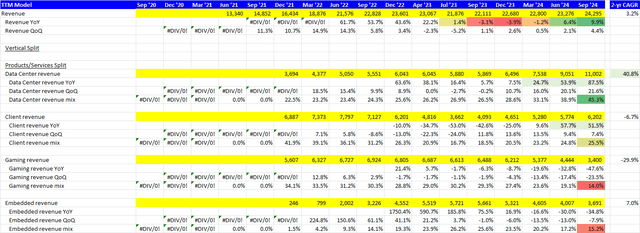
The key driver of this growth is a successful uptake of new products:
…strong ramp of AMD Instinct GPU shipments and growth in AMD EPYC CPU sales
– Q3 FY24 Investor Presentation
AMD is set to acquire ZT Systems; a company that manufactures compute and storage solutions for hyperscale data centers. I think this acquisition will help bolster AMD’s data center product suite to drive further adoption of its EPYC CPU and Instinct GPUs.
On the margins side too, the Data Center segment’s share of overall operating EBIT has nearly trebled from 22.4% to 66.5% over the past 12 months:
EBIT Margin Mix (Company Filings, Author’s Analysis)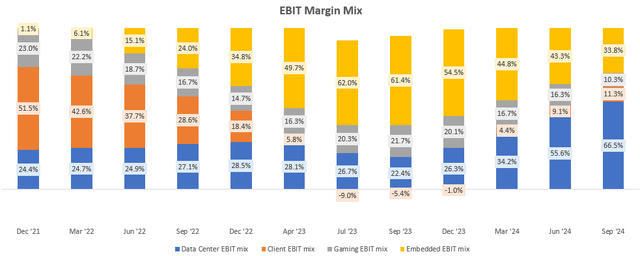
This has been driven both by the outsized segment growth and raw EBIT expansion from 17.8% to 27.2% also over the past 12 months:
TTM Segmental EBIT Margins (Company Filings, Author’s Analysis)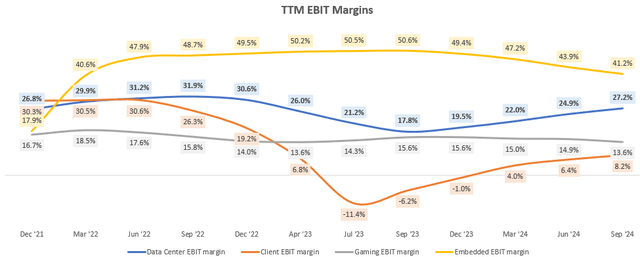
Hence, the growth and margin fundamentals appear to be very strong. Note, however, that there is a nuance here to the margin expansion story that I will discuss later in the net working capital section below.
The growth seems priced in
Although AMD is showing impressive growth momentum, I think investors ought to be cautious because much of this growth seems priced in as evidenced by revenue guidance numbers merely meeting consensus expectations for the most part over the past 3 quarters:
Revenue Guidance Surprise vs Consensus (Capital IQ, Author’s Analysis)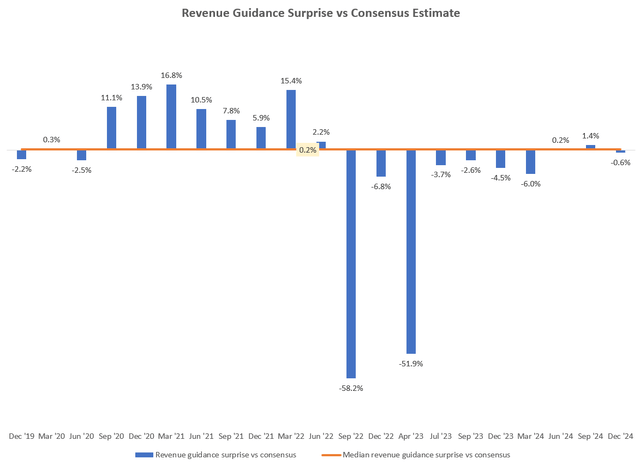
On the gross margins side, the guidance has been falling short of consensus expectations:
Gross Margin Guidance Surprise vs Consensus (Capital IQ, Author’s Analysis)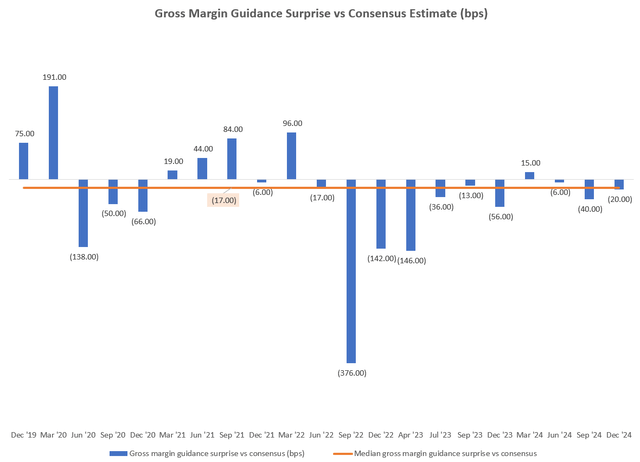
Furthermore, over the last month, Wall St analysts have on a net basis, revised their normalized EPS estimates downward for the next couple of quarters:
Normalized EPS Revisions (Capital IQ, Author’s Analysis)
I posit that all these signs indicate that AMD stock’s potential is fully priced in.
Valuations are near fair value levels
From a valuations perspective too, AMD is currently trading at a 1-yr fwd PE of 31.10x, which is quite close to the longer term median 1-yr fwd PE of 33.16x:
1-yr fwd PE and MCAP (USD mn) (Capital IQ, Author’s Analysis)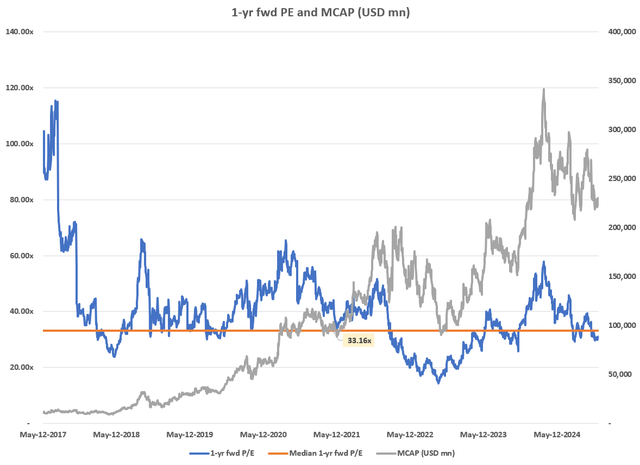
Relative to its semiconductor peers as well, AMD is trading right near the sectoral median 1-yr fwd PE of 31.4x:
1-yr fwd PE Comps (Capital IQ, Author’s Analysis)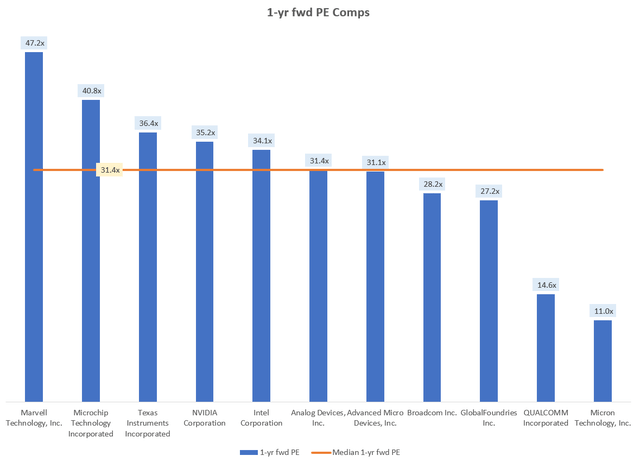
Hence, I conclude that AMD’s valuation is close to fair value levels currently.
Relative technicals suggest a pause in the uptrend
If this is your first time reading a Hunting Alpha article using Technical Analysis, you may want to read this post, which explains how and why I read the charts the way I do. All my charts reflect total shareholder return as they are adjusted for dividends/distributions.
Relative Read of AMD vs SPX 500
AMD vs SPX500 Technical Analysis (TradingView, Author’s Analysis)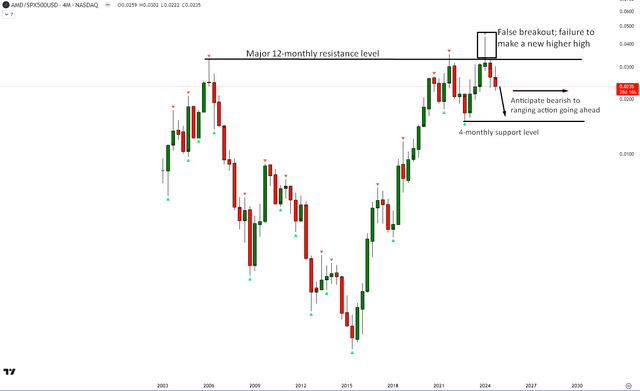
Relative to the S&P 500 (SPY) (SPX) (IVV) (VOO), AMD has reached a major 12-monthly resistance level and failed to make progress via the printing of new higher highs. I anticipate some bearish to ranging action over the next few quarters ahead, which would correspond to performance mostly in line with the broader market index.
Rise in net working capital days is a key monitorable
I think a lot of stock analysis focuses too much on revenue and margins, often ignoring net working capital and cash flow conversion trends. AMD is a great example that highlights the pitfalls of this oversight:
TTM net working capital days on revenue (Company Filings, Author’s Analysis)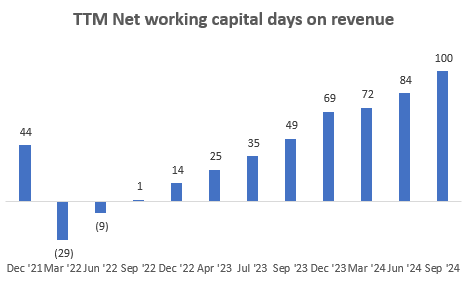
AMD’s TTM net working capital days on revenue have been steadily increasing from almost 0 days 2 years ago to 100 days as of Q3 FY24. The key driver of the recent jump from 84 days as of Q2 FY24 to 100 days seems to be a rise in TTM receivable days:
TTM receivable days on revenue (Company Filings, Author’s Analysis)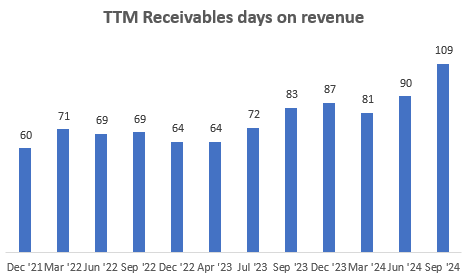
So it looks like AMD is giving its customers more lenient payment terms, potentially to drive market share gains.
TTM EBIT Margins (Company Filings, Author’s Analysis)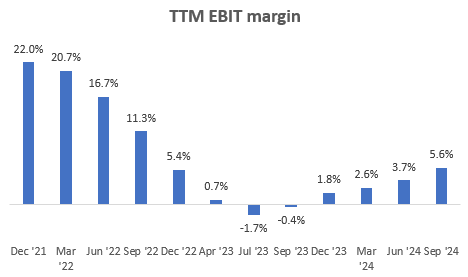
The impact of these trends is that the 600bps EBIT margin expansion over the last 12 months is rendered to be a purely optical benefit since the TTM operating cash flow (OCF) margins have been more or less steady over the last year:
TTM OCF Margin (Company Filings, Author’s Analysis)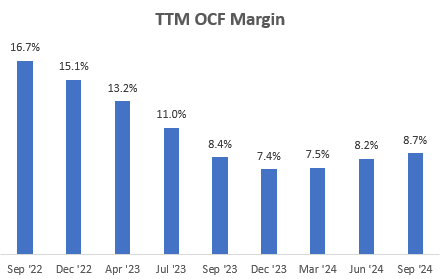
Going forward, I believe it is critical to assess whether true cash flow margin growth is occurring by monitoring both accounting EBIT margins and OCF margins.
Takeaway and positioning
I believe AMD’s fundamentals are healthy; there are strong growth drivers led by product adoption in the Data Center segment that is expected to continue with the acquisition of ZT Systems. However, data on the guidance surprises vs consensus and normalized EPS revisions suggests that the growth prospects are already fully priced into the stock. In addition, the company has had a strong expansion in EBIT margins however I believe much of this is a mere optical boost in fundamentals since from an operating cash flow perspective, the margins have been stable over the past year due to increasing receivables and overall net working capital intensity. Fair value valuations relative to the broader valuation multiples band and relative to sectoral comps, plus the chart technicals relative to the S&P 500 also don’t provide much of a compelling case for buys.
Rating: ‘Neutral/Hold’
How to interpret Hunting Alpha’s ratings:
Strong Buy: Expect the company to outperform the S&P 500 on a total shareholder return basis, with higher-than-usual confidence. I also have a net long position in the security in my personal portfolio.
Buy: Expect the company to outperform the S&P 500 on a total shareholder return basis
Neutral/hold: Expect the company to perform in-line with the S&P 500 on a total shareholder return basis
Sell: Expect the company to underperform the S&P 500 on a total shareholder return basis
Strong Sell: Expect the company to underperform the S&P 500 on a total shareholder return basis, with higher than usual confidence
The typical time horizon for my view is multiple quarters to more than a year. It is not set in stone. However, I will share updates on my changes in stance in a pinned comment to this article and may also publish a new article discussing the reasons for the change in view.
Analyst’s Disclosure: I/we have a beneficial long position in the shares of VOO either through stock ownership, options, or other derivatives. I wrote this article myself, and it expresses my own opinions. I am not receiving compensation for it (other than from Seeking Alpha). I have no business relationship with any company whose stock is mentioned in this article.
Seeking Alpha’s Disclosure: Past performance is no guarantee of future results. No recommendation or advice is being given as to whether any investment is suitable for a particular investor. Any views or opinions expressed above may not reflect those of Seeking Alpha as a whole. Seeking Alpha is not a licensed securities dealer, broker or US investment adviser or investment bank. Our analysts are third party authors that include both professional investors and individual investors who may not be licensed or certified by any institute or regulatory body.
