Summary:
- Prudential Financial has seen a 12% stock gain, outpacing the S&P 500, due to its improved capital position, fund flows, and higher interest rates.
- The company’s asset management arm, PGIM, showed growth in earnings and asset gathering, as well as solid operating leverage.
- Prudential’s capital return story remains intact, and I now expect earnings of $13.20-$13.40 this year for a forward 7.2% capital return yield.
JHVEPhoto
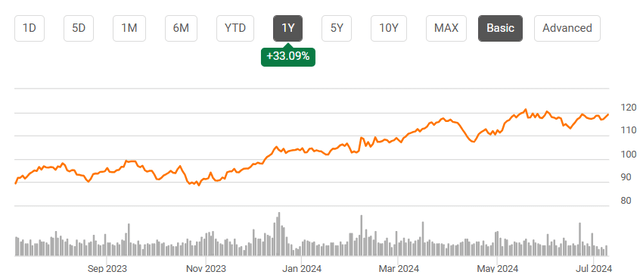
Prudential Financial (NYSE:PRU) has been a strong performer over the past year, rising by about a third and sitting near a 52-week high, as it has improved its capital position and higher rates have boosted profitability. I last covered PRU in March, rating shares a “hold.” With a 7% capital return yield, I felt its dividend was secure but that shares would struggle to get past $110. This proved overly cautious, as the stock’s 12% gain has modestly outpaced the S&P 500’s 9% rally. While I expect better results than before, this appears to be reflected in shares,
Prudential has been a beneficiary of higher interest rates, allowing it to gradually earn a wider investment spread on its insurance and annuity products. As such, in the company’s first quarter, it earned $3.12 in operating income, up from $2.70 a year ago. In the company’s first quarter, its fixed income portfolio had a 4.12% yield, up from 3.93% last year. Given most of its assets have a 5+ year duration, I expect to see gradual further increases in its investment yield, even as the Federal Reserve likely begins rate cuts later this year because it will be rolling over bonds bought before 2020, generally at lower prevailing rates.
Now, before turning to its insurance operations, I would highlight thar we are seeing significant improvement from its asset management arm, PGIM, which had been a source of caution for me. PGIM earnings rose to $169 million from $151 million last year. I would note that Q1 is a seasonally lower earning period due to incentive compensation payments. PGIM asset management revenue rose by 12%, as expenses rose by 10%, speaking to reasonable operating leverage, which we should see from an investment management firm, which should not need to increase headcount as quickly as asset growth.
Under the hood, I would note that PGIM asset management fees rose by 8% to $774 million, while performance fees jumped by 79% to $93 million. Performance fees can be very volatile, and so I focus more on asset management fees. I was encouraged to see 8% growth, given AUM rose by 6%. Given fee pressure across the industry, fees have tended to grow more slowly than AUM, so this was a very welcome reversal.
I was also impressed by PGIM’s rebounding asset gathering. The firm’s investment performance has been solid but not quite as strong lately–66% of funds are beating benchmarks over the past 3-years, which is below the 92% 10-year performance. This, combined with a shift toward passive products, has weighed on net flows. This sharply reversed, as you can see below, thanks to a new large fixed income mandate. Overall, about 40% of AUM sits in fixed income, 22% in real estate, and 21% in equities, with the remainder spread across alternative strategies.
Prudential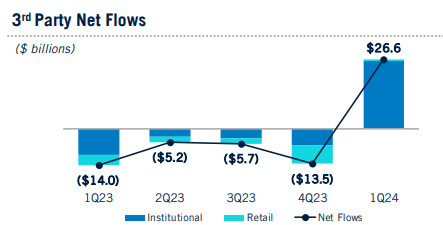
Now, I do not expect an inflow of this magnitude to be a new run-rate, though it should support incremental revenue growth in Q2. However, my concerns about ongoing outflows may have been too cautious. Given broader pressures, I am hesitant to assume strong ongoing inflows, but even stability would be positive, especially with markets reaching new highs, which should support further revenue gains in Q2 and Q3.
With this downside risk appearing less significant than a few months ago, it is important to ensure the insurance business is still seeing the tailwinds I expected. Fortunately, it is. Its US business grew profits about 10.5% to $839 million. Institutional profits rose by 11% to $441 million thanks to wider investment spread. The quarter was highlighted by $11 billion of institutional flows due to two large pension risk transfer (PRT) deals. I view PRT deals favorably. A life insurer benefits when policyholders die later than assumed, whereas a pension plan benefits when policyholders die earlier than assumed. This business helps to provide a natural hedge and limit overall mortality risk.
Individual rose a more modest 8% as higher spreads offset slightly lower fee income, given distribution costs. The higher rate environment is helping to boost annuity sales, as investors seek to lock in current yields. PRU saw $3.3 billion in individual retirement sales, an 11 year high, given strong demand for fixed annuities. Importantly, these annuities are simpler than legacy variable annuities, helping to reduce the market sensitivity of its overall business. Given strong sales and market performance, total retirement account values rose by $12 billion to $388 billion, while the $90 billion in the “Closed Block” was down from $101 billion last year. This mix shift is favorable, though it will take years for Closed Block to fully wind down. With financial markets continuing to rise, I expect further gains in account values, which should drive some incremental fee revenue.
Finally, I would note that Group insurance increased to $45 million from $25 million thanks to favorable underwriting. The picture here is a bit more mixed. As you can see, its benefit ratio was down 120bp from a year ago. However, it has been steadily rising. Q2’23 and Q3’23 were likely unsustainably strong, but I do want to see Group results stabilize in this area. Overall, this unit is a small profit contributor.
Prudential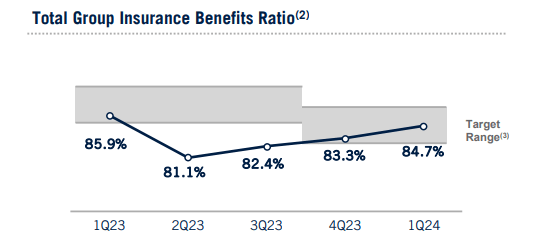
Finally, Individual Life lost $121 million given costs from closing its reinsurance transactions. As discussed in my prior articles on PRU, it has reinsured some risk, reducing profits (as it now pays reinsurance premiums), but unlocking capital, which it can deploy to support PRT and annuity sales, which should be higher margin offerings. I view this as a favorable business mix shift. Additionally, overseas profits rose nearly 7% to $894 million. International sales rose by about 5% to $520 million. It has a leading presence in Japan as well as a significant one in Brazil. Still, 61% of sales are denominated in USD, given higher domestic yields, which I view favorably as it limits FX translation risk.
Now, I would also note that Prudential’s investment portfolio is relatively conservative and diversified. Because many of these bonds were bought in a lower rate environment, it has a $7.7 billion unrealized loss in AOCI. These bonds were sold against policies at that prevailing rate environment, limiting the true economic impact. I would expect PRU to hold these bonds to maturity, gradually shrinking the AOCI loss.
Prudential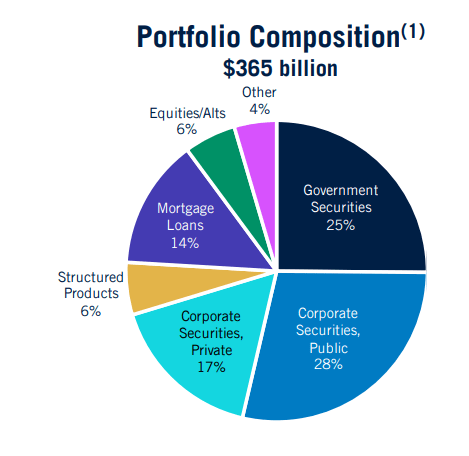
While I am comfortable with its investment portfolio, I would emphasize the 14% held in mortgage loans. To the extent we see losses, they are likely to come from commercial real estate, in my view, as higher rates have reduced valuations and office occupancy is low. PRU’s portfolio is fairly conservative. It has an average loan-to-value of 58% with a 2.45x debt service coverage ratio. Just 7% of loans have an LTV above 80%. Less than 3% have debt service coverage below 1.0x. These are the assets I am most focused on, but they total about 1% of its entire investment portfolio. Even if PRU suffers losses here, they will likely play out over years and be relatively insignificant given their small weighting in the portfolio.
Prudential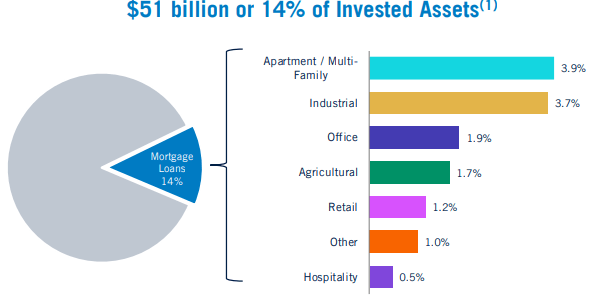
PRU also continues to be a capital return story. In Q1, it did $726 million of capital returns, including $250 million of buybacks. As a result, its share count was down about 1.5% from last year. In June, it reiterated expectations for about $1 billion in buybacks, maintaining the Q1 pace. It has a solid balance sheet with $4.2 billion of highly liquid assets at the holding company, in line with its $3-5 billion target. In Q1, it raised its dividend by 4% to $1.30 for a 4.4% yield. A $1 billion buyback equates to about 2.3%, for a total capital return yield of about 6.7%.
Now, back in March, I was targeting $12 in 2024 EPS. Given its typical 65% free cash flow conversion, that translated to about $8 in distributable earnings. Given its announced dividend and buyback plans, PRU will still likely return about $8. However, I expect it to earn more than $12. Q1 is seasonally a bit weaker as there is about $50 million in extra PGIM expenses and $70 million in extra underwriting losses, as mortality is worse in the winter. Offsetting this, PGIM performance fees may not stay so elevated.
As such, I now expect PRU to earn about $13.20-$13.40 this year. About half of this increased estimate is due to higher market levels, which mechanistically support higher fee revenue, and the rest due to better PGIM flows and faster sales of new insurance products and PRTs. This sets the company up to boost capital returns a bit next year, as I see about $8.65 in capital return capacity.
That gives PRU shares a forward 7.2% capital return yield. Given the relative slow growth of the insurance business, I continue to view a ~7% capital return yield as appropriate, which implies fair value of $123.5, about 3% above current levels. Combined with its dividend and some share count reduction, that leaves shares with an 8-9% total return potential.
As such, while PRU is doing better than I expected, that fundamental performance appears in the price, and I would remain a “hold,” as I view ~8% returns as market-like. PRU remains suitable for dividend-oriented investors with modest capital appreciation potential. However, I see more upside in other insurers like Jackson (JXN).
Analyst’s Disclosure: I/we have no stock, option or similar derivative position in any of the companies mentioned, and no plans to initiate any such positions within the next 72 hours. I wrote this article myself, and it expresses my own opinions. I am not receiving compensation for it (other than from Seeking Alpha). I have no business relationship with any company whose stock is mentioned in this article.
Seeking Alpha’s Disclosure: Past performance is no guarantee of future results. No recommendation or advice is being given as to whether any investment is suitable for a particular investor. Any views or opinions expressed above may not reflect those of Seeking Alpha as a whole. Seeking Alpha is not a licensed securities dealer, broker or US investment adviser or investment bank. Our analysts are third party authors that include both professional investors and individual investors who may not be licensed or certified by any institute or regulatory body.
