Summary:
- Thermo Fisher Scientific is well-positioned for growth due to its consistent revenue streams, strong M&A track record and minimal macroeconomic dependence.
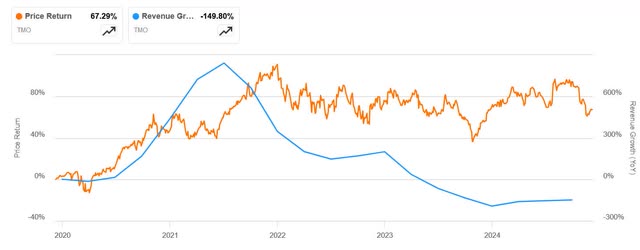
- Despite a COVID-related revenue surge and subsequent correction, the company’s valuation multiples are now reasonable, offering potential for capital appreciation.
- 2025 growth drivers include improved biotech funding and China’s government stimulus.
- Risks include higher debt costs, geopolitical tensions with China, difficulty in impactful acquisitions, and reduced diversification due to industrial end-market exposure.
- I rate the company as a Buy, as its valuation multiples are reasonable, and I expect growth to resume in 2025 and beyond.
jetcityimage
Introduction
In my portfolio, I usually combine high-growth semiconductor stocks with others that have low statistical correlation to the sector. For these diversifying stocks, I look for earnings persistence, minimal dependence on macroeconomic conditions and at least a 10% EPS CAGR.
Thermo Fisher Scientific (NYSE:TMO) fits these criteria due to its consistent revenue streams in healthcare and life sciences, which are less sensitive to economic cycles, and its strong track record of growth through M&A activities.
In this article, I’ll discuss how COVID-19 boosted the company’s revenue and earnings, leading to an overvaluation, and how the subsequent decline in COVID-related revenue disappointed the market, resulting in a stock price correction. I believe that following this cycle, the company is well positioned to return to its previous growth trajectory, offering an opportunity for capital appreciation as today’s valuation multiples appear reasonable.
The Present
Over the years, Thermo Fisher has built a wide and robust portfolio of life science instruments and consumables. Aiming to become a one-stop shop for customers, the company has invested aggressively in acquisitions, deploying more than $50 billion since 2010.
Thermo Fischer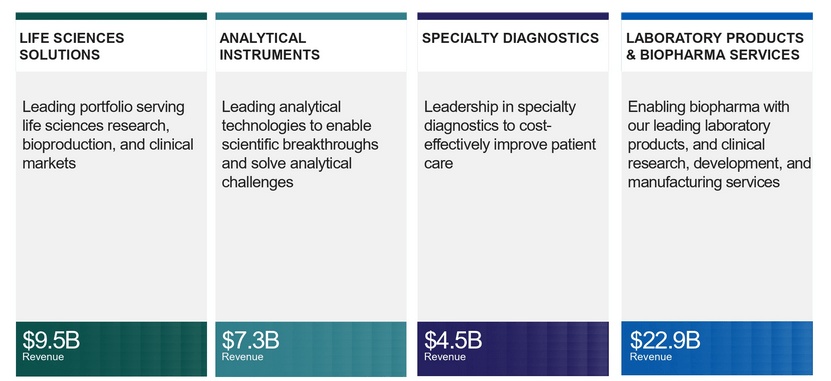
As we’ll see, the life sciences solutions and specialty diagnostics segments were the most affected by the pandemic-related revenue surge and have now returned to more normal levels.
Even with the extra revenue now gone, the pandemic helped to solidify Thermo Fisher’s status as a critical supplier, extending the company’s reach to a broader customer base, including governments.
Thermo Fischer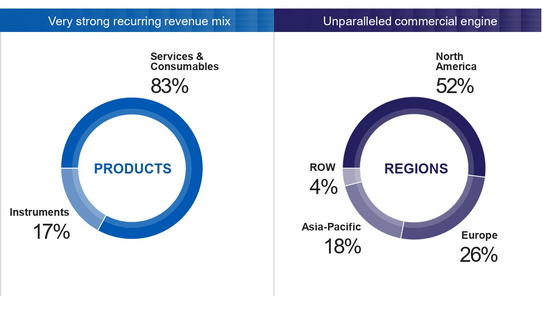
Having nearly 83% of its revenue derived from services and consumables is particularly advantageous. This high proportion of recurring revenue makes the company less susceptible to cyclical market dynamics.
The Last Quarter
Thermo Fisher Scientific’s Q3 2024 results showed revenue of $10.6 billion, flat year-over-year, with organic growth at 0%. Adjusted EPS reached $5.28, allowing the company to slightly raise its full-year adjusted EPS outlook to $21.35–$22.07, while maintaining its revenue guidance at $42.4–$43.3 billion.
By segment, Life Sciences Solutions remained soft due to weaker pharma and biotech demand, while Analytical Instruments performed well, thanks to strong growth in electron microscopy. Specialty Diagnostics grew both reported and organically by 4%, supported by strong consumables demand in immunodiagnostics and transplant diagnostics. Laboratory Products and Biopharma Services remained flat.
Despite recent headwinds, results suggest stabilization in core life science markets. The company also highlighted its innovation capabilities with new product launches, such as a transmission electron microscope, and anticipates improving end-market conditions.
Management appears optimistic about two possible growth drivers for 2025:
-
Improved biotech funding and growing confidence, which should ultimately benefit Thermo Fisher Scientific’s revenue, despite some lag.
-
China’s new equipment stimulus and loan programs, which could bolster industry demand starting in 2025 and beyond.
The History
From 2012 to the end of 2019, the company’s revenue grew steadily, with a compound annual growth rate (OTC:CAGR) of 10.74% (as indicated by the dashed line), and growth remained relatively stable at around this level. During the same period, operating profit achieved a CAGR of 14.52%, demonstrating the effectiveness of the company’s operating leverage model.
Revenue Evolution (S&P CIQ)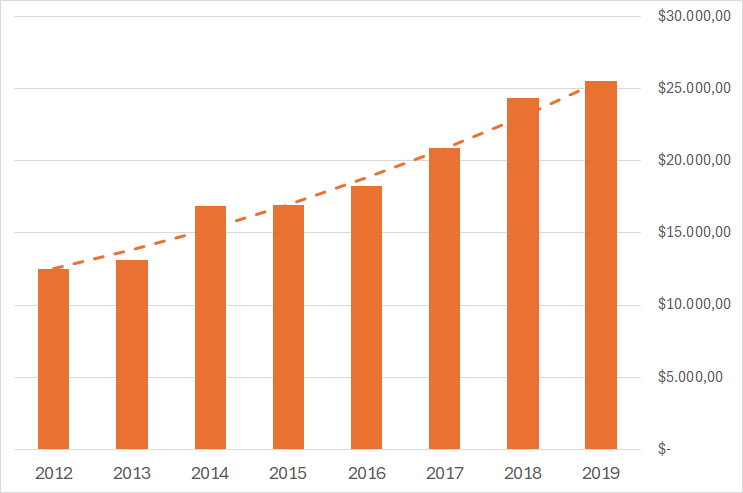
The segments’ revenue CAGR from 2016 to the end of 2019 are as follows.
- Life Sciences Solutions: 8.84%
- Analytical Instruments: 14.61%
- Specialty Diagnostics: 3.65%
- Laboratory Products and Biopharma Services: 16.38%
With the pandemic, things changed. Between the end of 2019 and the end of 2021, Life Sciences Solutions revenue climbed from $6,856 million to $15,631 million, representing nearly 128% growth. Specialty Diagnostics grew from $3,718 million to $5,659 million, and Laboratory Products increased from $10,599 million to $14,862 million. These improvements far surpassed historical averages, largely driven by demand that proved unsustainable over the long term.
By looking at the company’s historical growth trends, we see that while revenue surged in 2020, 2021, and 2022, it then underwent a natural correction in subsequent years. Now revenue is back in the level predicted by the average CAGR of 10.74%.
Revenue After Pandemic Vs Historic Growth Projection (S&P CIQ)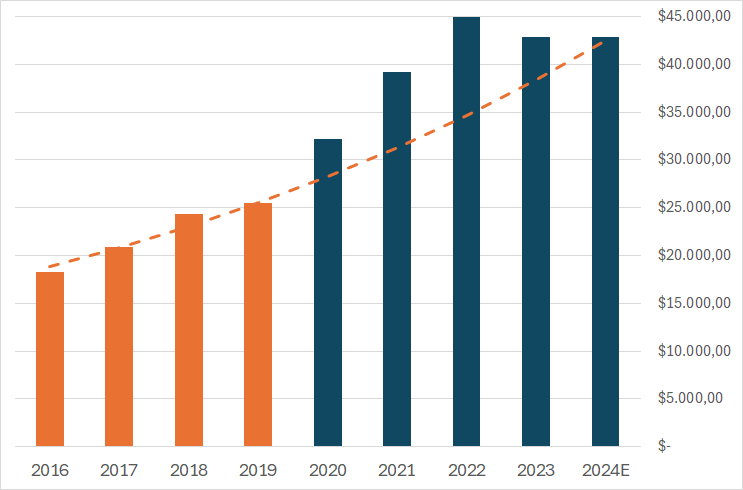
Another indicator of the company’s stability is the trend in its organic growth and the diminishing influence of COVID testing revenue, as illustrated below. After a prolonged period of negative results, organic growth reached zero in the last quarter. Simultaneously, the COVID testing revenue contribution also went to zero after previously negative contributions.
Organic Growth and Impact of Covid on Revenue (Thermo Fischer)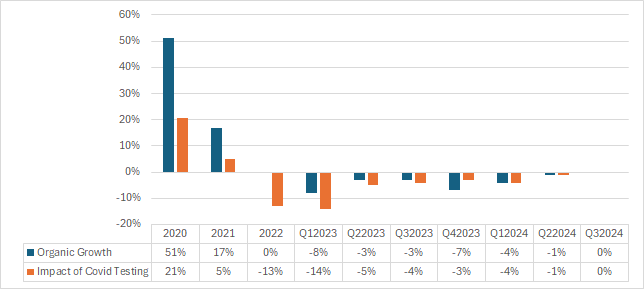
The Plan
During their latest analyst day in September 2024, Thermo Fisher disclosed its long-term financial strategy, which largely continues the same approach it has been following. The company expects to allocate 60–75% of its available capital to mergers and acquisitions, with the remainder returned to shareholders through buybacks and dividends.
This financial model relies on market and organic growth, return on invested capital and margin expansion.
Thermo Fischer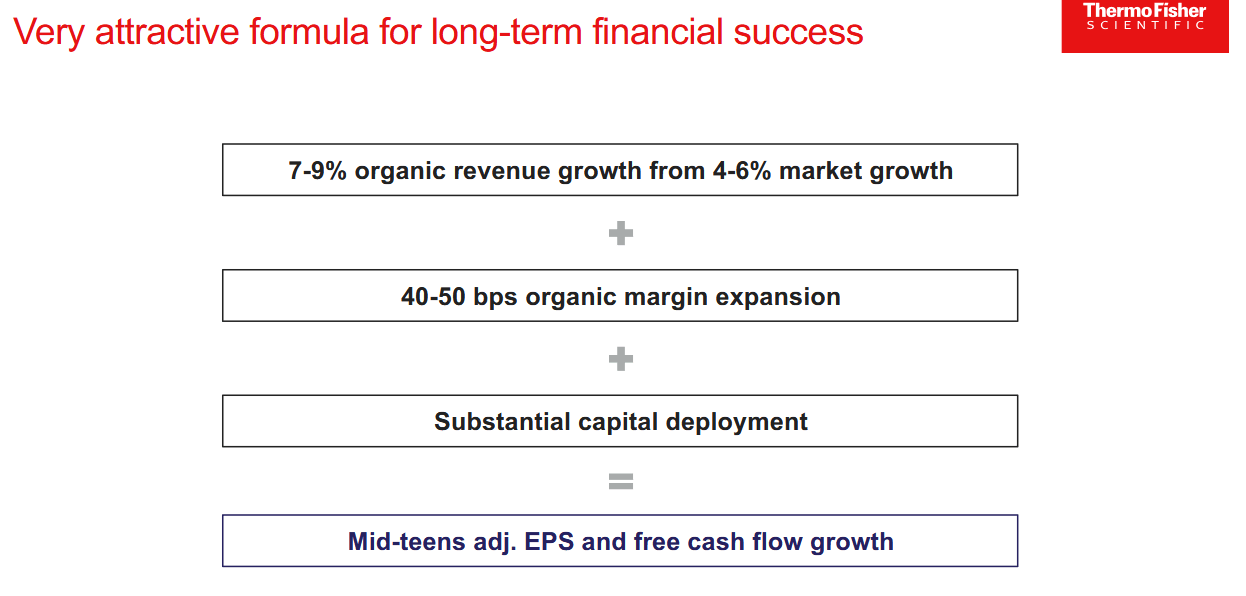
I’ll use this guidance as input for my model.
Risks
The main risks associated with my Buy rating are as follows.
-
Higher Cost of Debt:Although the company has a strong track record of acquiring other firms using debt, current U.S. interest rates are significantly higher than they were over the past decade. Bears argue this may compromise the company’s return on invested capital (ROIC).
-
Exposure to China:The company derives a decent portion of its revenue from China (Asia-Pacific is at 18%), and escalating geopolitical tensions, particularly under the Trump administration, could limit its ability to sell into that market or lead to additional tariffs. Moreover, China, previously a key growth driver, is likely to experience slower economic expansion going forward.
-
Difficulty in Finding Impactful Acquisitions:The company is already very large, so any new acquisition must be substantial, and therefore likely expensive, to meaningfully move the needle. Furthermore, as the company continues to pursue acquisitions, it becomes increasingly difficult to identify targets offering clear synergies and straightforward returns on capital.
-
Reduced Diversification:The presence of an industrial end-market segment can reduce the stock’s overall diversification benefits and diminish its insulation from broader economic cycles.
Peer Analysis
Danaher (DHR) is the company most comparable to Thermo Fischer. However, Seeking Alpha’s quant comparison gives Thermo Fisher the advantage, with better growth and EPS revisions.
Quant Factor Comparison (SA)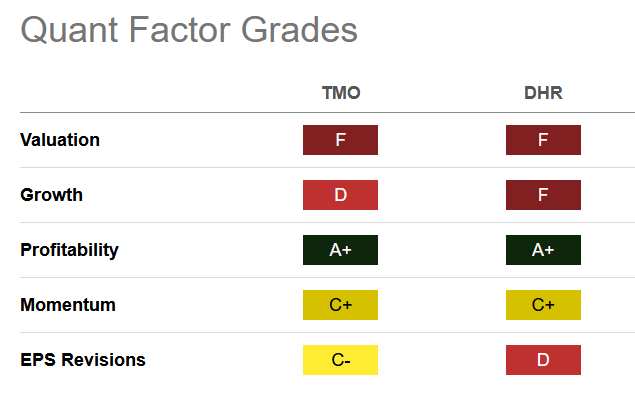
A deeper look at the valuation metrics shows that Thermo Fisher has lower multiples across nearly all measures:
Valuation Rating Comparison (SA)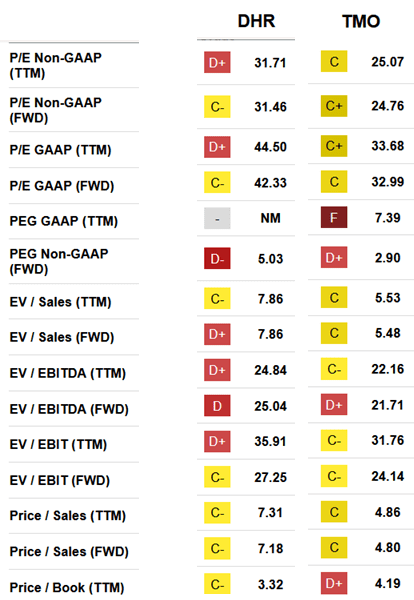
Valuation
To evaluate the company’s value, I use a range of scenario analyses:
-
Organic Growth: I assume an organic growth rate of 7–9%, as guided by the company.
-
Operational Leverage: In Scenario 3, I use a value of 1.5, which is both historically verified and guided by the company. For other scenarios, I apply more conservative leverage values.
-
Valuation Multiples: For the conservative case (Scenario 1), I use today’s multiples minus one standard deviation based on the past three years. For the bull case (Scenario 3), I use today’s multiples plus one standard deviation.
-
Discount Rate: I apply a WACC of 9% across all scenarios.
Valuation Scenarios (Elaborated by the Author)
Based on the analysis and the values considered, I believe this is an asymmetric opportunity that points to a buying case. Furthermore, if we consider the company’s historical average multiples, we could see additional returns if the multiple reverts to those levels.
Conclusion
I rate the company as a Buy, as COVID-related revenue losses are finally over. In addition, Chinese stimulus measures and a recovering biotech funding environment are likely to drive growth through 2025. I am also confident in management’s ability to execute good acquisitions, given their strong track record. Overall, the company’s valuation indicates asymmetric upside, and today’s multiples appear reasonable compared to historical ones.
Analyst’s Disclosure: I/we have a beneficial long position in the shares of TMO either through stock ownership, options, or other derivatives. I wrote this article myself, and it expresses my own opinions. I am not receiving compensation for it (other than from Seeking Alpha). I have no business relationship with any company whose stock is mentioned in this article.
Seeking Alpha’s Disclosure: Past performance is no guarantee of future results. No recommendation or advice is being given as to whether any investment is suitable for a particular investor. Any views or opinions expressed above may not reflect those of Seeking Alpha as a whole. Seeking Alpha is not a licensed securities dealer, broker or US investment adviser or investment bank. Our analysts are third party authors that include both professional investors and individual investors who may not be licensed or certified by any institute or regulatory body.
