Summary:
- Nike is a dominant leader in the athletic footwear and apparel space generating high ROIC and outlier EBIT margins.
- The company trades at a discount to historical, peer and DCF multiples with aligned management at the helm.
- Per my analysis, Nike is a Strong Buy at current levels that could offer ~13%-15% CAGR within 3 years in addition to ~2% dividends.
code6d
Nike (NYSE:NKE) is a high ROIC business with sustainable competitive advantages trading at a fair price. The ownership, board and C-suite are aligned with strong incentives and skin-in-the-game. The company also has a simple and understandable capital allocation policy geared towards returning cash to shareholders. Despite near-term operational concerns, Nike is well-positioned for long-term outperformance on a go-forward basis. I recommend a strong buy for Nike at $65-$70 per share, targeting a price CAGR of ~13%-15% in 3 years.
Company Overview
Nike is an American athletic footwear and apparel corporation headquartered in Beaverton, OR. The company designs and markets athletic footwear, apparel, equipment, accessories, and services worldwide. Nike is the largest seller of athletic footwear and apparel in the world. The company sells its products through 2 channels: NIKE Direct (comprised of Nike-owned retail stores and its digital platforms), and wholesale accounts (comprised of independent distributors, licensees, and sales reps). As of May 2024, Nike had 79,400 employees, 8 US distribution centers, 68 international distribution centers, 377 US stores, and 668 international stores. The company also owns Converse and Jordan Brand.
Nike was founded by Phil Knight and Bill Bowerman in 1964 as “Blue Ribbons Sports”. Bowerman was a legendary University of Oregon track coach, and Knight was his runner/mentee. Blue Ribbons Sports was initially the exclusive distributor of Onitsuka Tiger shoes in certain US states, but gradually developed and sold its own Nike brand. For more information on Nike’s founding, please read Shoe Dog by Phil Knight, which was recommended by Warren Buffett.
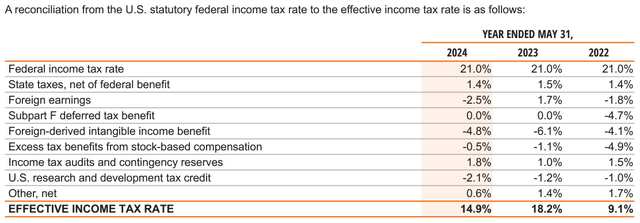
Today, Nike generates sales of ~$50B and EBIT of ~$6B. It pays very little in taxes (~15%) using a complicated tax strategy called “offshoring” and R&D credits. The company generates 43% of sales in NA, 28% from EMEA, 15% in Greater China, and 14% in APLA. Wholesale is 56% of sales, while direct-to-consumer sales account for 44%. Nike remains a Shoe Dog, netting 68% of sales from footwear. The company is ranked 93rd in 2023’s Fortune 500.
Nike Revenue Breakdown (Company data) Nike’s Tax Breakdown (Company data)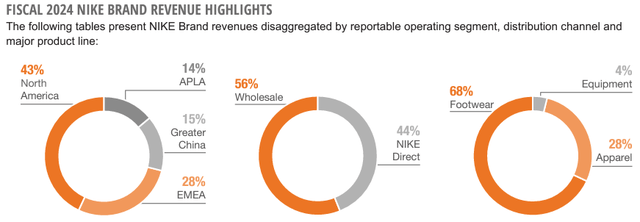
For this report, I relied primarily on sources such as 10K, 10Qs, proxies, earnings transcripts, sells-side research, Balyasny AI, field research, Tegus transcripts, Reddit, LinkedIn, Nike’s website, news articles, YouTube videos, books on Nike, podcasts on the company, etc.
Good Business
ROIC: The best test of a business’s “moat” is its ability to maintain high ROIC over long periods. Nike reports its own estimates of ROIC in the 10K. The formula is the following:
NOPAT/(Total debt + Shareholder’s equity – Cash and equivalents and Short-term investments). Where total debt includes the following: 1) Current portion of long-term debt, 2) Notes Payable, 3) Current portion of operating lease liabilities, 4) Long-term debt and 5) Operating lease liabilities.
It’s good that management includes leases in the formula. I have no qualms over management-provided ROIC as it is calculated fairly:
Nike ROIC (Author’s Calculation)
Nike pays less taxes than the statutory rate (21%) due to the aforementioned “offshoring” strategies and R&D rebates. On a normalized tax basis, the company’s ROICs are still very high:
Nike ROIC tax adjusted (Author’s Calculation)
Peer ROIC: Nike’s competitors are gasping for air. The table below shows Nike vs peer ROIC calculated with the same ROIC formula. The large spread indicates Nike’s capital efficiency, driven by superior asset turnover and margins (more on this later):
Nike ROIC vs Peers (Author’s Calculation)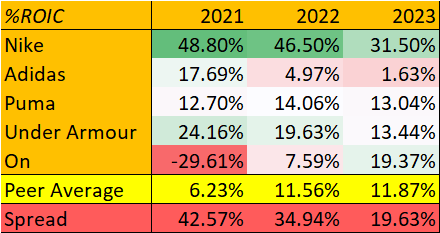
Phantom Intangibles: Nike delivers long-term ROIC above the cost of capital due to the presence of “phantom” intangible assets. Accounting rules dictate that intangibles must be amortized overtime to capture asset/brand “depreciation”. Brand deterioration happens for most companies, but not Nike. I’d argue that brand value created from the ~$3M or so Nike spent on hiring Michael Jordan in the 80s did not depreciate but appreciated overtime. Today, the Jordan Brand does ~$7B in revenue and is one of the fastest growing Nike segments, increasing sales by 35% since 2022.
Jordan’s story is also an effective recruiting tool for Nike to sign on younger athletes aspiring to be like Mike. The Jordan legacy arguably allowed the company to sign 2 of the best NBA players of the 21st century, Kobe Bryant and LeBron James. Kobe is notably obsessed with Jordan, and there is an incredible article on how Nike signed rookie LeBron by leveraging “be like Mike”. Today, Nike is using the same tactic to lure top young players who idolize Kobe and LeBron, such as Jayson Tatum (loves Kobe, signed to the Jordan brand), Luka Doncic, and Zion Williamson.
Nike uses the same strategy in other sports. In soccer, the signing of Cristiano Ronaldo years ago has potentially led to deals with Kylian Mbappe and Erling Haaland, 2 top current players who were Ronaldo fans. Jordan/Ronaldo spending is among many other intangible assets Nike has invested in the past that is growing and unaccounted for on the balance sheet.
It is hard to ascertain a value for Nike’s phantom assets, but if we were to treat Nike as a normal business earning cost of capital returns (ROIC of 10%), we can find a normalized level of IC. Then, by finding the spread between normal and reported IC, we can estimate the value of the intangibles:
Nike Brand Value 1 (Author’s calculation )
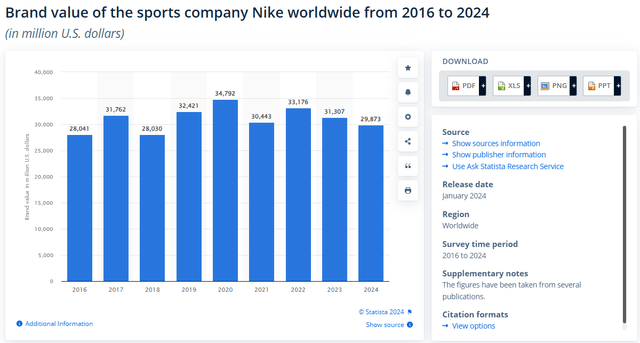
To triangulate, Statista shows the following values for Nike’s brand. Statista pulled these numbers from Brand Finance, a third-party brand consulting firm. The numbers are close. Truth is likely somewhere in the middle between Statista and spread.
In sum, Nike’s phantom intangible assets, unaccounted for on the balance sheet, allow it to reduce reported IC, which helps propel ROIC higher than that of peers and the cost of capital.
Margins: Nike has lower gross margins than peers, though high on an absolute basis. This is likely driven by Nike’s disproportionate revenue contribution from footwear (68%), which is lower GM than that of apparel. Adidas and Puma sell more apparel and accessories (~47% and ~43%, respectively), hence the higher GM. Seems fair, as it costs more to make shoes than shirts.
Nike GM vs Peers (Author’s Calculation)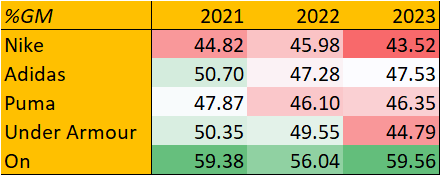
However, Nike’s operating margins are significantly higher than peers-what’s going on in the operating expense section? This is where Nike’s scale advantages come into play. Nike has a section in opex called “demand creation activities”, which is essentially the marketing budget. Demand creation typically runs at ~8%-10% of sales, or ~$4B-$5B annually.
Nike OPM vs Peers (Author’s Calculation)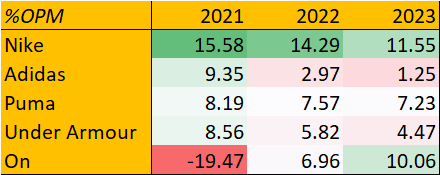
Sports marketing has winner-take-all dynamics. Ask the layperson to name athletes they know of in various sports, and they could probably only recall 1-2 top players. Look no further than Instagram, where LeBron has ~13x the follower count of James Harden.
Top athletes like LeBron, Ronaldo, and Tiger Woods have a disproportionate share of “eyeballs” attached to them. Why? These athletes have a certain mystique to them either due to personality or play (or both), which allows them to access more screen time / social media followers, which drives more ad opportunities for their endorsers, which incentives endorsers to spend more on marketing them, which increases their mystique…the flywheel goes on and on:
The Athlete Flywheel (Author’s Creation)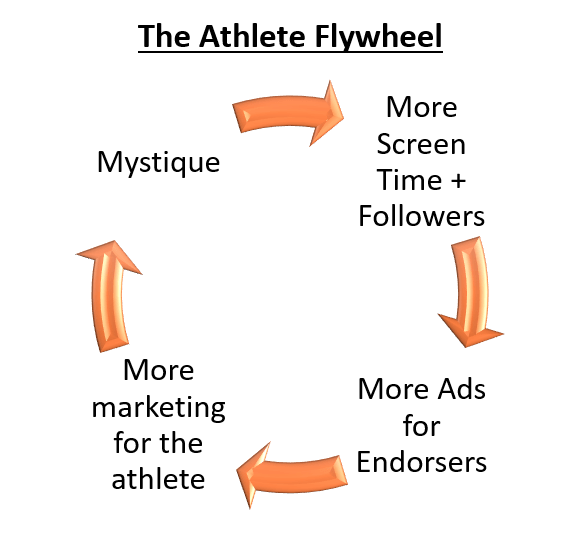
Nike’s ~$4B-$5B annual marketing budget is the largest in sports, allowing it to lure the best athletes away from Adidas or Under Armour (marketing budget of ~$2.5B and ~$600M, respectively). Moreover, I’d argue that Nike’s marketing spend is also higher ROI than peers due to the pareto-distributed brand power the best athletes possess versus, say, the second or third best.
Financially, Nike’s marketing budget is a massive headwind for its peers’ margins. To compete with Nike on a commensurate level, Adidas needs to puke out ~$4B-$5B while spreading it across lower sales (~$24B instead of ~$50B; ~17%-21% instead of ~8%-10% of sales), which cannibalizes OPM.
Under ex-CEO John Donahoe, demand creation ticked lower to ~8% of sales. Nike is not a business with operating leverage. Instead of weakening the demand creation engine, I believe OPM improvements should come from trimming expenses (which is up since 2021) or boosting GPM via better pricing. For better pricing, Nike would need to launch new compelling products while halting dilution in product lines meant to be supply scarce. Easier said than done-we’ll see what new CEO Elliot Hill has in store for us.
Brand vs Product: I had a conversation with a friend on the differences between a brand and a product. A brand is more of an ecosystem that can be applied across various products. Think how Nike sells shoes but also sticks its logos on apps, clothes, headbands, TV ads, events, the Olympics, etc. On the other hand, a product is less comprehensive and is subject to fads. On and especially Hoka make good running shoes but lack an ecosystem where the brand can be leveraged across other products. This is obviously more anecdotal but an interesting thought, nonetheless.
Summary: Nike generates exceptionally high ROIC in a competitive industry, aided by phantom and growing intangible assets. The company has scale advantages that a) make competition with Nike uneconomical for peers, and b) allow Nike to post abnormally high relative OPMs. Nike is also a brand rather than a product company, which allows it to develop an ecosystem accretive to products outside of shoes. In short, Nike is a wonderful business.
Alignment of Interest
Ownership: Phil Knight and family own almost all the company’s Class A shares, which constitute ~22% of total shares. Class A shares are convertible to Class B shares 1:1 and hold identical economic rights. Where the As and the Bs differ is voting rights-As can vote to elect 75% of directors, while Bs only get to vote for 25%. Bill Ackman’s Pershing Square and Terry Smith’s Fundsmith own ~1.4% and ~0.5% of Nike shares, respectively. Nike has also issued $300K of redeemable preferred stock, 100% owned by Sojitz. Sojitz, previously Nissho-Iwai, is a Japanese trading house with early ties to Nike detailed in Shoe Dog.
Nike Ownership Summary (Company Material)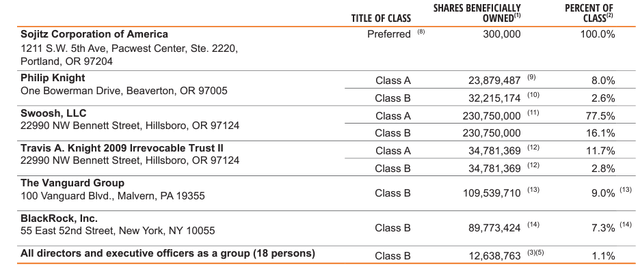
Board: Key board members include Apple CEO Tim Cook, Travis Knight (Phil’s son), and former Nike CEO Mark Parker. Cook is the lead independent director and a board member since 2005. Travis Knight has been a director since 2015, Parker has been executive chair since 2020, and Phil Knight remains chairman emeritus. Other notable directors include John Rogers, CIO of Ariel Investments (since 2018).
Management: Elliott Hill was appointed CEO after John Donahoe stepped down in October 2024. Donahoe has been a board member since 2015 and was the former CEO of eBay, ServiceNow, and Bain. In January 2020, Donahoe became Nike CEO, a rare external hire, reportedly backed by Tim Cook. Seemingly qualified, Donahoe was tasked to lead Nike’s digital transition. However, his leadership fell short of lofty expectations, to say the least.
Hill was appointed CEO after Donahoe retired in October 2024. Hill is from Austin, TX and attended TCU. He then worked as a trainer for the Cowboys out of college. Subsequently, Hill went to Ohio University for his masters, and joined Nike’s Memphis sales team in 1988. A Nike “lifer”, Hill worked in various sales and product roles, eventually becoming President of Consumer & Marketplace. He retired in 2020 after being passed over for the CEO job.
Upon his appointment, Hill telegraphed repeatedly to staff in an internal video that Nike must “put the consumer first”. Though Hill was absent from the recent 1Q2025 earnings call, management has noted “accelerated investment in demand creation”-a reversal of Donahoe’s initiatives. There have also been signs of normalization of relations between Nike and its retailers, which have been icy under Donahoe. Tegus calls indicate that employee morale is high under Hill. Nevertheless, I am reminded of Buffett’s quote, “When a management with a reputation for brilliance tackles a business with a reputation for poor fundamental economics, it is the reputation of the business that remains intact”. Nike’s business isn’t so strong that even an idiot could run it, but the moats should be deep enough to allow it to thrive under normal management.
Compensation: Directors receive fixed fees of ~$100K, stock awards of ~$200K, and additional compensation of ~$20K as committee chairs. Directors need to hold stock valued 5x their annual cash retainer, and new directors need to attain these ownership levels within 5 years.
Executives get paid a base salary, STI, and LTI. The CEO receives a ~$1.5M base, which is only ~6% of total compensation. STI is tied to annual metrics, usually 50/50 weighted between adjusted revenue and EBIT targets. LTI is 15% RSUs, 35% stock options, and 50% PSUs. PSUs are tied to 3-year relative total shareholder returns versus the S&P 500. RSUs and stock options are tied to Class B stock prices. The CEO must own stock 8x of the base salary (3x for NEOs).
Summary: Nike has a controlling family with +20% of shares and outsized voting rights. The company also boasts a list of value-oriented shareholders (Ackman & Smith) and reputable directors (Cook, Rogers, etc.) who are financially sophisticated and long-tenured. Management and directors are compensated in a way that incentivizes skin in the game and shareholder value creation. However, I am slightly disappointed by the fact that STI metrics are not tied to creating value per-share. On the positive side, management aggressively repurchases shares (more on this under capital allocation), and benchmarks itself against a tough index, the S&P, on a long-term basis. Therefore, the per-share focus is more or less implied. Overall, Nike’s setup allows the founding family to retain control, fostering dialectic materialism between a long-term orientation (opposite of Wall Street) and fewer minority shareholder rights. Mr. Ackman and Smith don’t seem to mind-I don’t either.
Nike Exec Comp Summary (Company materials)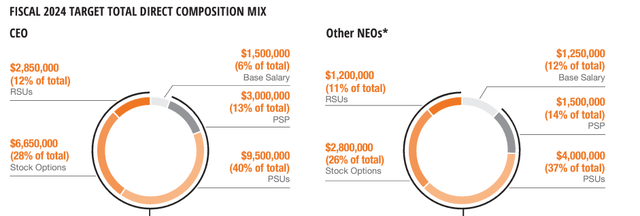
Capital Allocation
Nike’s capital allocation is simple and understandable. The chart below breaks down how the company’s OCF, capex, dividends, and buybacks flow through the CF statement:
Nike Capital Allocation History (Company Data)
Basically, money comes in, money goes out to shareholders. So how does Nike grow with such low levels of capex? The answer is through the P&L. By investing in R&D and demand creation, Nike creates new and compelling products, then markets them to existing and new markets. A) is accretive to price and b) is accretive to volumes. Hence, Nike’s growth capex isn’t done via the CF statement but via the P&L.
Nike IR Homepage (Nike IR Homepage)
Nike is not an acquisitive company, preferring to grow organically. This is a positive since management is unlikely to squander FCF on M&A. Nike has bought brands such as Converse, Hurley, and Cole Haan in rare instances. Converse was a home run-Nike paid ~$300M in 2003 for $205M in sales, which grew to ~$2B in sales and $500M in EBIT in 2024. Hurley and Cole Haan were less successful.
Margin of Safety
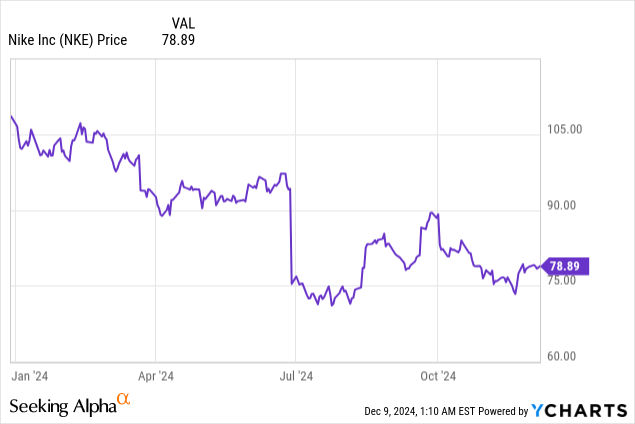
Why This Opportunity Exists: Nike suffered a ~20% derating in June 2024 due to disappointing 4Q2024 results, which saw the stock go from ~$95 to ~$75. The company missed revenue and GM expectations and offered underwhelming 1Q and full-year 2025 guidance. The stock bottomed around late July at ~$70, then recovered to ~$85 going into September, but de-rated again to ~$78 until CEO John Donahoe announced his retirement and replacement by Elliott Hill. The market received Hill enthusiastically, re-rating the stock to ~$90. But in early October, Nike missed 1Q revenue expectations (though beating on GM) and withdrew a) 2025 guidance and b) the November 2024 investor day indefinitely. Hill was not present as the CFO led the 1Q call. For 2Q, the CFO offered revenue and GM guidance below expectations. Since then, the stock has embarked on a slow decline from ~$90 to ~$75 today:
5 key overhangs remain for Nike:
- Management Change: Though Hill was well received by the market, lack of communication and the investor day delay have created uncertainty for catalyst-driven investors.
- Growth/Share Loss: Nike is ceding shelf space and market share to new entrants like Hoka and On, causing growth to decline.
- Lack of Product Innovation: Former employee Massimo Giunco posted a LinkedIn rant in July 2024 about Nike’s product innovation issues, which received 10k likes and ~700 reposts. There was also a hit piece from the Telegraph titled “I wouldn’t wear these trainers – my dad has them’: How Nike lost its edge. Anecdotally, Nike has been selling me the same shoes as when I was a decade younger.
- China Weakness: While not exactly news, China’s economic and political issues have added uncertainty to Nike’s growth and supply chains. I believe these fears are slightly overblown since only 15% of sales and 18% of production is in China (Nike has shifted most of its production to Vietnam and Indonesia, or 50% and 27%, respectively). Chinese sales are also not performing nearly as badly as consensus expects-it’s beaten street estimates for 2 quarters in a row.
- Margin Pressures: Management expects GM shrinkage of 150bps in 2Q. The company also expects demand creation expense to increase, though offset by overhead reduction. Margins and EPS estimates could miss if management fails to deliver tighter overhead against rising marketing spend, which could cause pod shops to steer clear of Nike stock.
Historical Multiples: All of Nike’s relevant multiples are trading at a discount on 3, 5, and 10-year numbers and in line with 20-year multiples. Forward multiples exhibit the same pattern:
Historical Multiple Table 1 (Author’s Calculation) Historical Multiple Table 2 (Author’s Calculation )

Peer Multiples: Nike trades at ~20%-30% discount to comps despite positing significantly higher margins than peers.
Comp Table 1 (Author’s Calculation) Comp Table 2 (Author’s Calculation )

DCF: I assumed sales decline and recovery in line with consensus in 2025 and 2026, followed by gradual recovery to historical topline growth of 7%. The Nike brand travels well and has ample runway for expansion internationally, particularly in India and Indonesia. Secular trends like workplace casualization and growing women’s sports participation also help. I believe 7% is reasonable since it is approximately global GDP +1%.
Veering away from consensus, I project no EBIT margin expansion for Nike. As mentioned before, Nike is not a business with operating leverage. The street thinks EBIT margins could expand up to ~15%, which could lead to a DCF value of ~$120-$130/S. Call me old-school, but I don’t buy it.
I believe long-term interest rates will stay ~4%, or ~3% post-tax. Add 4% of risk premium, and we will arrive at a WACC of ~8%, or ~6% post-tax. With a 16x terminal multiple, we get to an intrinsic value of ~$100/S for Nike-~40% upside from my recommended buy price of ~$70:
Nike DCF (Author’s Calculation)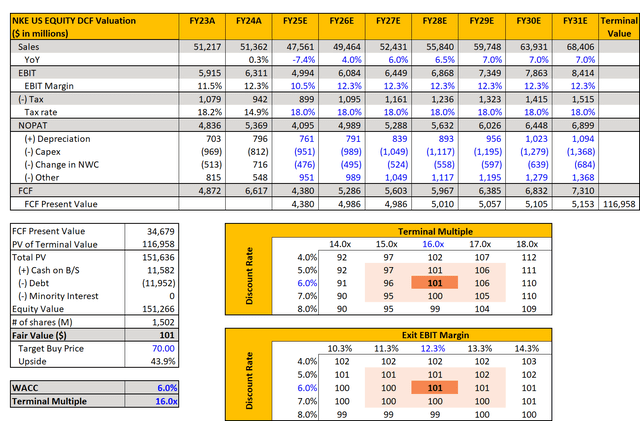
The Templeton/Oakmark Way: Sir John Templeton liked to buy stocks for under 5x his estimated Fwd 5-year EPS. Similarly, Oakmark’s Bill Nygren is willing to pay for companies trading below a market multiple on his estimated Fwd 7-year EPS. ~$9B of Nike’s ~$18B buyback authorization remains, and the company typically repurchases ~1%-2% of shares outstanding annually. If share count shrinks at 1.5% going forward, at a 16x multiple, Nike could be a buy for Oakmark. Templeton might be less enthusiastic.
Templeton/Oakmark Valuation Method (Author’s Calculation)
Lou Simpson: Legendary investor Lou Simpson held Nike stock for years, according to his profile in Concentrated Investing by Allen Benello. Simpson liked to buy Nike at ~8% FCF yield when rates averaged ~6.5% (~4% post 35% tax) between 1990s-2000s, implying a ~4% risk premium. In today’s rate regime, Simpson might buy Nike at ~6%-7% FCF yield on ~$5.5B of normalized FCF-a target price of $80B-$90B. With market cap gyrating between $100B-$110B today, Nike is flirting with Simpson’s preferred levels. However, readers should note that Nike was growing faster in the 90s.
Joel Greenblatt: Nike is currently top 120/~500 stocks in the Gotham 1000 Value ETF (GVLU). GVLU was launched by Joel Greenblatt in 2022, focusing on high ROIC stocks with low earnings yield. Using the Wayback Machine, I was able to ascertain that Nike was top 35/~500 stocks in GVLU during July 2024 lows (~$73). Nike is also one of Greenblatt’s Value Investors’ Club’s most written-up names. This is a further indication that Nike is cheap and high quality:
VIC Publishing Board (Author’s Screenshot)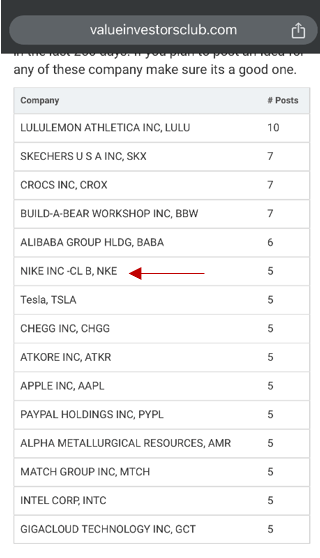
Summary: Nike trades at a discount to historical multiples, comps, DCF and valuation points that would make super investors salivate. The bottom line is this-Nike is cheap.
Risks
Execution Risk: Nike could experience long lead times to come up with new and compelling products. Moreover, the company would have to amend relationships with its wholesale accounts, which is a time-consuming process. The aforementioned factors could lengthen the timeline for Nike’s turnaround.
Volatility: Nike withdrew its investor day indefinitely and switched from providing yearly to quarterly guidance, which could cause heightened volatility for the stock price in the short term. Nike is not a stock for investors with a short time horizon.
Operational Risk: Nike’s overseas manufacturing base is located in Vietnam, Indonesia and China. Geopolitical uncertainty in each of these countries could negatively affect the company’s supply chain capabilities.
Conclusion
Nike is a wonderful business with durable moats, selling at a fair price. The company is highly aligned with an involved majority owner, a financially sophisticated board, a lifer CEO benchmarked against SPX, and minority shareholders with impressive investment track records. Nike is also adept at allocating capital, electing to avoid M&A to prioritize organic growth through R&D and marketing. Buffett once said, “The best thing that happens to us is when a great company gets into temporary trouble. We want to buy them when they’re on the operating table”. Nike is on the operating table for a minor surgery. I recommend going long Nike at $65-$70/S for a price CAGR of ~13%-15% as the company trades back to its DCF intrinsic value within 3 years while collecting ~2% dividends in the interim.
Editor’s Note: This article was submitted as part of Seeking Alpha’s Top 2025 Long/Short Idea competition investment competition, which runs through December 21. With cash prizes, this competition — open to all analysts — is one you don’t want to miss. If you are interested in becoming an analyst and taking part in the competition, click here to find out more and submit your article today!
Editor’s Note: This article discusses one or more securities that do not trade on a major U.S. exchange. Please be aware of the risks associated with these stocks.
Analyst’s Disclosure: I/we have a beneficial long position in the shares of NKE either through stock ownership, options, or other derivatives. I wrote this article myself, and it expresses my own opinions. I am not receiving compensation for it (other than from Seeking Alpha). I have no business relationship with any company whose stock is mentioned in this article.
Seeking Alpha’s Disclosure: Past performance is no guarantee of future results. No recommendation or advice is being given as to whether any investment is suitable for a particular investor. Any views or opinions expressed above may not reflect those of Seeking Alpha as a whole. Seeking Alpha is not a licensed securities dealer, broker or US investment adviser or investment bank. Our analysts are third party authors that include both professional investors and individual investors who may not be licensed or certified by any institute or regulatory body.
