Summary:
- Diamondback Energy and Exxon Mobil are major energy production companies.
- They both have generous shareholder capital return programs.
- I compare them side-by-side and share which one I think is the better buy right now.

imaginima
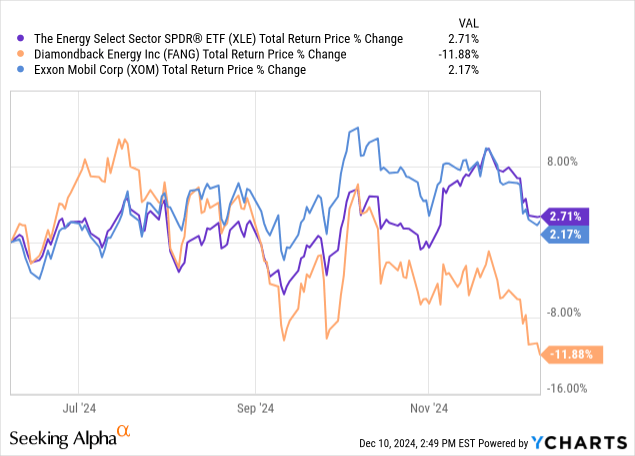
Exxon Mobil Corporation (NYSE:XOM) has recently performed in line with the broader energy sector (XLE), while Diamondback Energy, Inc. (NASDAQ:FANG) has meaningfully underperformed it.

In this article, we will compare these two companies side by side and explain why we think only one of these stocks is a compelling buy right now.
FANG Stock Vs. XOM Stock: Business Models
The main difference between XOM and FANG lies in the size and diversification of their business models. XOM has a global presence as the world’s pre-eminent energy company (including a leading presence in the Permian Basin as well as Guyana, Mozambique, and Papua New Guinea) and is involved in every segment of the oil and gas value chain. As a result, it’s less dependent on any single region, commodity, or business segment of the energy industry and therefore has a more stable cash flow profile than many of its smaller peers. This diversification also gives XOM the flexibility to choose from a wide array of investment opportunities to maximize its returns on retained cash flows.
One downside of being so large, however, is that XOM has to pursue very large acquisitions and/or investments to move the needle for production growth on a percentage basis. While there are only so many opportunities that meet this threshold, XOM was able to acquire Pioneer Natural Resources a little over a year ago in a massive $59.5 billion acquisition.
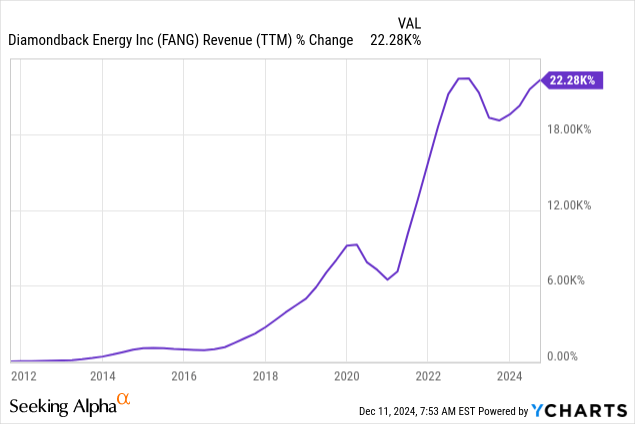
In contrast, FANG is concentrated on the Permian Basin, with a focus on the Midland Basin. While this means that it’s much more geographically concentrated than XOM and has much less investment optionality, it also comes with some positives. These include being able to focus on optimizing its production efficiencies and being able to focus on smaller transactions that are still needle-moving for the company’s bottom line. Additionally, the Permian Basin is one of the best energy production regions in the world, so being concentrated there is most likely not a bad thing. As the chart below illustrates, FANG has been able to grow its revenues quite rapidly over time.

Meanwhile, it acquired Endeavor Energy in a $26 billion transaction earlier this year, positioning it to continue growing its revenues at an aggressive clip moving forward.
FANG Stock Vs. XOM Stock: Balance Sheets
Both businesses have strong investment-grade credit ratings that indicate they have strong balance sheets. However, XOM is in a stronger financial position due to its well-diversified business model, which provides a more predictable cash flow profile. That said, FANG is working aggressively to pay down its debt, which should help further de-risk its balance sheet. Overall, while both companies are in a position of financial strength, XOM is in a bit stronger of a position due to its business model size and diversification, as evidenced by its superior credit rating (AA- from S&P) relative to FANG (BBB from S&P).
FANG Stock Vs. XOM Stock: Capital Allocation Strategy
FANG’s No. 1 capital allocation priority right now is reducing its debt from its current level of $12.7 billion to about half that level over the next several years. Beyond that, FANG plans to return about 50% of its cash flow to shareholders through dividends and buybacks. While it has paid out a variable dividend in the past, management has announced that it plans to continue to pay out and grow its base dividend while allocating the remainder of capital returns towards buybacks. As management stated on its latest earnings call:
I would say post Endeavor, we certainly have a business that’s worth more combined and diamondback standalone per share. And so that’s increased kind of our tolerance for buying back shares at these levels.
As a result, it has recently increased its buyback authorization from $2 billion to $6 billion.
XOM also generates significant free cash flow, which it uses to support its regularly growing dividend, buy back stock, and reinvest in high-returning growth projects. Like FANG, XOM is leaning heavily into buybacks right now, as it plans to repurchase $20 billion worth of stock each year through 2025 (~4% of its outstanding shares each year at its current market cap). This buyback plan combines with its 3.4% current dividend yield to deliver a mid-to-high single-digit percentage yield in terms of capital return to shareholders. Meanwhile, between its aggressive buybacks (which reduce its total dividend outlays each year) and the fact that it has been able to consistently grow its dividend year after year for over four decades through all sorts of macroeconomic and oil price environments, investors should be able to have a high degree of confidence that XOM will continue to grow its dividend consistently moving forward.
While FANG is leaning into buybacks, it should be able to grow its base dividend consistently as well. This will be fueled by reducing its interest expenses by paying down debt, buying back stock to reduce its total dividend payouts, and continuing to improve production efficiencies to further reduce its already low $37 WTI dividend breakeven point. As management pointed out on its most recent earnings call:
I think the only thing that’s really going to be steady is the base dividend and base dividend growth.
FANG Stock Vs. XOM Stock: Valuation Analysis
Analysts expect XOM to grow both its earnings per share and dividend per share at a 4-5% annualized CAGR. Meanwhile, FANG is expected to grow its EPS at a slightly higher 6-8% CAGR over the next several years thanks in large part to its more aggressive buyback plan and recent acquisition.
While FANG is expected to grow faster than XOM, XOM currently offers a higher dividend yield than FANG does (3.5% vs. 2.5%). Finally, FANG’s price-to-earnings (P/E) ratio and free cash flow yield are both more attractive than XOM’s (11.3x vs. 14.4x and 10.1% vs. 7.6%, respectively).
FANG Stock Vs. XOM Stock: Investor Takeaway
Overall, both XOM and FANG are high-quality energy companies with strong balance sheets, good assets, and shareholder-friendly capital allocation policies. For investors looking for a blue-chip energy production company that pays a solid 3.5% dividend yield and is likely to continue growing its dividend at an inflation-beating pace for years to come, XOM is the clear winner in this comparison.
However, for investors seeking to generate significant alpha relative to the broader energy sector, FANG’s sharp pullback in recent months makes it an attractive buying opportunity. While the 2.5% yield is nothing to write home about, FANG’s strong growth profile and high free cash flow yield that will be largely allocated toward paying down debt and buying back shares position it to deliver considerable value to shareholders in the coming years. As a result, FANG looks like a high-upside, relatively low-risk opportunity in the energy space. In contrast, XOM appeals less to total return-focused investors and instead has greater appeal to risk-averse income investors. However, for that type of investment, we prefer midstream blue chips (due to their higher yields and even more stable cash flow profiles) at High Yield Investor. As a result, we think that FANG is the better choice right now.
Analyst’s Disclosure: I/we have no stock, option or similar derivative position in any of the companies mentioned, but may initiate a beneficial Long position through a purchase of the stock, or the purchase of call options or similar derivatives in FANG over the next 72 hours. I wrote this article myself, and it expresses my own opinions. I am not receiving compensation for it (other than from Seeking Alpha). I have no business relationship with any company whose stock is mentioned in this article.
Seeking Alpha’s Disclosure: Past performance is no guarantee of future results. No recommendation or advice is being given as to whether any investment is suitable for a particular investor. Any views or opinions expressed above may not reflect those of Seeking Alpha as a whole. Seeking Alpha is not a licensed securities dealer, broker or US investment adviser or investment bank. Our analysts are third party authors that include both professional investors and individual investors who may not be licensed or certified by any institute or regulatory body.
If you want access to our Portfolios that have crushed the market since inception and all our current Top Picks, join us for a 2-week free trial at High Yield Investor.
We are the fastest growing high yield-seeking investment service on Seeking Alpha with a perfect 5/5 rating from 180 reviews.
Our members are profiting from our high-yielding strategies, and you can join them today at our lowest rate ever offered. You won’t be charged a penny during the free trial, so you have nothing to lose and everything to gain.
Start Your 2-Week Free Trial Today!

