Summary:
- Boeing stock shows strong bullish technical signals despite recent financial struggles, making it a buy recommendation.
- The stock has broken out of a downtrend, with key support levels indicating potential for recovery.
- Moving averages and indicators like MACD, RSI, and Stochastics confirm near-term and long-term bullish momentum.
- Despite modest overvaluation and poor financials, Boeing’s large order backlog offers future stability, justifying a buy rating.
Ryan Fletcher
Thesis
After dropping over 30% in the last year and many safety controversies in recent years, The Boeing Company (NYSE:BA) stock may finally have some clearer skies ahead. In the below technical analysis, I determine that there are both strong bullish signals in the nearer term as well as signs of longer term strength in the stock. For the fundamentals, with still disappointing financial results, I find that the stock is still modestly overvalued when looking at its valuation multiples. That said, they do have a long backlog of orders that should give investors some peace of mind that the future is not too uncertain. In terms of macro factors and risks, the main risk is that Chinese competition is very near to coming to market and could potentially take market share away from Boeing and Airbus in the coming years. However, a decrease in oil prices under Trump 2.0 could be a tailwind in the next few years as his “Drill, Baby, Drill” policies will likely increase the volume of oil and help expand margins for airlines. This could potentially increase orders for Boeing. Nonetheless, in my view, the highly bullish technicals outweigh the slight overvaluation of the stock and therefore Boeing currently deserves a buy rating.
Technicals
Charting

Yahoo Finance
Trends
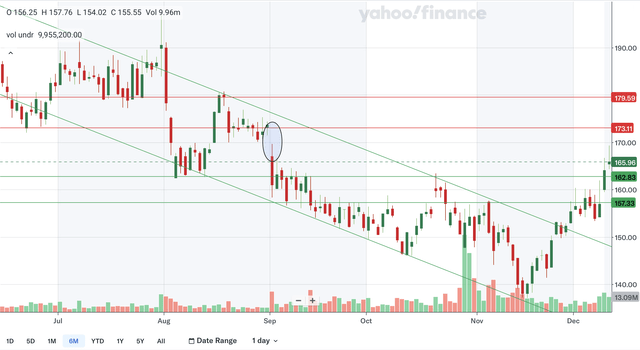
Very late last month, Boeing stock broke out of a downward channel that has been in effect since August. Therefore, the stock is no longer is a downtrend and is finally showing signs of life. The two former channel lines are now support but their relevance is quickly decreasing as they slope out of range.
Support Levels
Other than the two channel lines discussed above, there are two other sources of support. The first is in the low 160s as that level was strong support in August and resistance in September and October, making it clearly a significant level. The other support area is in the mid-to-high 150s as this zone was support in early September, but was resistance in the second half of that month, October, and in early November.
Resistance Levels
There are two resistance areas above the stock currently. The first is the nearest major unfilled downside gap. It is in the low 170s and could become increasingly relevant as the stock continues to retrace the downward move. The other resistance level is at around 180. This round number seems to be a psychologically important area as it was strong support in July but was later resistance in August.
Takeaway
In my view, Boeing’s chart has turned from heavily bearish to now net neutral as it is no longer in a downtrend but has both strong resistance and support levels. This chart conveys that while the bleeding seems to have stopped, it is still uncertain if the stock will make a quick recovery.
Moving Averages

Yahoo Finance
Simple Moving Average (SMA)
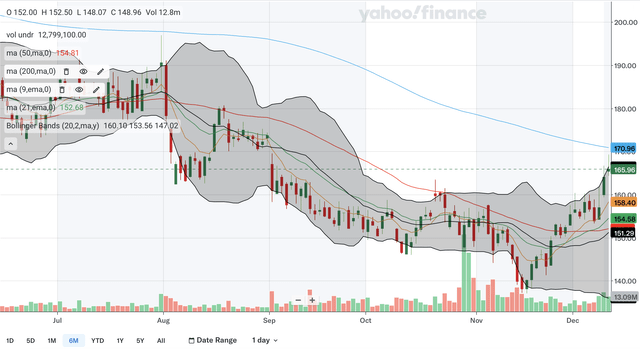
The 50 day SMA and the 200 day SMA has not had any crossovers in the last six months with the 50 day SMA clearly below the 200 day SMA by a wide margin, indicating sustained bearishness in the stock. However, the gap between the SMAs currently seems to be closing by a modest amount, showing that there is receding bearish momentum in the nearer term.
Exponential Moving Average (EMA)
The 9 day EMA crossed above the 21 day EMA in late November, a signal of near term bullishness in the stock. The gap between the EMAs also seems to be expanding showing accelerating bullish momentum. This gap is likely to continue to widen quickly as the stock is trading a significant amount above the 9 day EMA.
Bollinger Bands
The stock is currently right at the upper band showing that it could be potentially overbought and could experience a healthy pullback. The stock broke above the 20 day midline late last month confirming that the stock has exited the downtrend. This midline could act as support moving forward if the stock develops an uptrend.
Takeaway
Overall, I would say that there are key signs of strength in all of these MAs showing that the technical outlook for Boeing has turned net positive. The SMAs show that there is long term strengthening, the EMAs show that bullishness is strong in the near term, and the Bollinger Bands confirm that the near term bottom is likely in.
Indicators

Yahoo Finance
Moving Average Convergence Divergence (MACD)
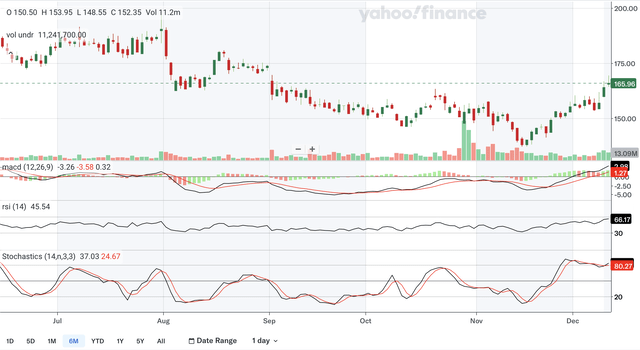
The MACD had a bullish crossover with the signal line last month. After the gap between the lines closed for a bit it is now expanding once more as shown by the now bullish histogram. This shows that there is renewed bullishness in the stock. The MACD also displays positive divergence at the recent trough. While the stock tumbled to a major low in November, the MACD held above levels seen in September, an indication of longer term strength in the stock.
Relative Strength Index (RSI)
The RSI is currently at 66.17 and seems to be at the highest level in the past six months showing that the latest rally is likely much more than a bear bounce. The RSI reclaimed the 50 level in late November as the bulls gained control of the stock. Despite the stock still being below levels seen during the middle of the year, the current high RSI reading shows there is strength building for the long term.
Stochastics
The %K refused to truly cross below the %D recently, and is a sign of resilient bulls. The stochastics also refused to drop below the 80 zone, showing that there is still strong bullish momentum in the stock. Like in the RSI, this 6 month high reading confirms that the latest rally in the stock could be the start of a major trend reversal.
Takeaway
In my view, the indicators are overwhelmingly bullish for the stock and show a strong technical outlook. There are both immediate signs of bullishness and long term signals of strength that should give both traders and longer term investors confidence in the stock.
Fundamentals
Earnings

Boeing reported their 2024 Q3 earnings in late October and showed quite ugly financial results overall. They reported revenues of $17.840 billion, a minor decrease YoY from $18.104 billion in the prior year period. GAAP net loss per share also worsened from $2.70 to now $9.97. Both revenue and EPS missed expectations with revenues missing by $102.78 million and GAAP EPS missing by $2.01. As you can see in the chart above, revenue growth is still below average compared to the past few years but does have some signs of bottoming. For EPS, losses have widened since the start of the year and the latest quarter represents a steep worsening in that trend. On the brighter side, Boeing did state that they still have a total company backlog of $511 billion, including more than 5,400 commercial planes showing that the future may not be as uncertain as one might think. At the moment, Boeing’s margins are also worrying, however, as operating margins have declined from -4.5% to -32.3% YoY while non-GAAP core operating margins have dropped from -6% to now -33.6%. While the future is a bit brighter with such a strong backlog of orders, I believe Boeing’s financials in the immediate term should be a cause of concern for prospective investors.
Risks & Macro Factors
For the commercial airplane industry in general, one could expect competition to stiffen in upcoming years as Chinese manufacturers are aiming to launch cheaper comparable aircrafts. While it will take time for such aircrafts to build reputation and gain market share beyond China, this is still a potential risk for Boeing in the longer term. Previously, main competition was only with Airbus but now a new challenger could change this duopoly landscape significantly.
Another fundamental factor that could affect Boeing could be the price of oil. With Trump 2.0 coming up in the near future, many believe that the price of oil could fall substantially. Trump’s “Drill, Baby, Drill” policies are likely to expand the volume of oil available. This should boost the airline business as their margins are likely to expand due to this lower cost of oil. This will in turn likely lead to more orders for Boeing and be a tailwind for the business for the foreseeable future.
Valuation

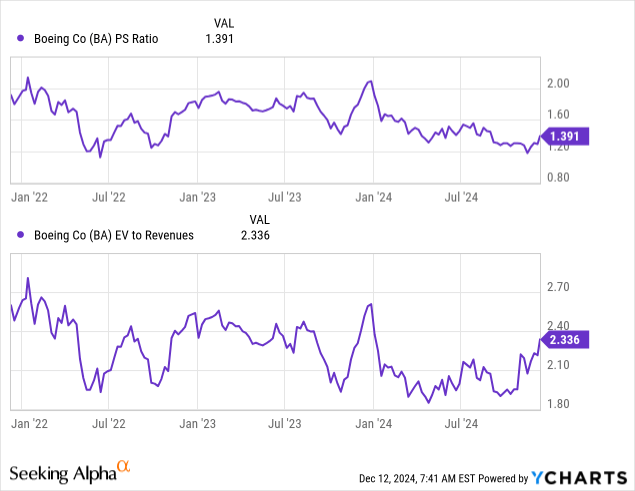
The P/S ratio is still quite near three year lows but the EV/S ratio has rebounded significantly from its three year low seen just earlier this year. The P/S ratio is currently at 1.391 after rebounding from 1.2 recently while the P/B ratio is currently at 2.336 after nearing 1.8 in the first half of the year. I would say that the P/S ratio accurately reflects Boeing’s financial standing while the EV/S ratio seems to be at an unjustifiably high level. With revenue growth being below average, I believe the above average level in the EV/S ratio is an overreaction to the slight improvement in revenue growth QoQ. The P/S ratio is still below its three year average and so it is much more fair. In addition, the current EV/S level is even harder to justify given that net losses are still widening at this juncture. With the P/S being reasonable but the EV/S being overly strong, I conclude that Boeing stock is modestly overvalued at current levels. Fundamentally, the stock doesn’t seem like a bargain yet to me.
Conclusion
The technicals are very bullish for Boeing stock. While the chart was net neutral in its outlook, the strength in the moving averages and bullish signals in the indicators heavily put the edge in the bulls’ favour. There are also longer term confirmations of strength in the indicators that should give investors with a longer investment horizon some peace of mind. For the fundamentals, as discussed above, I believe the stock is still mildly overvalued at current levels since the sluggish revenue growth and worsening EPS make the EV/S ratio seem overly high at the moment. As stated above, the large backlog should help to stabilize their financials over time and investors should find some relief from that. There is also a balance of tailwinds and headwinds with Chinese competition being a risk but Trump 2.0 being a catalyst for Boeing’s business. Overall, I believe the highly bullish technicals currently outweigh the slight overvaluation and so I initiate Boeing stock at a buy rating.
Analyst’s Disclosure: I/we have no stock, option or similar derivative position in any of the companies mentioned, and no plans to initiate any such positions within the next 72 hours. I wrote this article myself, and it expresses my own opinions. I am not receiving compensation for it (other than from Seeking Alpha). I have no business relationship with any company whose stock is mentioned in this article.
Seeking Alpha’s Disclosure: Past performance is no guarantee of future results. No recommendation or advice is being given as to whether any investment is suitable for a particular investor. Any views or opinions expressed above may not reflect those of Seeking Alpha as a whole. Seeking Alpha is not a licensed securities dealer, broker or US investment adviser or investment bank. Our analysts are third party authors that include both professional investors and individual investors who may not be licensed or certified by any institute or regulatory body.
