Summary:
- Stellantis N.V. is a deep-value buy despite a poor year, while Tesla, Inc. is extremely overvalued and due for a price correction in 2025.
- Both companies have similar gross profit margins and EPS forecasts, yet Tesla’s stock quote is 36x higher, indicative of irrational market pricing.
- Stellantis offers substantial value on cash reserves vs. debt, net assets, sizable cash flow generation, and a high dividend yield, making it a safer investment compared to Tesla’s overinflated setup.
- I rate Stellantis a Buy at $13 for a 12-month outlook, and reiterate a Sell/Avoid rating for Tesla due to overvaluation concerns.
DNY59
This may come as a shocker to newbie investors chasing the rapidly rising Tesla, Inc. (NASDAQ:TSLA) stock quote in late 2024, but another carmaker is providing a smarter long-term buy proposition. And, nobody wants to own it. European-based Stellantis N.V. (NYSE:STLA) is now positioned as a deep-value buy, after a rotten year for share performance. (Yes, both stocks use the same four letters for a trading symbol, with the first two switched.)
YCharts – Stellantis vs. Tesla, 1-Year Total Returns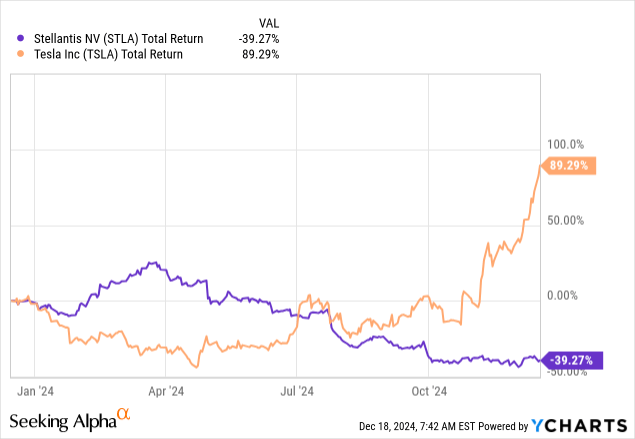
Selling/avoiding Tesla in favor of buying Stellantis is really a contrarian play, where one has gotten too popular and overheated for investor sentiment, while the other has swung into the arctic cold region. In a reversion-to-the-mean move, both should bounce back toward a normalized price and valuation in 2025. Under this scenario, Tesla should decline markedly in price, while Stellantis rebounds materially next year.
Where “first-buddy” Elon Musk has cozied up with President-elect Trump (donating over $200 million of his own wealth to Trump’s political campaign), with investors believing all sorts of government benefits are coming Tesla’s way, Stellantis has been struggling with sales at its U.S. brands of Jeep, Chrysler, and Dodge. Perhaps investors should question the outlooks for both organizations, with a more reasonable grain of salt.
When you think about it, Stellantis and Tesla are now valued by Wall Street on polar opposite sides of the spectrum. To me, the two divergent setups might become a great example (history lesson) chapter in college economics textbooks years from now, regarding how the stock market can price separate businesses quite irrationally. If you believe in the “efficient market theory,” where stocks are always fairly priced, you might want to quit reading my article at this point.
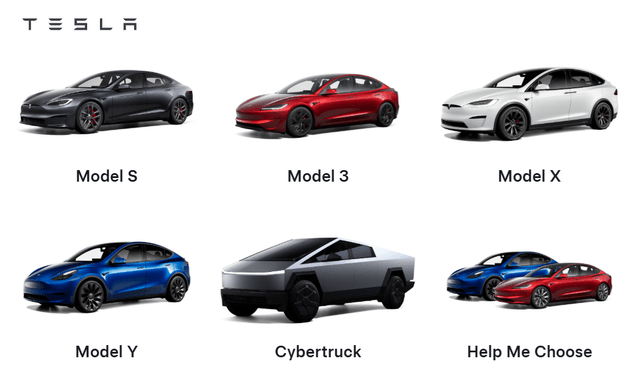
Stellantis Website – Car Brands Produced, December 18th, 2024 Tesla Website – EV Autos Produced, December 18th, 2024
Unreasonable Valuations in Both
For starters, I prefer to stick with the math for owning a business when I am considering a stock for purchase. I disregard mainstream investor sentiment, analyst forecasts, and news media stories of the day. I want to know exactly where a company stands for net assets, cash generation, margins, etc. and how does this stand-up historically vs. past operating experience. Next, what kind of valuation on fundamentals has existed over time. Doing so helps to eliminate decision-making mistakes chasing a stock investment when a move is largely over, either up or down, in price trend.
How irrational has pricing become in these two major auto competitors in Europe and America? Answer: they are about as far apart as I have seen in any industry between two established brand leaders, over 38 years of trading in my personal account.
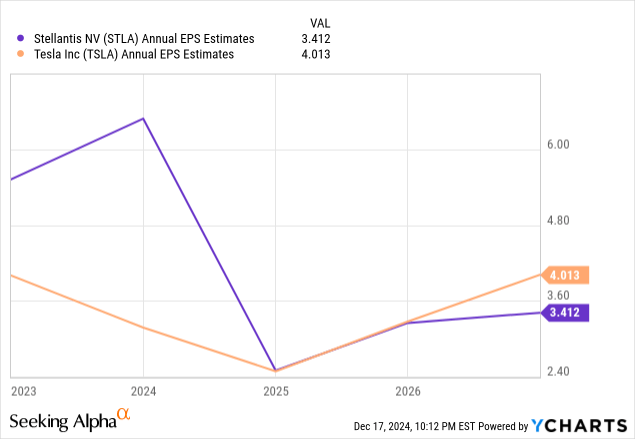
Let’s review some basic operating ideas first. Astonishingly, gross profit margins around 18% are nearly identical from Stellantis and Tesla, as the total cost associated with designing, engineering, and producing cars is not dramatically different for each automaker (especially considering the extensive labor effort and need for customized parts inherent in the business model). The 2025–26 forecasts for EPS are also remarkably similar. You heard me right, despite one company with a stock quote of $480 and the other at $13, new investors are getting roughly mirror underlying income results on their investment!
YCharts – Stellantis vs. Tesla, Gross Profit Margins, 3 Years YCharts – Stellantis vs. Tesla, EPS Past & Estimated Future, 2023-26 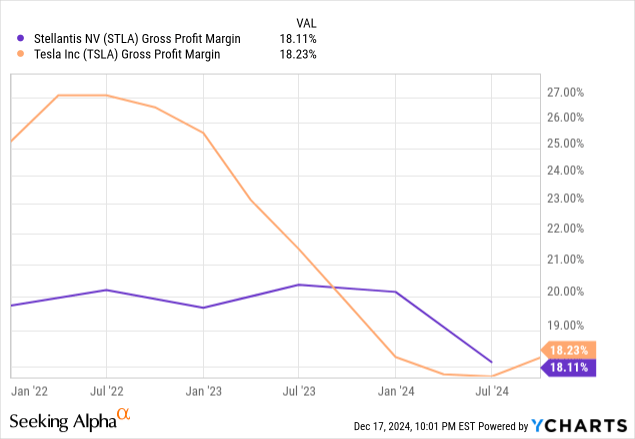
If you want a clear definition of what a bubble in stock pricing looks like, one terrific example is the change in Tesla’s stock quote/valuation vs. Stellantis. Sure, “sales” of revolutionary electric vehicles at Tesla have gone through the roof, and the potential for massive profits does exist in the future (although it may be less probable than Wall Street believes as industry-wide EV competition is set to mushroom during 2025-26, including Stellantis offerings). Yet, if dramatically higher “earnings” after 2026 fail to materialize, do TSLA shares deserve the price gains from 2019 (previously at a par price with Stellantis in the $15-20 range)?
YCharts – Stellantis vs. Tesla, Share Price, Since 2019, Recession Shaded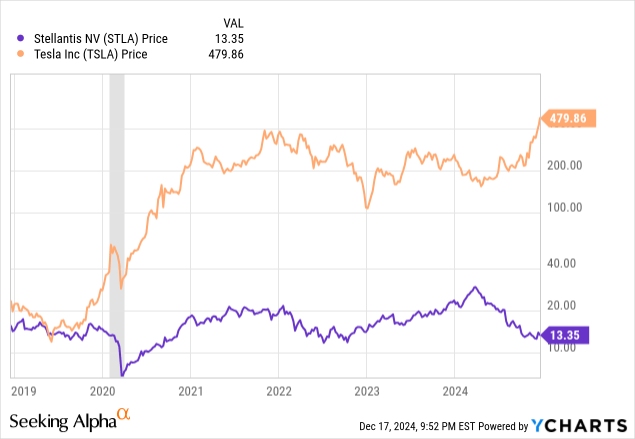
On share price to fundamental earnings, Stellantis is going for 2.8x trailing 12-month results, with a downbeat income forecast bringing a 5.3x estimate for 2024 and early 2025 numbers. These ratios are some of the cheapest you can find currently on Wall Street from any leading blue-chip corporation.
Tesla’s situation looks entirely different for investors. With the post-election spike in price, P/Es are in the 131x to 193x range (trailing vs. immediate future). This Big Tech boomer remains one of the most expensive in all New York trading for a company with massive size. The spread difference between the two on income generation is Tesla’s stock is valued at a magnitude of 30x to 40x the current Stellantis setup.
YCharts – Stellantis vs. Tesla, P/E Ratio Analysis, 3 Years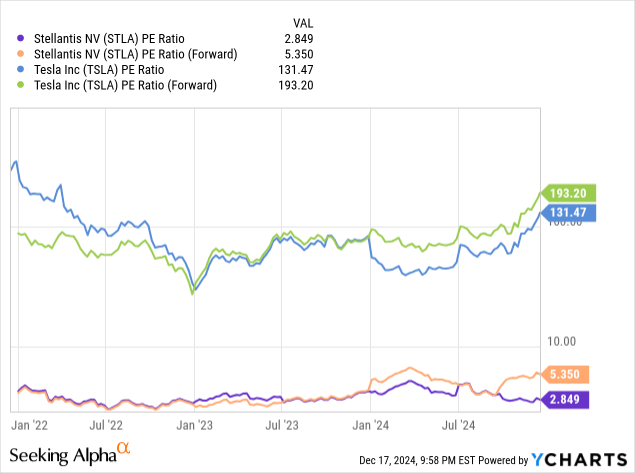
Price to sales ratios also appear to show Stellantis is dramatically undervalued vs. Tesla. The 0.237x ratio on forward projected operating revenue is a 98.5% discount to Tesla’s 15.44x estimate (65x spread ratio between the two).
YCharts – Stellantis vs. Tesla, Price to Sales Ratio Analysis, 3 Years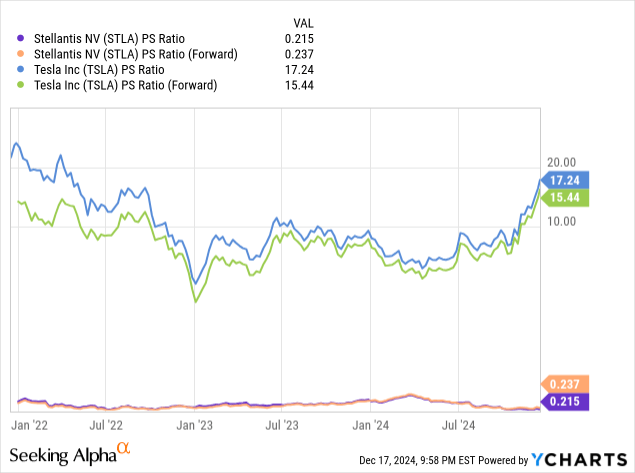
What about net book values and tangible asset calculations? Again, on share pricing to cost/depreciation accounting of all assets, minus known liabilities, Stellantis sits at a massive discount to Tesla. STLA’s price to book value multiple of 0.45x and tangible book value ratio of 1.3x are valued at 98% and 94% discounts respectively to Tesla.
YCharts – Stellantis vs. Tesla, Price to Book Value Analysis, 3 Years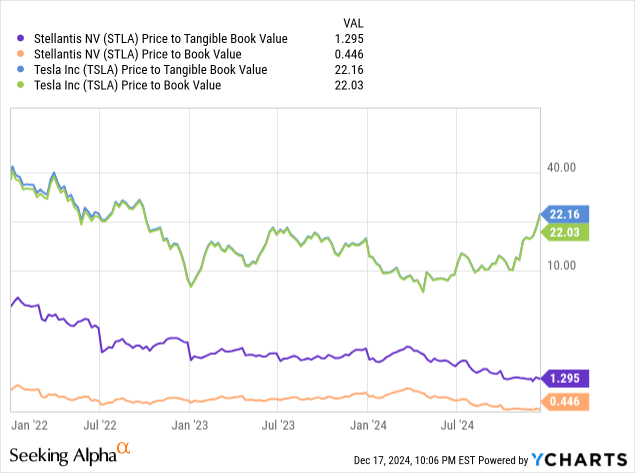
Enterprise Valuation Disconnect
Yet, the valuation math gets even more attractive for Stellantis. The company holds $40 billion in cash vs. $34.5 billion in financial debt, effectively reducing the take private, zeroed-out debt value to $33 billion (from $38.5 billion in equity market value alone). This even-lower enterprise value number highlights an ever-greater undervaluation setup for STLA vs. TSLA. In comparison, Tesla’s $33 billion cash pile does little to drop the take-private worth of the company, with an equity market capitalization already above $1.5 trillion.
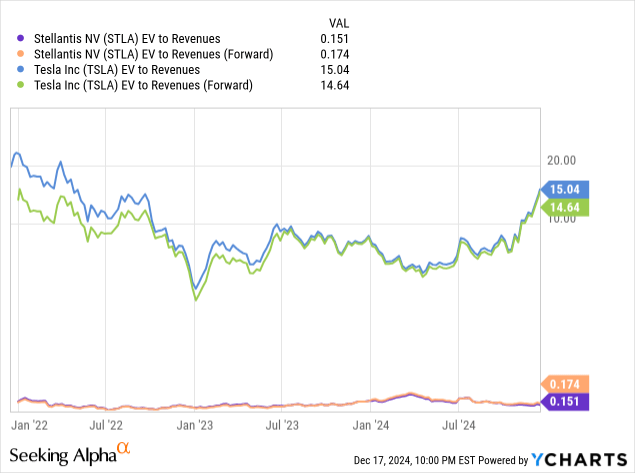
On EV (enterprise value) to EBITDA and revenues, an up to 100x spread difference between the two now exists. In mathematical terms for these enterprise valuation ideas, Tesla is 9,000% more expensive than Stellantis for a spread, while STLA can be considered 99% cheaper than Tesla!
YCharts – Stellantis vs. Tesla, EV to EBITDA Analysis, 3 Years YCharts – Stellantis vs. Tesla, EV to Revenue Analysis, 3 Years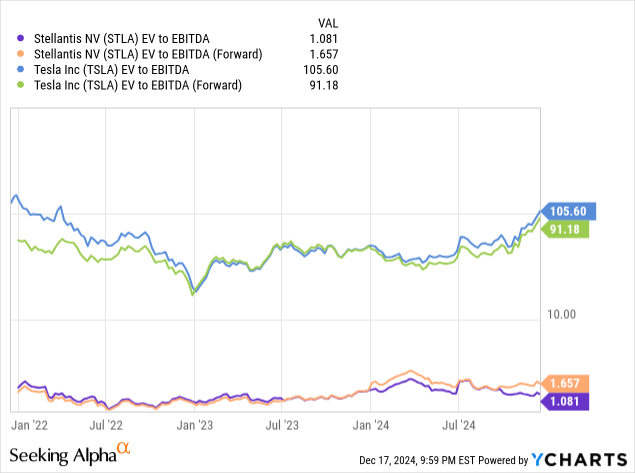
Seeking Alpha Quant Valuation
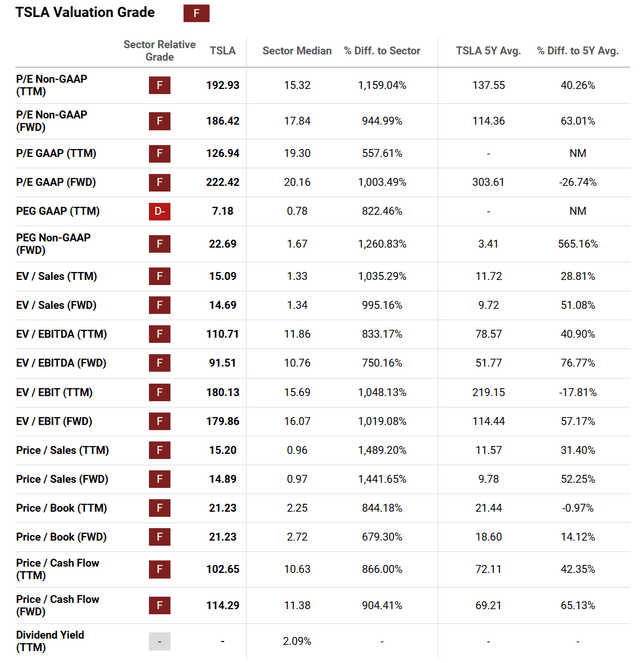
The best summary comparisons for valuations between the two, found on the internet, may be provided by Seeking Alpha itself. The Quant Valuation Grade is generated by reviewing a number of fundamental operating business metrics matched against stock quotes, over the latest 5-year period and peers/competitors in the same industry today.
In terms of polar opposites, the quant-derived (unemotional computer database) differences are stunning. Measured against sector median ratios, Stellantis is consistently valued at 70% to 80% discounts below industry norms today, while Tesla is closer to 1,000% premiums! Night and day, really.
SA’s current valuation score for Stellantis is “A+” as a Quant Grade, while Tesla’s is “F,” which could be quite generous.
Seeking Alpha Table – Stellantis, Quant Valuation Grade, December 17th, 2024 Seeking Alpha Table – Tesla, Quant Valuation Grade, December 17th, 2024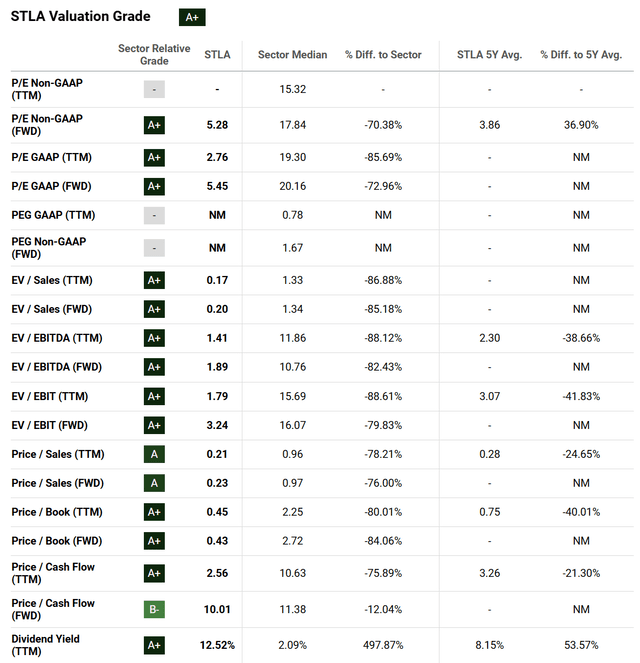
Underlying Trading Characteristics In Flux?
Why am I writing this article today? My main interest in buying Stellantis has to do with a change in underlying trading patterns over the last couple of months. Momentum indicators have been shifting from overwhelming bearish readings to much more constructive prints. Conversely, Tesla’s monster jump since the election is getting way overbought on the upside.
For STLA, selling pressure may have peaked in August-September. On the 12-month chart below, you can see price is now trying to move above its 50-day moving average (blue line), after staying well below it since April.
The Negative Volume Index reading (highlighting what buyers/sellers are doing on lower volume, less newsworthy days), has actually spiked in a positive direction for weeks, following a bottom in September. On Balance Volume has been rising since early August, as the accumulation of shares on high-volume days picks up steam.
Perhaps just as bullish, the 14-day Average Directional Line (a record of volatility in one direction or the other over the past roughly 3 weeks of trading) is now signally a relatively low conviction level by sellers. Circled in gold, the current 13 number is the lowest since July 2023, and could indicate selling has been exhausted.
StockCharts.com – Stellantis, 12 Months of Daily Price & Volume Changes, Author Reference Point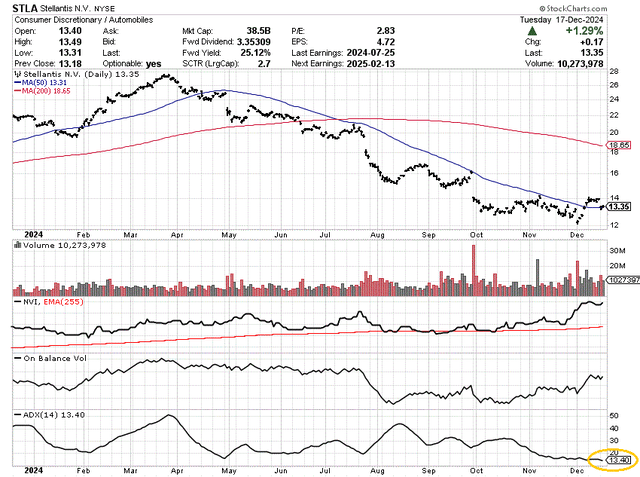
In many respects, Tesla is showing a complete contrast in technical conditions. NVI has been in a severe downtrend since February, indicating significant selling on low-volume days, and OBV has not made much progress since July, despite a rough double in the share quote.
In addition, the 14-day ADX reading is sky-high at 54 (circled in gold), meaning a reversal in trend from overbought territory may be increasingly likely. My thinking is the Trump election euphoria is about to fade, as investors realize the expected elimination of direct consumer tax breaks for purchasing electric vehicles is about to hit Tesla sales.
StockCharts.com – Tesla, 12 Months of Daily Price & Volume Changes, Author Reference Point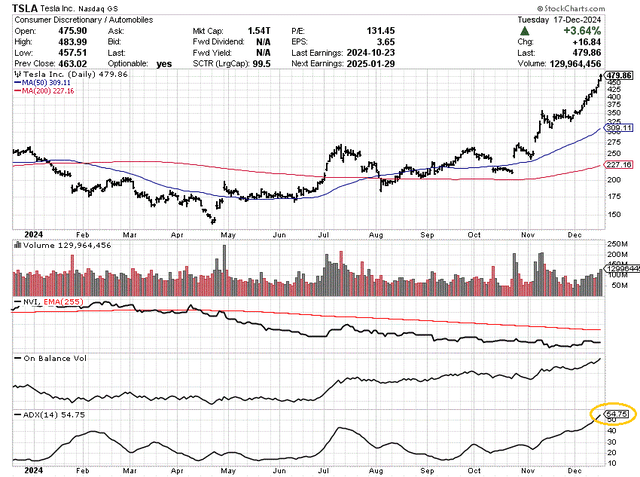
Final Thoughts
I know Tesla is more than just an EV car company, with business units focused on changing mankind’s future (solar panels, AI startups, robotics, electric charging, batteries). Yet, new auto sales represented roughly 80% of Q3 2024 revenue, down slightly from the year ago number of 84%. Do these ventures translate into a company worth 30x to 100x an alternative auto business with a stable, albeit slower-growth future?
That’s a question you have to answer yourself if you own Tesla shares. My personal view is the overvaluation of TSLA at $480 in December 2025 is borderline not justifiable under any futuristic economic outlook (brought back to the real world). In all likelihood, the stock’s $1.5+ trillion equity market cap has fully discounted incredibly rosy operating/growth scenarios for Mr. Musk and Tesla at least 5–10 years down the road.
On the contrary, Stellantis NV’s meager $38 billion market cap is absolutely worth a look, even if a recession is next for the world (perhaps on Trump tariff/trade war actions). You do get plant & equipment, cash, and auto inventories net of all liabilities of $30 billion ($10 per share vs. the $13 quote). Also, backing up your investment, you do get $10+ billion in earnings and in the neighborhood of $15 billion in cash flow annually, estimated by analysts for 2025. And, you should receive a forward indicated 9% cash return/dividend yield while you wait for a recovery in the share price (vs. no cash distribution from Tesla).
Does the valuation setup and appearance of a reversal in technical trading guarantee an oversized Stellantis gain for investors in 2025? Not really. The downside risk is still based on economic realities and the potential for a recession soon (which I explained in my article last week here). If we do slip into a worsening car sales backdrop overall, STLA may be stuck under $15 over the next 12 months.
Likewise, Tesla could face a decline in demand for EVs, both from a recession and Trump tinkering with the tax code. If we experience both bearish changes in 2025, Tesla’s quote could implode back to $200 or even $100 a share in a deep recession scenario. That’s how overvalued vs. underlying supporting math, the equity trading has become in this name.
Over longer-term holding periods of at least 2–3 years, I am very optimistic that Stellantis will outperform Tesla. The possibility of STLA doubling, while Tesla gets cut in half, is quite reasonable. It would simply happen on a reversion-to-the-mean move in both at the same moment.
This is the first time I have covered Stellantis. I am starting the $13 price in December at a Buy rating, for a 12-month outlook. While I do appreciate Tesla’s technology invention push, I still believe the valuation is already discounting years of good news on the operating front. I also reiterate my Tesla Sell/Avoid rating from August here, based on worries over how the stock will fare in a recession.
Thanks for reading. Please consider this article a first step in your due diligence process. Consulting with a registered and experienced investment advisor is recommended before making any trade.
Analyst’s Disclosure: I/we have a beneficial long position in the shares of STLA either through stock ownership, options, or other derivatives. I wrote this article myself, and it expresses my own opinions. I am not receiving compensation for it (other than from Seeking Alpha). I have no business relationship with any company whose stock is mentioned in this article.
This writing is for educational and informational purposes only. All opinions expressed herein are not investment recommendations and are not meant to be relied upon in investment decisions. The author is not acting in an investment advisor capacity and is not a registered investment advisor. The author recommends investors consult a qualified investment advisor before making any trade. Any projections, market outlooks, or estimates herein are forward-looking statements based upon certain assumptions that should not be construed as indicative of actual events that will occur. This article is not an investment research report, but an opinion written at a point in time. The author's opinions expressed herein address only a small cross-section of data related to an investment in securities mentioned. Any analysis presented is based on incomplete information and is limited in scope and accuracy. The information and data in this article are obtained from sources believed to be reliable, but their accuracy and completeness are not guaranteed. The author expressly disclaims all liability for errors and omissions in the service and for the use or interpretation by others of information contained herein. Any and all opinions, estimates, and conclusions are based on the author's best judgment at the time of publication and are subject to change without notice. The author undertakes no obligation to correct, update or revise the information in this document or to otherwise provide any additional materials. Past performance is no guarantee of future returns.
Seeking Alpha’s Disclosure: Past performance is no guarantee of future results. No recommendation or advice is being given as to whether any investment is suitable for a particular investor. Any views or opinions expressed above may not reflect those of Seeking Alpha as a whole. Seeking Alpha is not a licensed securities dealer, broker or US investment adviser or investment bank. Our analysts are third party authors that include both professional investors and individual investors who may not be licensed or certified by any institute or regulatory body.
