
Summary:
- PayPal Holdings, Inc.’s stock has surged by nearly 50% since our latest covered.
- While its fundamental growth has garnered momentum, we foresee global trade challenges.
- PayPal’s commendable growth might suppress as the company matures and competition intensifies. Whether the company’s new management will dribble past such obstacles remains to be seen.
- Our DCF model deems PayPal’s stock overvalued. However, relative price multiples and technical features convey a different story.
- We are cautious and deem the stock a ‘Hold’

nazar_ab/E+ via Getty Images
PayPal Holdings, Inc.’s (NASDAQ:PYPL) stock has enjoyed a stellar year, surging by approximately 40% year-to-date. We last covered the stock in July, stating that PayPal’s headwinds had been priced in. Our analysis reached success as the stock has surged ever since. However, considering the changing macroeconomic and technological environments, we deemed it prudent to update our thesis ahead of the new year.
Without further delay, here’s what we think about PayPal’s stock going into 2025.
Last Time Around and Performance Since
Our previous coverage of PayPal was centered on a preview of its second-quarter results, where we identified slowing active accounts and consumer sentiment headwinds. However, we argued that PayPal would surprise many and that its stock was underpriced.
The company’s stock surged since our coverage, likely due to its reignited fundamental growth. Moreover, financial technology stocks experienced a solid back-end of 2024, likely providing PayPal’s stock with systematic support.

Our Previous Rating (Seeking Alpha)
PayPal’s fundamental attributes are addressed later in the article. However, before we delve into them, I want to outline Wall Street’s price targets. Seeking Alpha’s data shows that, in aggregate, Wall Street analysts have upped their price target on PayPal, communicating why the stock might’ve surged in late 2024.
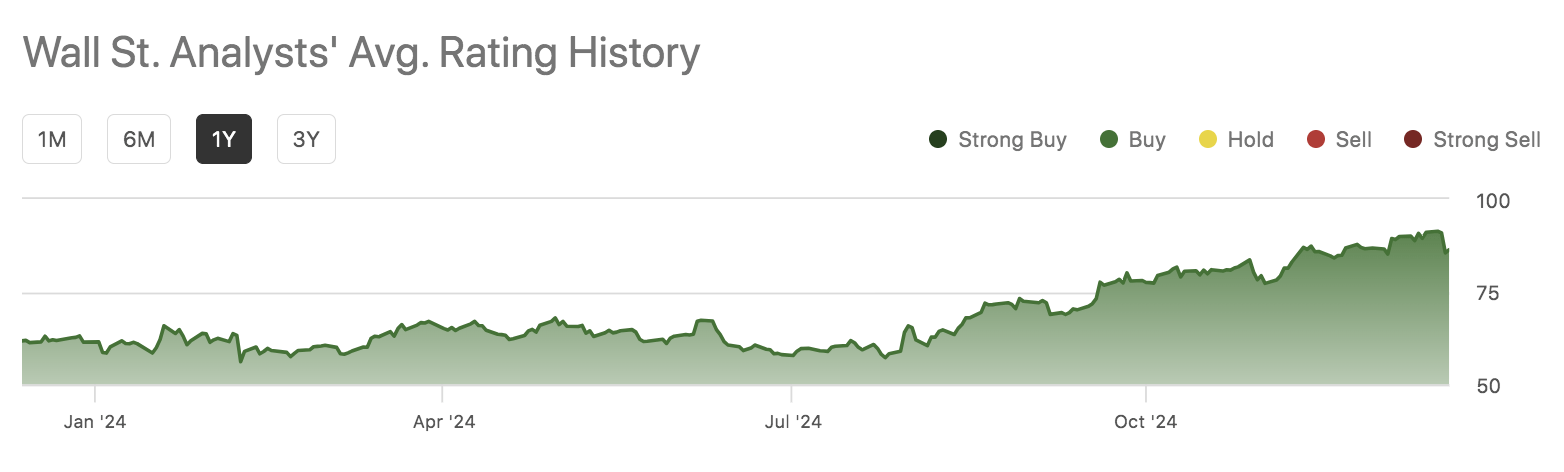
PYPL’s Wall Street Price Target (Seeking Alpha)
Fundamental Review
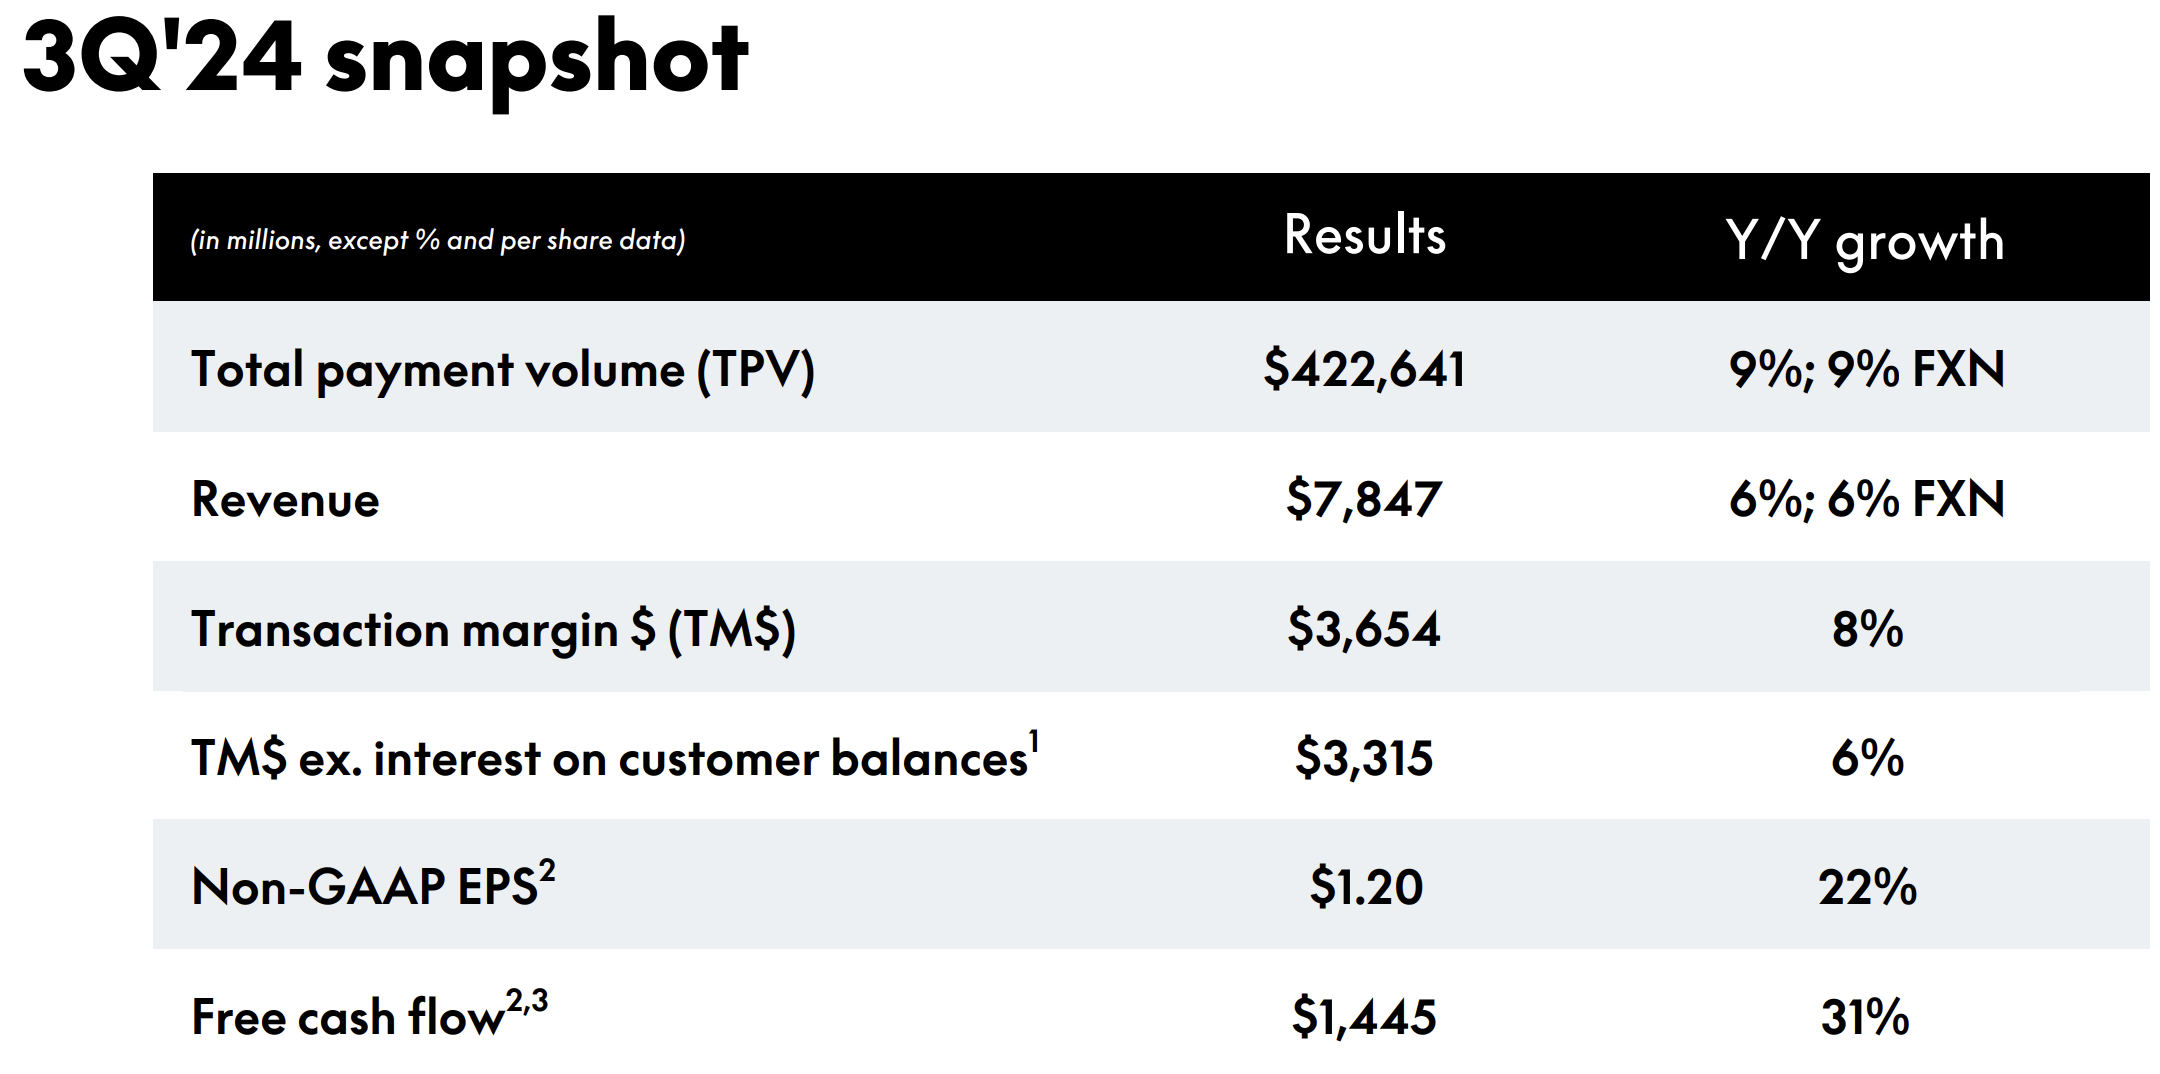
PayPal’s headline metrics communicate solid growth. For example, PayPal’s third-quarter numbers were robust as it achieved 6% in year-over-year revenue growth, well above the U.S. inflation rate (which dipped below 3%). Furthermore, PayPal’s transaction margins increased by 8% year-over-year, indicating lower transaction expenses and fewer credit losses.
PayPal
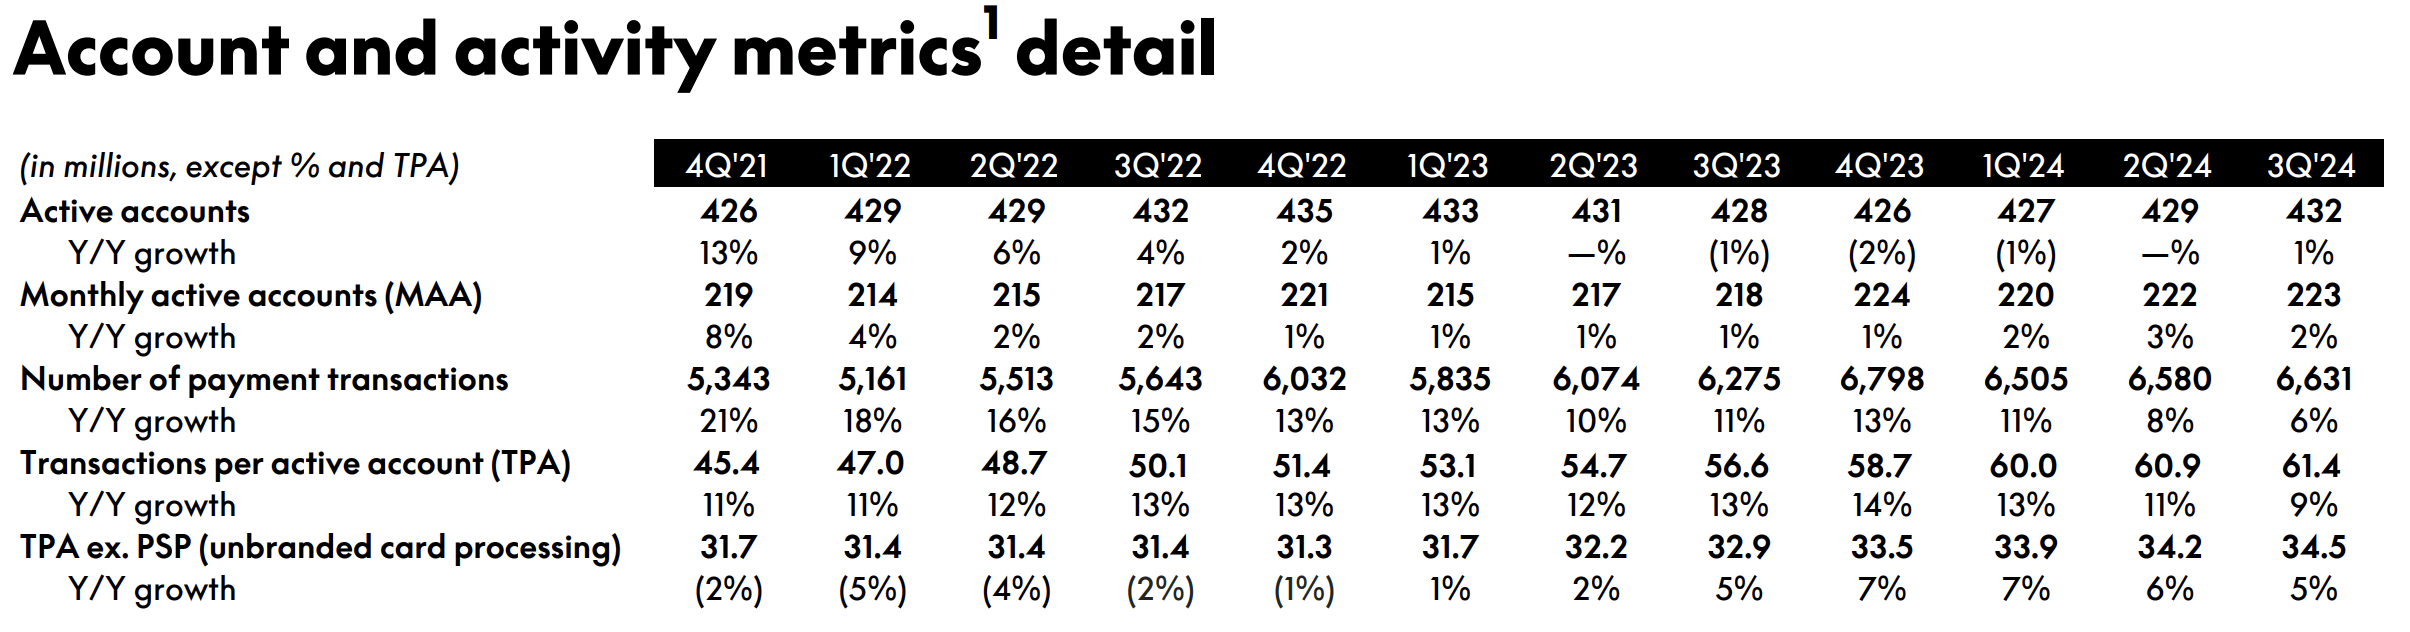
PayPal experienced negative active account growth in 2023 and early 2024. For those unaware, an active account is described as an account, which has transacted. PayPal’s fortunes reverse in Q3, as the company’s active accounts grew by 1% to 432 million. Moreover, PayPal’s number of transactions and transactions per active account increased by 6% and 9% apiece, with the latter showing that few transactional accounts are ‘once off’ accounts.
PayPal
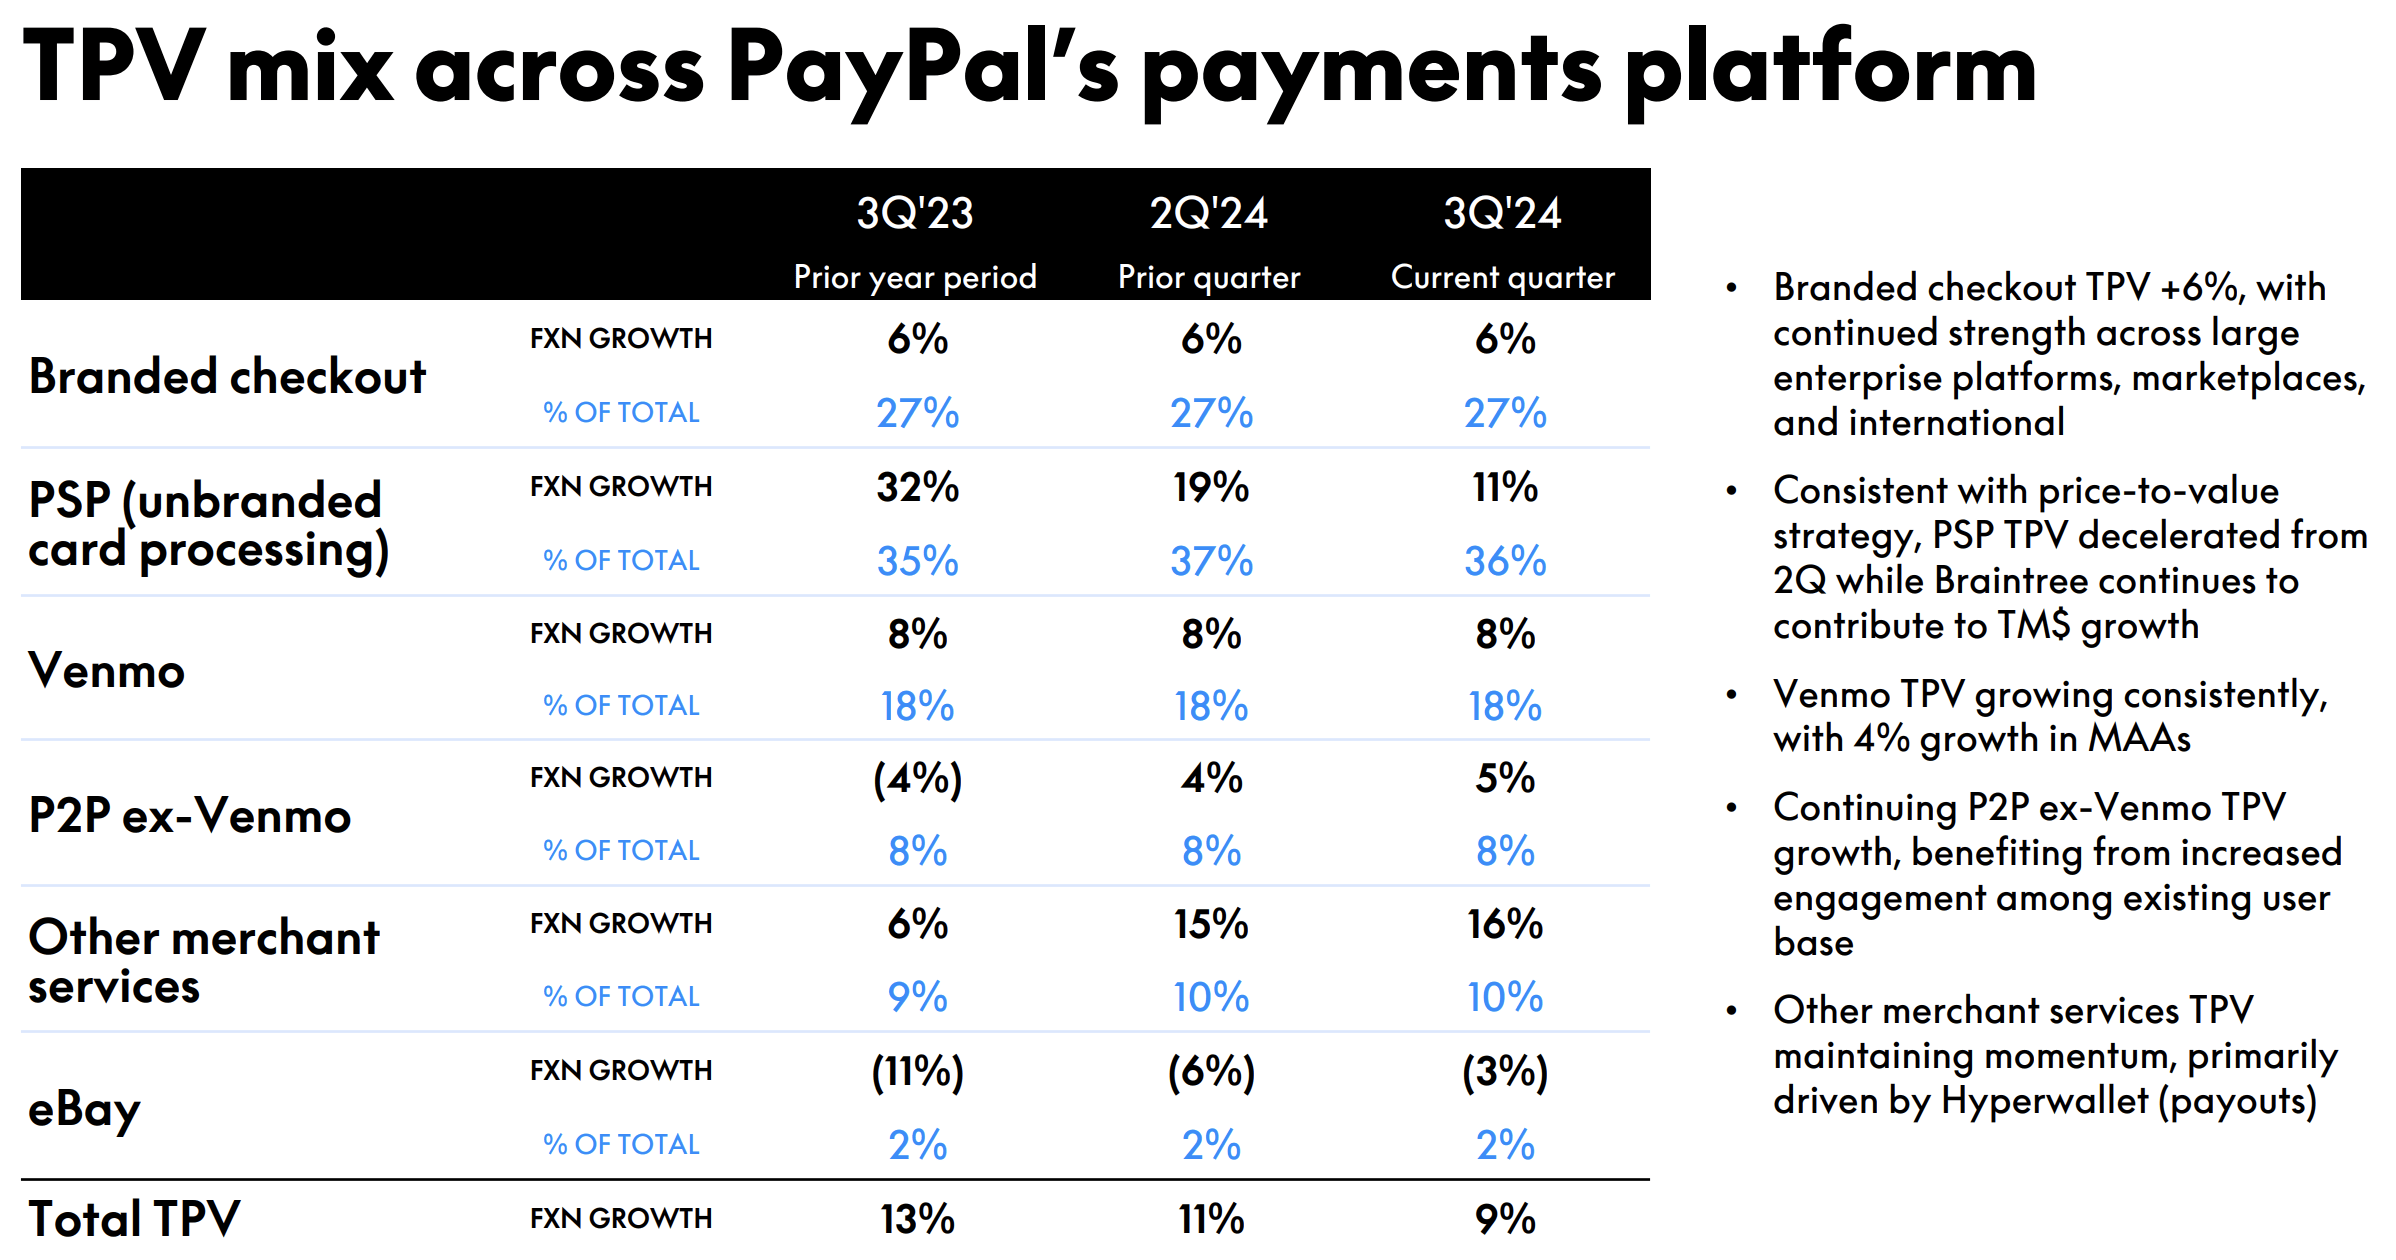
A glance at PayPal’s platform streams show that branded checkouts are in good form, as the segment’s transactions grew an additional 6% in Q3. Branded checkouts allow outlet owners to deploy a PayPal icon in their checkout section, which is evidently driving a significant amount of growth.
Furthermore, PayPal’s unbranded processing stream is surging, adding 11% in FX-neutral growth during Q3. For those unaware, unbranded processing refers to PayPal’s merchant-linked partnerships, whereby it outsources its processing and origination services.
Other merchant services, which includes online and in-person transactions, contributed notably in Q3, growing by 16%. However, eBay and ex-Venmo peer-to-peer (P2P) hasn’t progressed as well as other segments. In fact, eBay (EBAY) transactions remain in negative growth.
PayPal
What do we think will occur from here-on-in?
Let’s start off by looking at PayPal’s trend growth. The following diagram shows that, although PayPal’s TPV (total payment volume) growth is positive, it is slowing exponentially.
In our view, the slowing TPV is due to the company maturing, increased competition, and capacity utilisation. While our take is debatable, one thing is for sure: PayPal’s TPV has reached an inflection point.
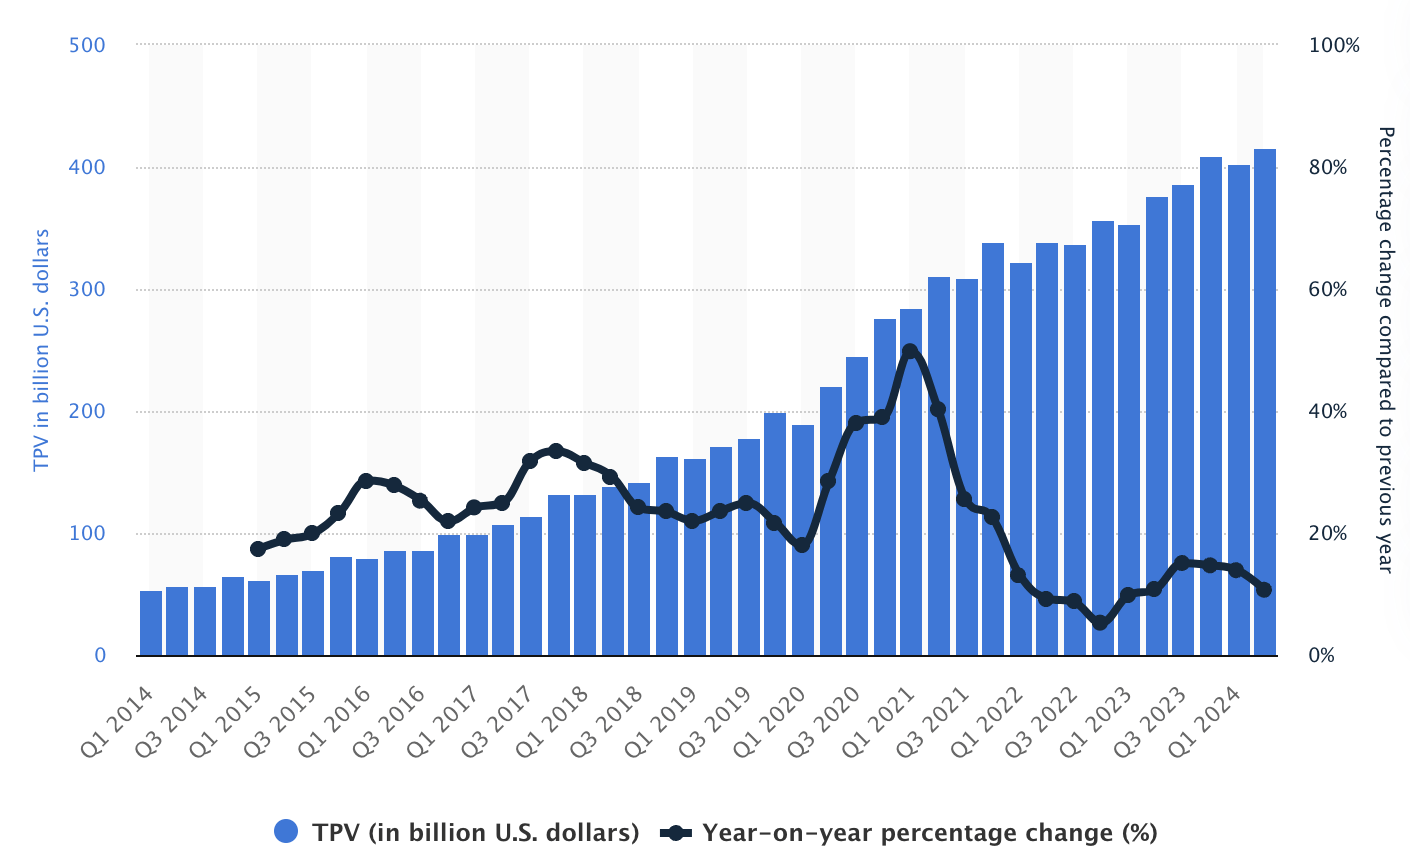
Trend Growth – Doesn’t Include Q3 Results (Statista)
Will PayPal’s TPV re-ignite? We think the company’s market share dictates positive TPV (and new account) growth into the back-end of the 2020s. Moreover, PayPal’s existing user transactions illustrate signs of customer loyalty. Therefore, we believe PayPal’s market share will be difficult to topple.
Despite our positive outlook, we don’t think PayPal’s growth will revert to the figures it experienced pre-2021.
Our basis is twofold:
- We believe the Covid-19 pandemic lockdowns enforced technological innovation, causing other big tech firms and small enterprises alike to enter the digital payments industry.
- The addressable market’s capacity will likely reduce as time passes. While PayPal’s concept was once innovative, digital payments has normalised as an industry, likely reducing the achievable capacity available to each market participant.
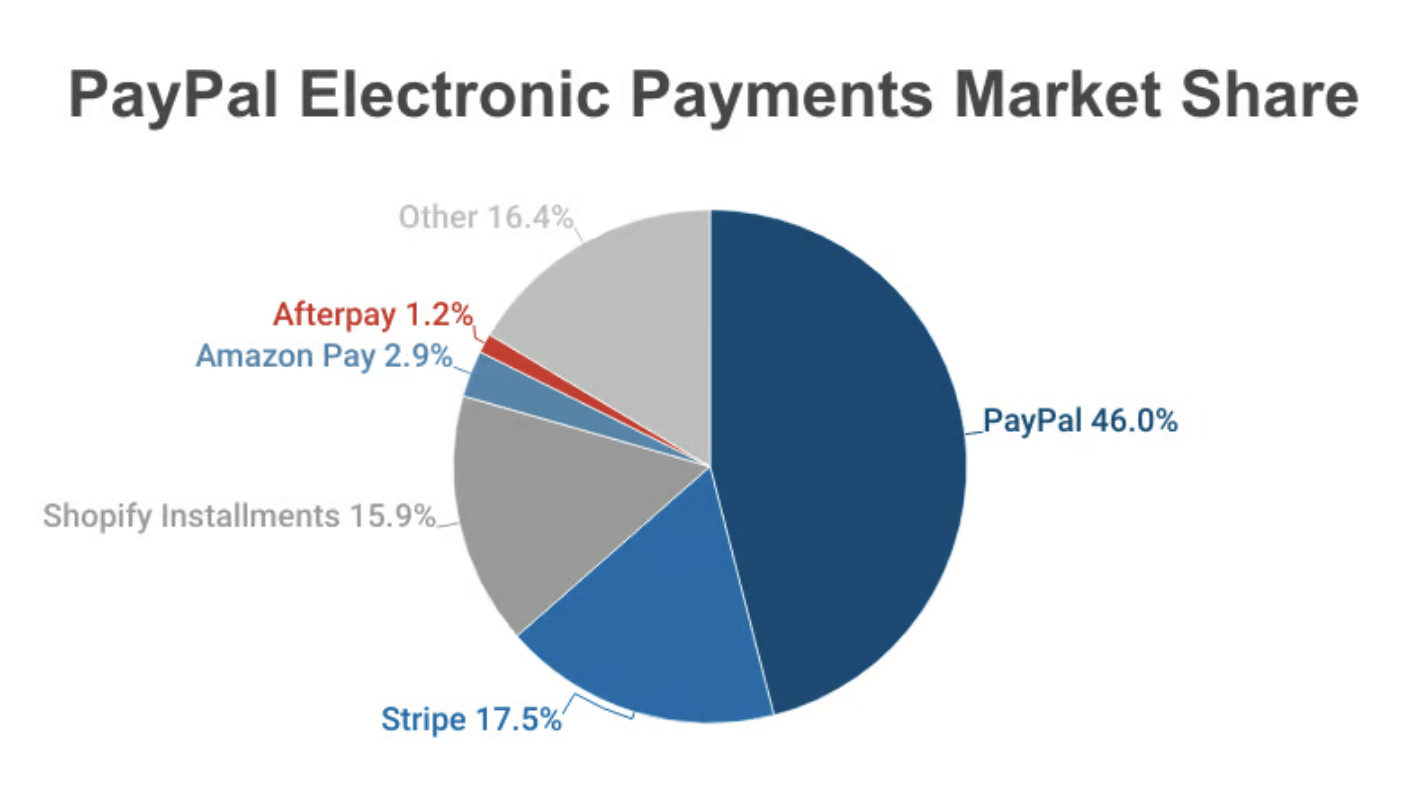
PayPal Market Share (Capital One Shopping)
Furthermore, a look at the economic cycle is required to comment on PayPal’s short-term outlook. While U.S. consumer sentiment has improved, we think President Trump’s proposed tariffs and his restrictive outlook on global trade poses risks. Moreover, re-inflation has occurred in the U.S., meaning the interest rate cut cycle will likely be short-lived.
Will consumers and businesses sustain their confidence when interest rates cuts stop? We don’t think so.
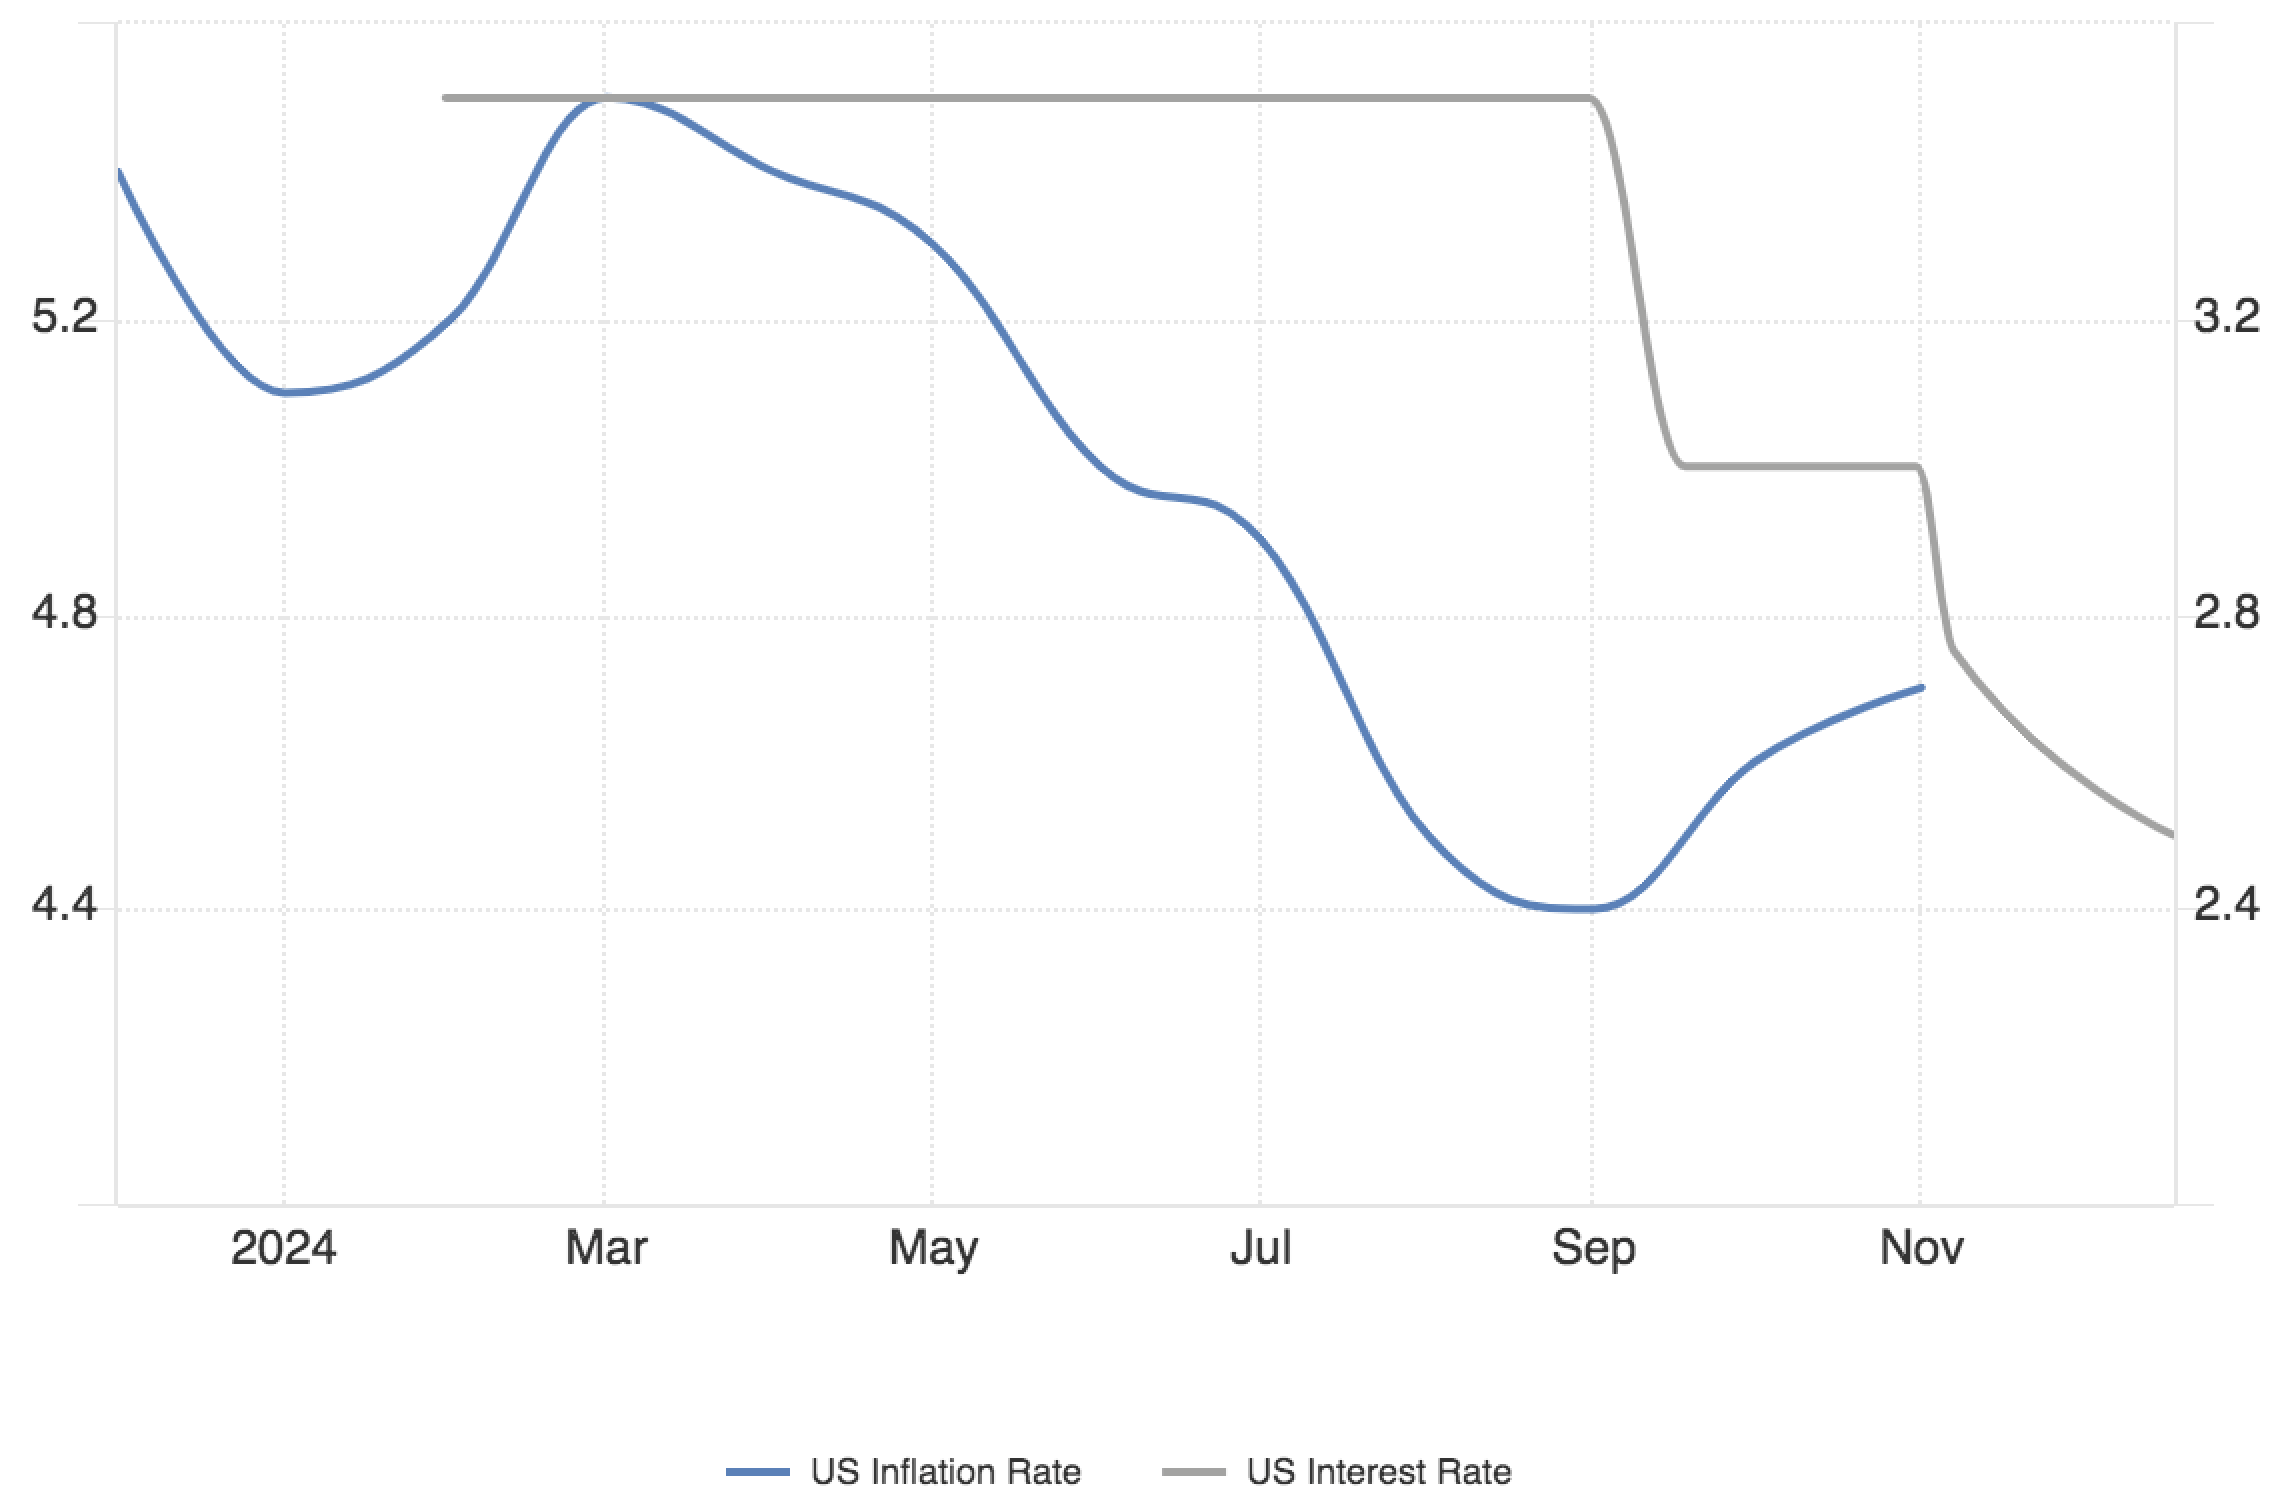
U.S. Inflation and Interest Rates (Trading Economics)
Financials
Income Statement
Let’s get stuck into PayPal’s financials – Below is a snapshot of PayPal’s compact income statement; a discussion follows.
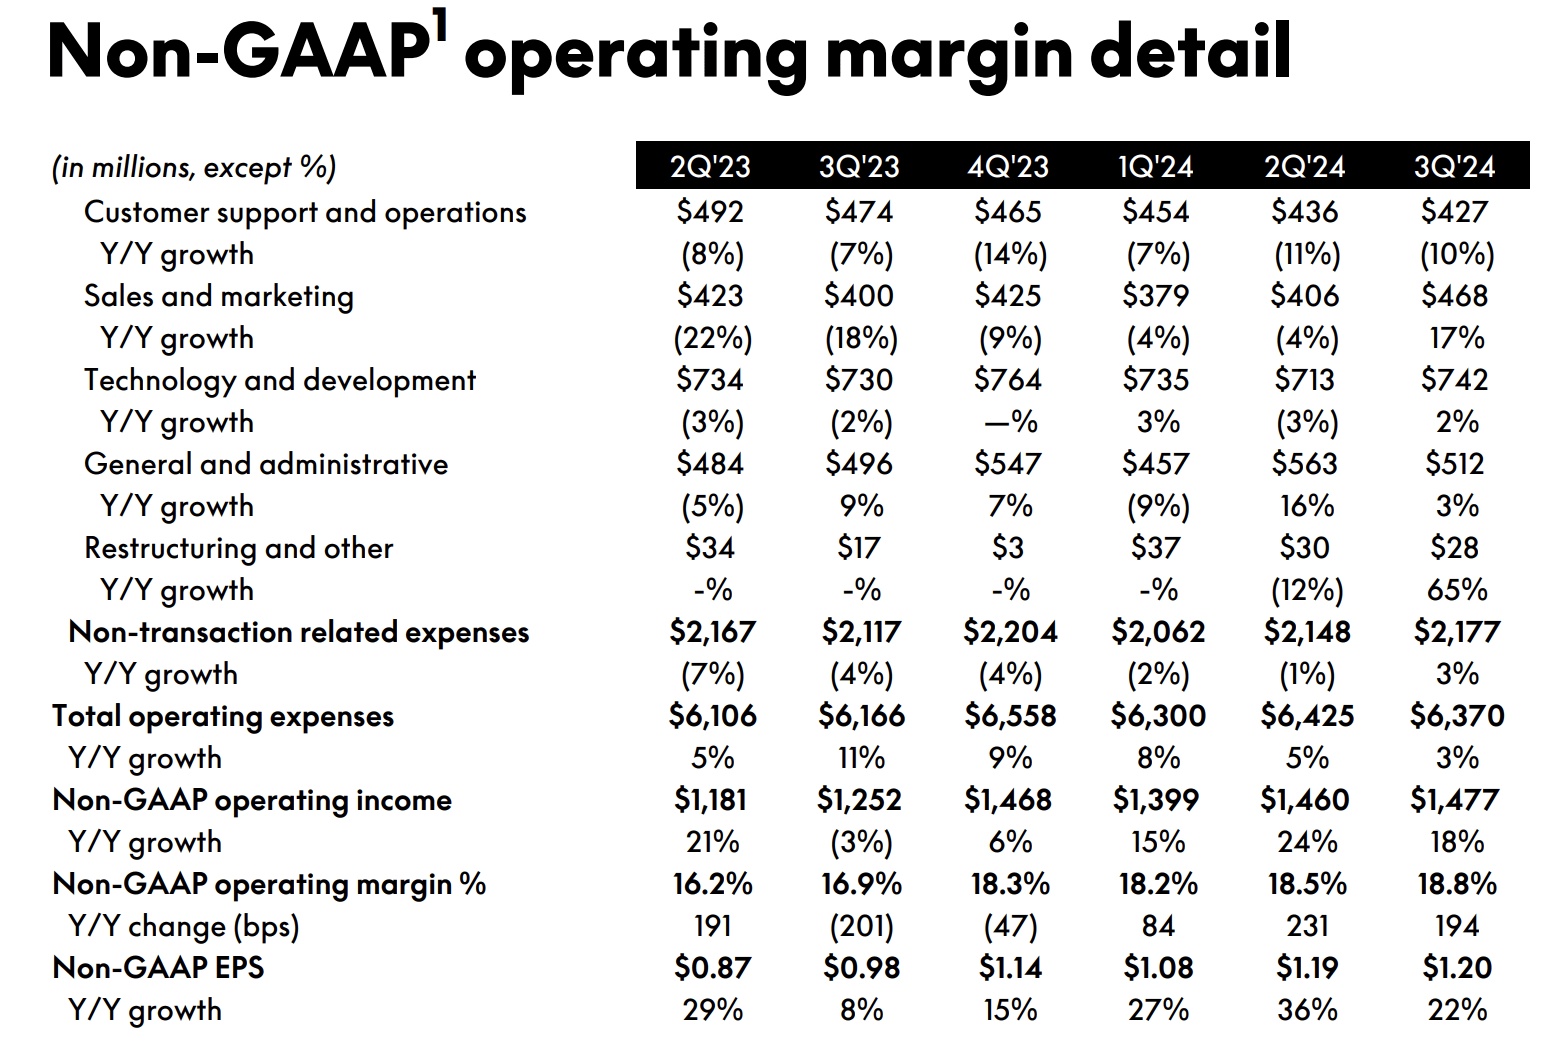
PayPal
PayPal’s operating income margin increased by 30 basis points in its previous quarter. The company disclosed substantial sales and marketing expenses in Q3. Although debatable, we think the line-item’s 17% year-over-year increase won’t re-occur. Instead, we expect the marketing expenses to assist future growth, while normalising in-time.
On the other end, we see general & administrative expenses growing by a similar amount in 2025 (3%). Unless a company experiences a substantial structural change, SG&A is usually scaled in-line with inflation, which is why we think the 3% is a fair number for 2025. Furthermore, we think technological development expenses will stay grossly the same; we base our conclusion on past trends.
Balance Sheet
PayPal’s balance sheet seems solid. According to our calculations, the company has a liquidity ratio of 1.24, which isn’t necessarily outstanding but shows that PayPal has sufficient liquidity. Moreover, we didn’t take note of any stretched receivables or payables upon assessing the company, nor did we spot any unaffordable debt. In fact, PayPal doesn’t have net debt, meaning its cash and short-term investments exceed its debt issuance by approximately $3.7 billion.
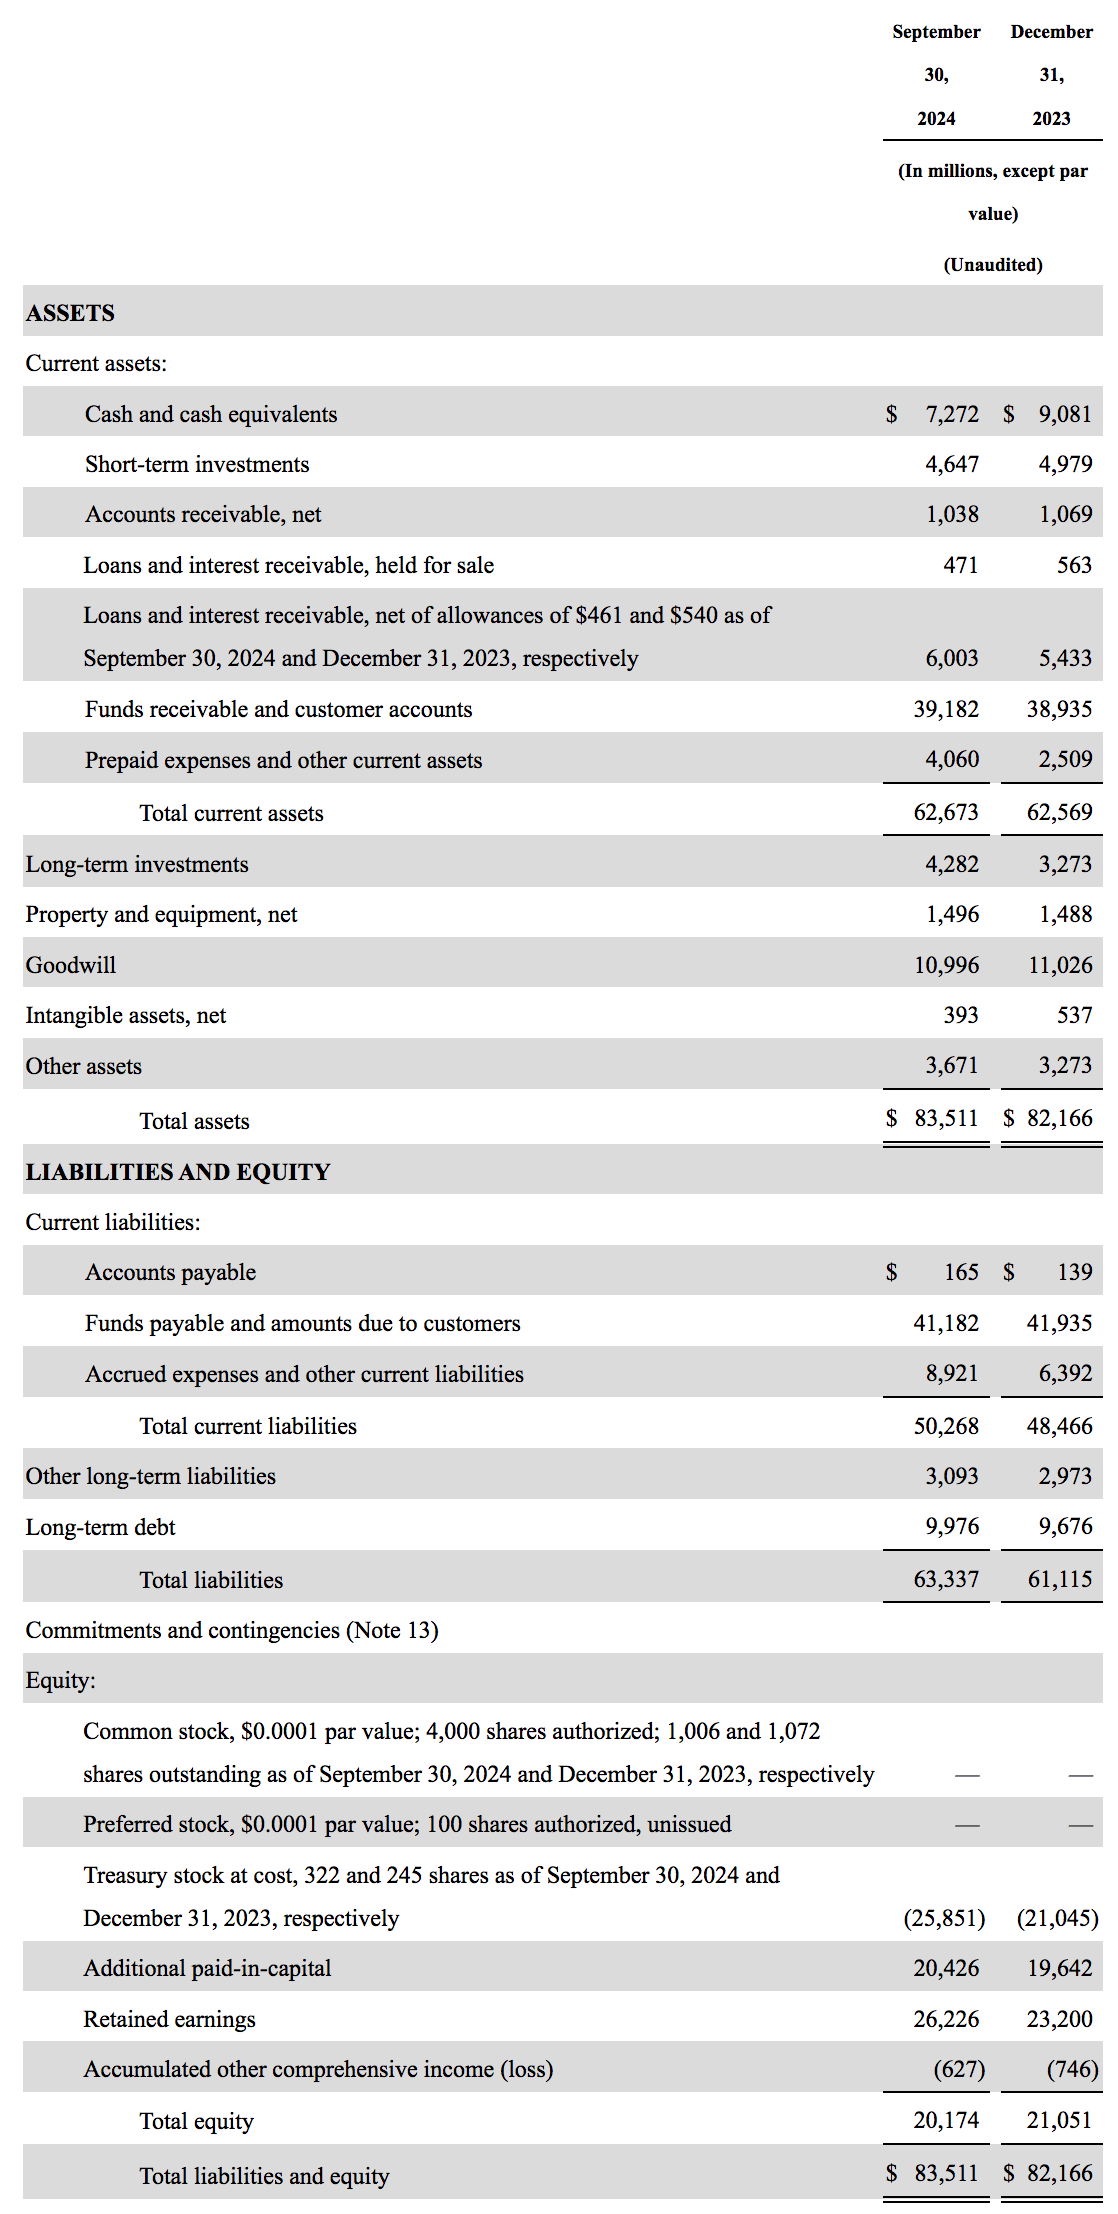
Balance Sheet (PayPal)
New Management
PayPal has executed a management overhaul in the past 18-months, whereby numerous executives have been replaced, including the ex-CEO Dan Schulman, by the now incumbent, Alex Chriss.
Piper Sandler recently commented on PayPal’s management change, stating: “The transformed management team is focused on shifting PayPal from a payments company to a full-fledged commerce platform, which we view positively.”
We don’t have much to add regarding the managerial shift. Of course, the company’s post-pandemic trend growth suggests that transformation is required. However, in our experience, the proof is in the pudding. While we back the strategic shift toward a broader enterprise strategy, we would be cautious of investing into rhetoric.
Valuation
DCF
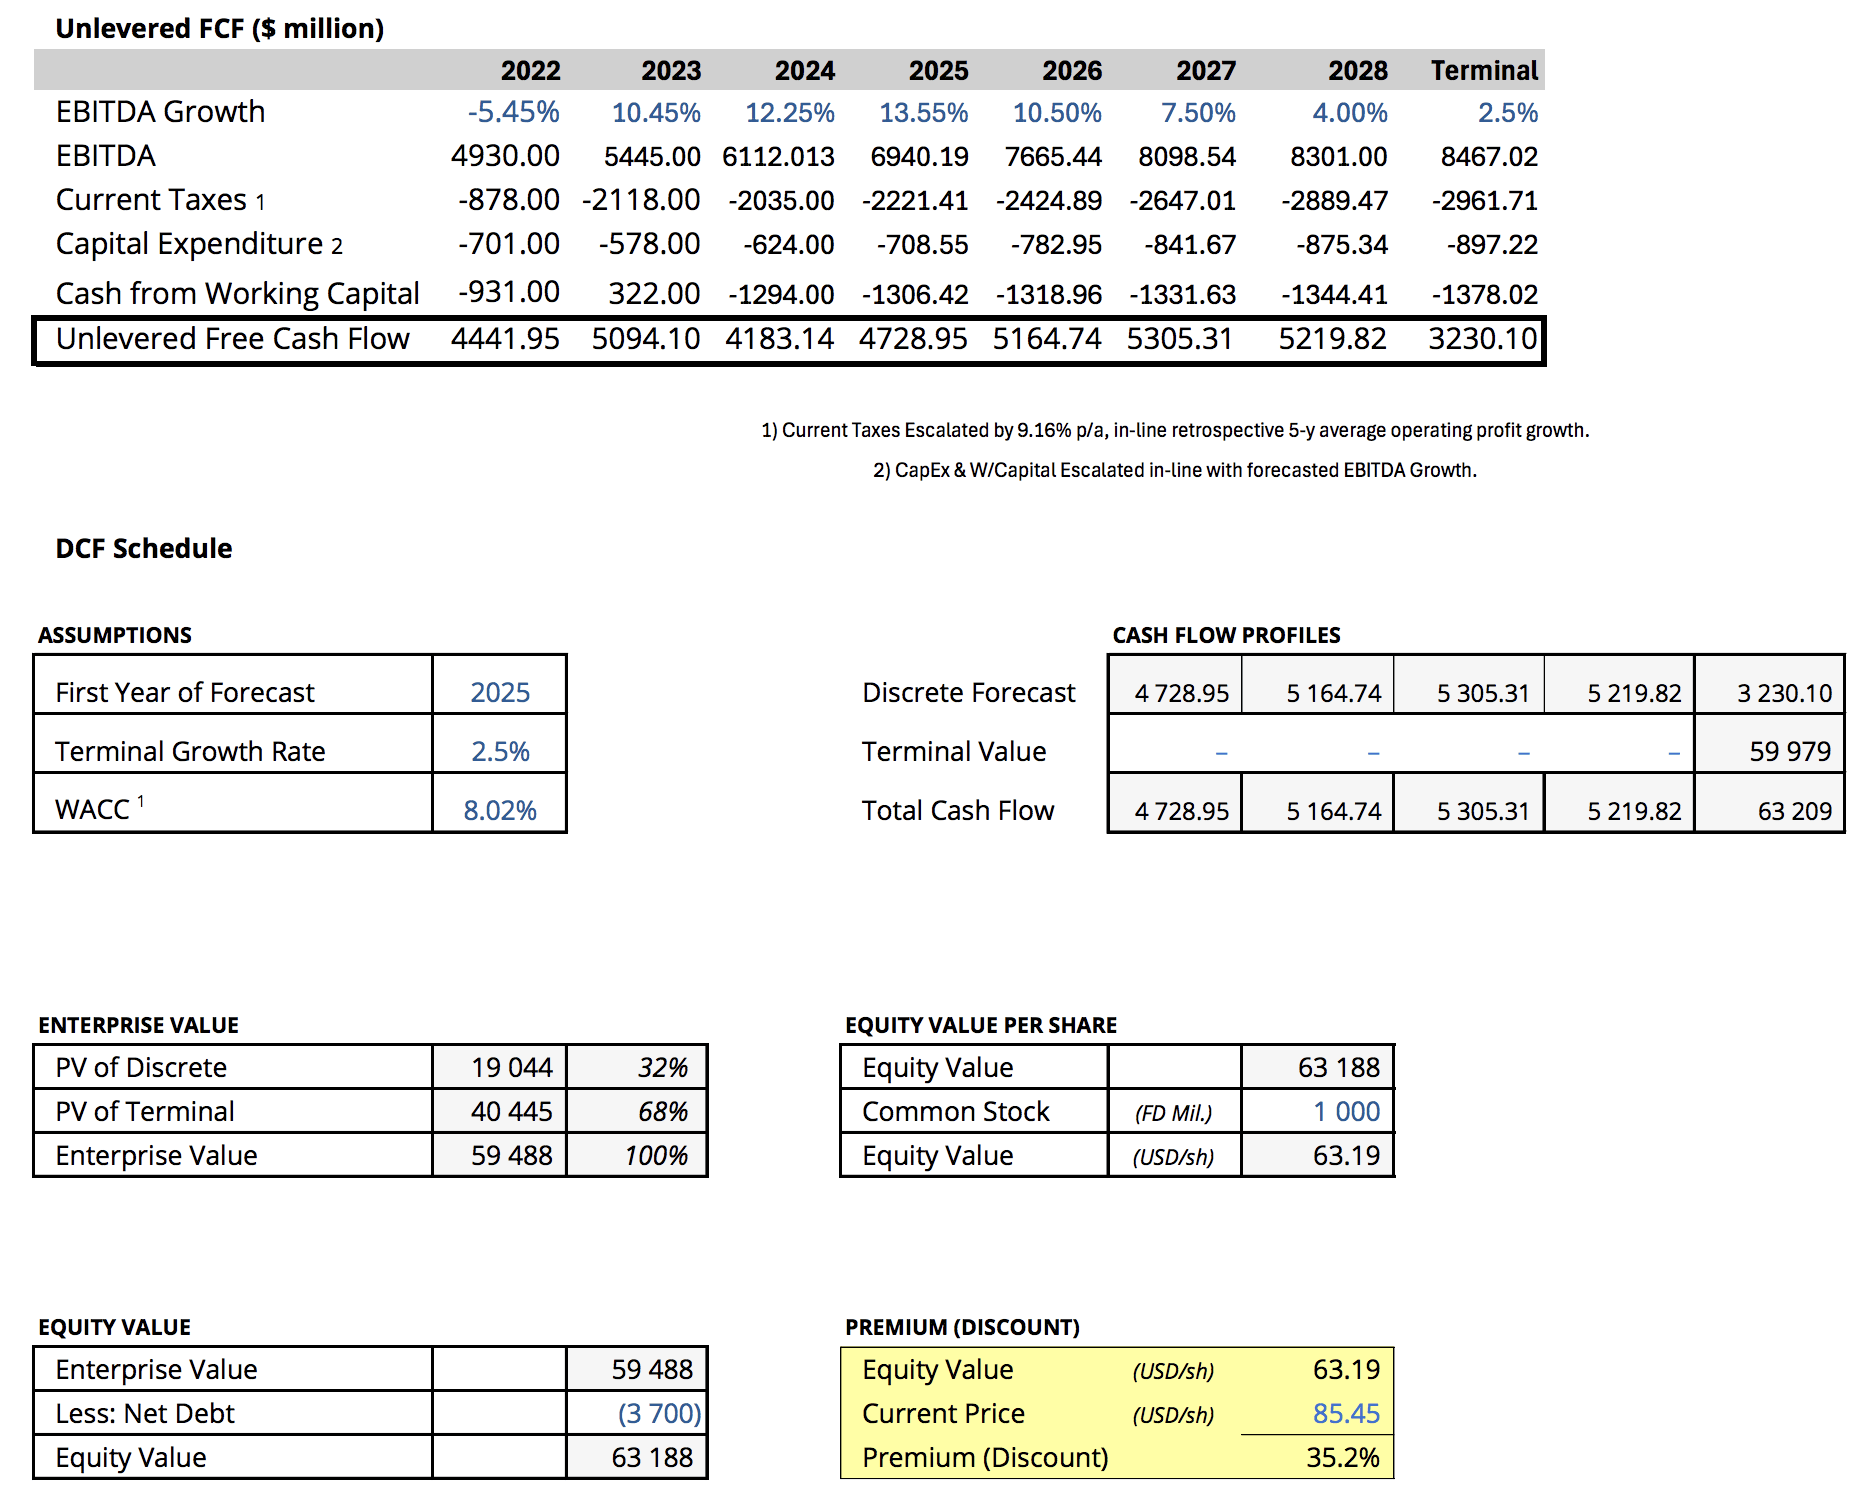
We decided to use a discounted cash flow model to value PayPal’s stock. PayPal’s investor presentation includes a free cash flow statement. However, we were somewhat in disagreement with its consolidation, and therefore opted to construct our own un-leveraged free cash flow statement, which we used for our DCF model.
Our model deems PayPal stock overvalued by about 35.2% versus its pre-market price on December 19. The model’s compact version is embedded below; a discussion about its inputs follows.
Click On Image To Enlarge (Author’s Work, Data from Seeking Alpha and Alpha Spreads)
Herewith are a few notes regarding the model’s inputs.
- Longevity: We started forecasting in 2025, where we discounted all amounts back to the start of 2025, which is less than half a month away from today. In essence, the valuation is subject to monthly rounding.
- EBITDA: The EBITDA figures for 2022, 2023, and 2024 were obtained from Seeking Alpha’s database. Seeking Alpha’s database extracts from the company’s 10-K, and subsequently adjusts items to find the EBITDA. Alternatively, a manual workaround can be done by using the 10-K’s operating profits , whereby readers can adjust the line-item to calculate EBITDA themselves – We opted for Seeking Alpha’s vendor-based EBITDA.
- EBITDA Growth: EBITDA growth for 2025 was set at the company’s average 5-year historical EBITDA growth rate, we then slowly tapered the amount in succeeding years until we reached a “steady growth stage” rate in the terminal year – The steady rate was set equal to our own economic growth rate equivalent.
- Other Items: Changes in CapEx, working capital, and taxes were obtained from Seeking Alpha’s database. We scaled the taxes and working capital by 9.16% per annum in our forecast, except for the final year where we scaled taxes by the terminal growth rates. Additionally, the CapEx was escalated by the forecasted EBITDA growth, aside from the final year where terminal rate was applied.
- Shares Outstanding: PayPal had about 1.015 billion in undiluted common shares outstanding per Q3. However, we compressed the amount to a flat billion to account for PayPal’s buyback program.
- Risk Premiums: We used Alpha Spreads’ 8.02% weighted average cost of capital as a discount rate and a terminal growth rate of 2.5%.
Note: DCF models are subject to an analyst’s assumptions, therefore different models may provide different values. The model should be used as a guideline as opposed to a definitive view of a stock’s fair value.
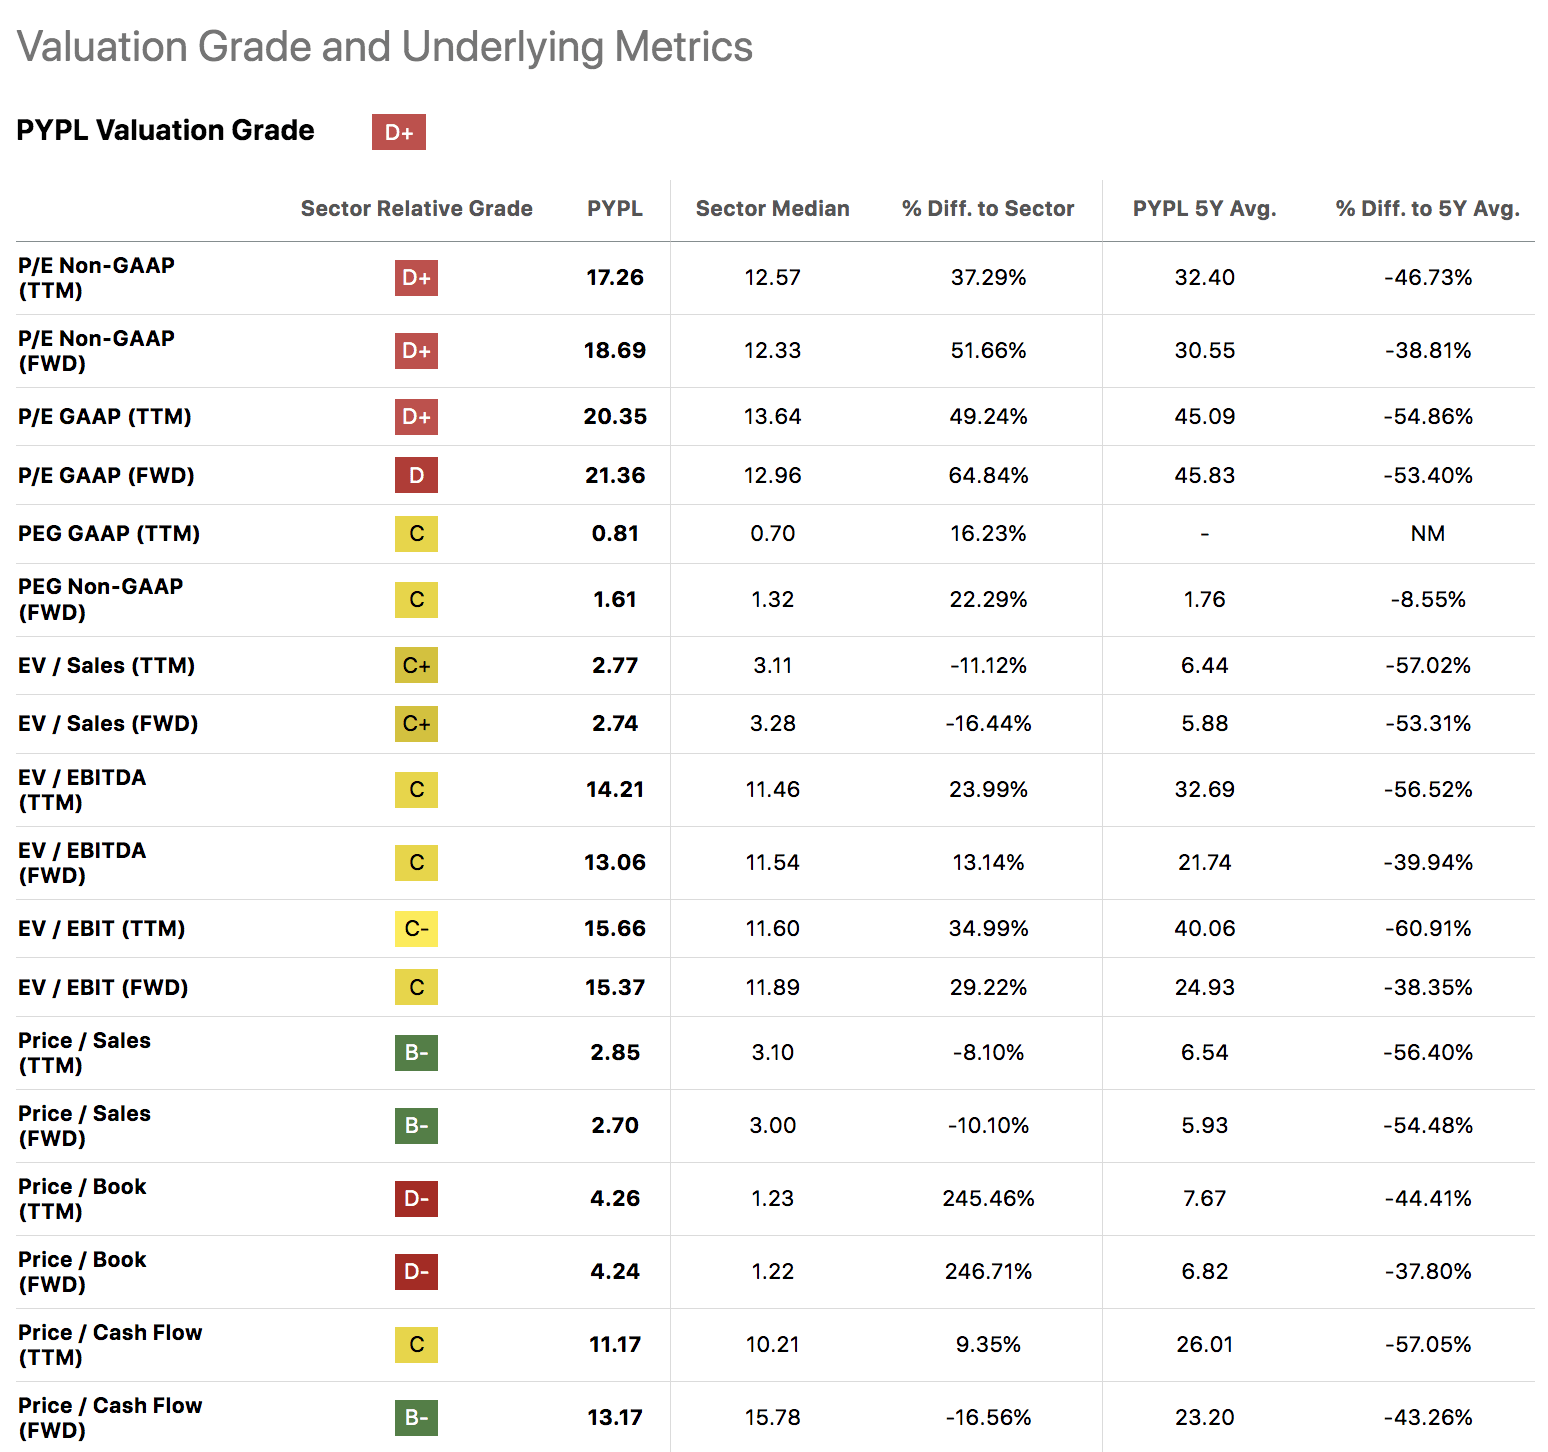
Relative Valuation Multiples
To challenge our DCF model, we looked at PayPal’s relative valuation multiples. We used a normalised approach, meaning we compared the stock’s multiples to their five-year averages; why five years? Five years is often considered the duration of a business cycle.
Most of PayPal’s multiples are below their five-year averages, which suggests relative value is in store. This counteracts our DCF model, suggesting an alternative argument exists.
Seeking Alpha
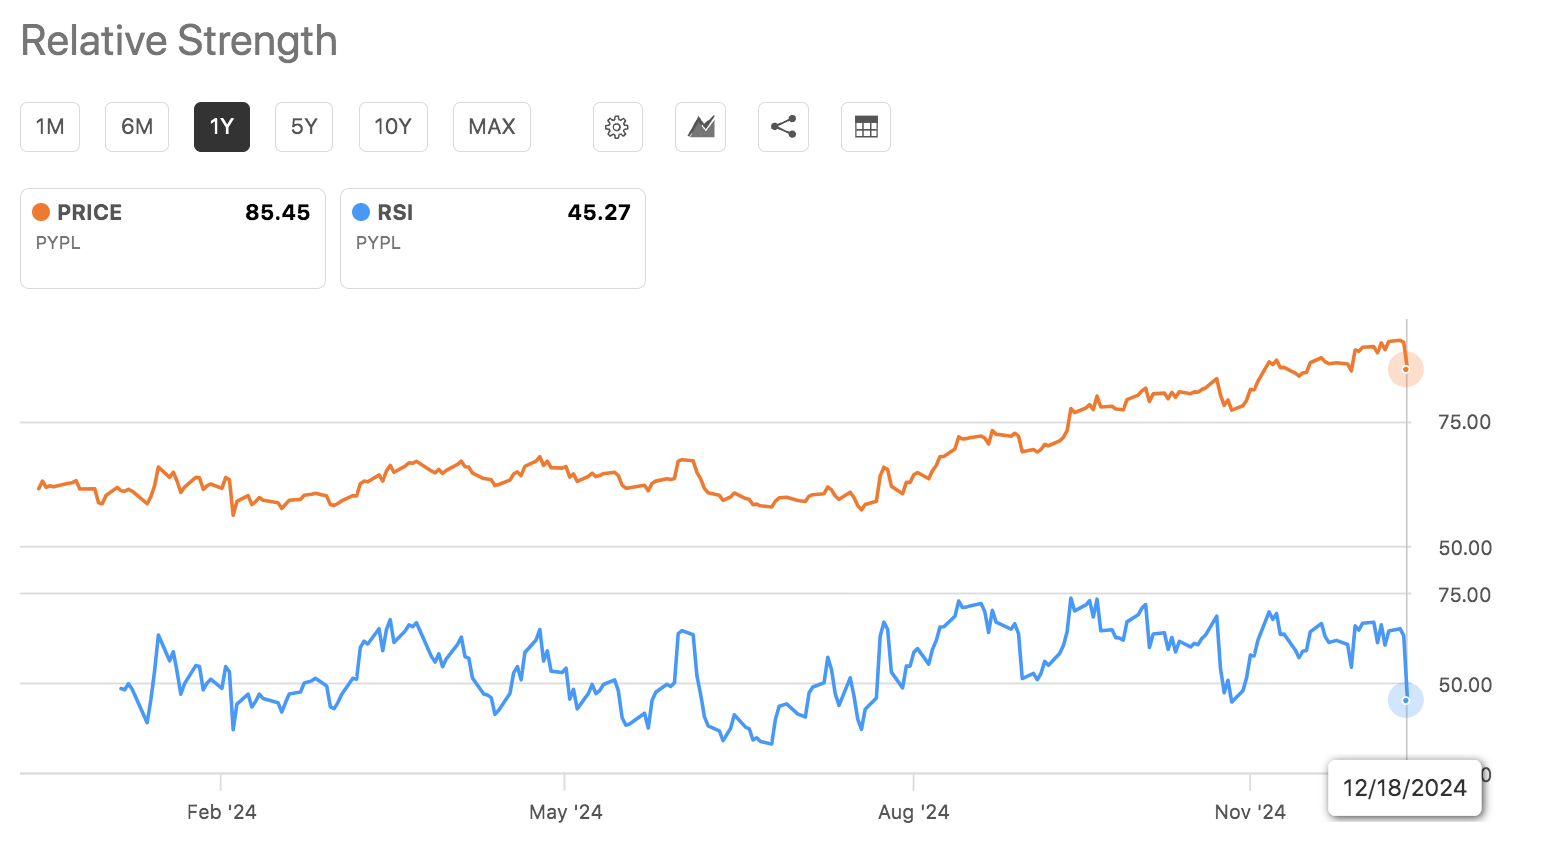
Technical Analysis
Further to the above, technical indicators provide a telling outlook. PayPal’s relative strength index is around 45, suggesting the stock is far from being overbought (the boundary is 70). However, at the other end, it doesn’t show that PayPal’s stock is oversold either (below 30), especially as it recently dipped below its 10-day moving average, conveying a potential resistance level.
Seeking Alpha
Final Word
PayPal’s fundamentals have improved since our latest coverage, and its price multiples echo relative value. However, a deeper dive into PayPal flags potential macroeconomic and company-specific headwinds. Moreover, our discounted cash flow model deems the stock notably overvalued.
We don’t think PayPal is a Sell. However, in light of its recent surge and our analysis, we believe PayPal’s stock should be placed on Hold, instead of kept on our ‘Buy’ list.
Analyst’s Disclosure: I/we have no stock, option or similar derivative position in any of the companies mentioned, and no plans to initiate any such positions within the next 72 hours. I wrote this article myself, and it expresses my own opinions. I am not receiving compensation for it (other than from Seeking Alpha). I have no business relationship with any company whose stock is mentioned in this article.
Kindly note that our content on Seeking Alpha and other platforms doesn't constitute financial advice. Instead, we set the tone for a discussion panel among subscribers. As such, we encourage you to consult a registered financial advisor before committing capital to financial instruments.
Seeking Alpha’s Disclosure: Past performance is no guarantee of future results. No recommendation or advice is being given as to whether any investment is suitable for a particular investor. Any views or opinions expressed above may not reflect those of Seeking Alpha as a whole. Seeking Alpha is not a licensed securities dealer, broker or US investment adviser or investment bank. Our analysts are third party authors that include both professional investors and individual investors who may not be licensed or certified by any institute or regulatory body.