Summary:
- Meta stock is up 24% after ad revenues grew 2% in Q4 2022, much better than expected. We believe it now has a 20x P/E.
- Reels appeared to have made good progress, and management has signaled that it is now ready to focus on monetization.
- Management significantly reduced 2023 OpEx and CapEx guidance, and restated a commitment to cost efficiency and profit growth.
- We expect Adjusted EBIT to shrink 17% in 2023, then resume its growth. The buyback program has been expanded to $50.9bn.
- With shares at $190.20, we expect an exit price of $286 and a total return of 50% (15.0% annualized) by 2025 year-end. Buy.
Kevin Dietsch
Introduction: Why is META Stock Up?
Meta Platforms Inc. (NASDAQ:META) released their Q4 2022 results after markets closed on Wednesday (February 1). META shares are up 24%, at $190.20, as of 12:15 Eastern Standard Time, returning to their level last June:
|
Meta Share Price (Last 5 Years)  Source: Google Finance (02-Feb-23). |
With this rebound, Meta’s share price has returned to 11% above the level at our initiation in March 2019, though it remains 30% lower than at the start of 2021.
Meta ad revenues grew 2% year-on-year (excluding currency) in Q4 2022, much better than expected. Reels appeared to have made good progress, and management has signaled that it is now ready to focus on monetization. Headwinds from Apple (AAPL) App Tracking Transparency have continued to recede. Q1 2023 revenue guidance implies relative stability. On the costs side, management has significantly reduced OpEx and CapEx guidance for 2023, and Mark Zuckerberg stated 2023 will be the “year of efficiency” and reiterated his commitment to earnings growth.
We expect Adjusted EBIT to shrink another 17% then resume its growth. Meta stock is trading at around 20x 2023 Adjusted EPS in our estimates. Free Cash Flow generation was minimal in 2022, but management has added another $40bn to buybacks. Our base case forecasts indicate a total return of 50% (15.0% annualized) by 2025 year-end. Buy.
Meta Q4 2022 Results Headlines
In Q4 2022, Meta’s ad revenues grew 1.8% year-on-year excluding currency, but fell 4.2% including currency:
|
Meta P&L (Q4 2022 vs. Prior Periods) 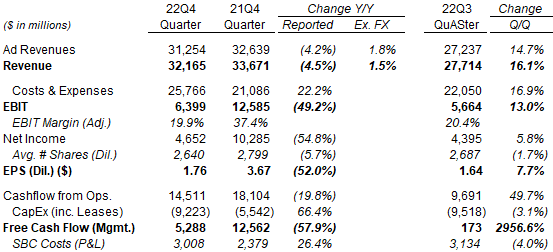 Source: Meta results releases. NB. SBC = Share-Based Compensation. |
EBIT, Net Income and EPS all fell by strong double digits year-on-year in Q4, due to a 22% increase in expenses (which included $4.20bn of restructuring charges). Free Cash Flow (“FCF”) (as defined by management) fell even more due to a 66% jump in CapEx.
Sequential comparisons with Q3 are not meaningful as Q4 includes the seasonally strong holiday period.
For full-year 2022, ad revenues grew 4.0% year-on-year excluding currency, but fell 1.1% including currency. EBIT, Net Income and EPS similarly fell by strong double-digits because of a 23% increase in expenses (which included $4.61bn of restructuring charges). FCF more than halved after CapEx jumped 67% to $32.3bn:
|
Meta P&L (2022 vs. Prior Year) 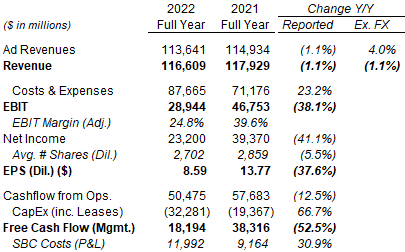 Source: Meta results releases. NB. SBC = Share-Based Compensation. |
Despite these poor headlines, there are reasons to believe that Meta’s operations are stabilizing, starting with revenues.
Meta Ad Revenue Growth Better Than Expected
The 1.8% year-on-year growth (excluding currency) in Meta ad revenues was only slightly worse than the 2.6% figure in Q3; on a stacked basis, Q4 represented a 3-year total growth of 51%, only 3 ppt lower than Q3’s 54%:
|
Meta Ad Revenue Growth Year-on-Year (Ex-Currency) – Stacked 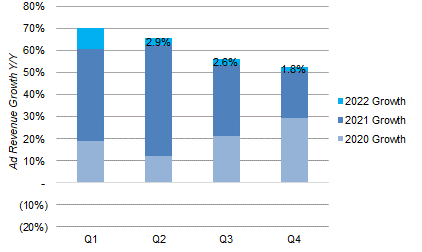 Source: Meta results releases. |
(The picture is similar, at 65% vs. 60%, if we use a geometric total instead of an arithmetic one).
Meta’s Q4 growth was in the context of a widely-acknowledged slowdown in the advertising market. For example, Microsoft (MSFT), saw its “Search & News Advertising Revenues Excluding Traffic Acquisition Costs” growth decelerate from 21% in Q3 CY22 to 15% in Q4 CY22 (helped by 5 ppt and 6 ppt of acquisition impact respectively). Snap (SNAP) similarly saw its year-on-year revenue growth decelerate from 6% in Q3 to 2% in Q4. (All figures exclude currency).
Drivers of Q4 Meta Ad Revenue
The 1.8% growth in Meta ad revenues in Q4 was driven by a 23% growth in the number of ad impressions (compared to 17% in Q3), offset by a 22% decline in the average price per ad (18% in Q3).
By region, the growth in ad impressions was “primarily driven by the Asia-Pacific and Rest of World regions”. Ad revenues showed a similar picture, with Rest of World growing 4.9% year-on-year in dollars and APAC ad revenues falling only 3.5% despite currency headwinds; U.S. & Canada ad revenues were flattish (down 0.4%) year-on-year, while Europe was down 15.5%, likely due to both currency headwinds and impact from high energy prices. (Ad revenues in Europe already fell 11.7% in Q2 and 16.3% in Q3.)
|
Meta Ad Revenue Growth By Quarter ($) (2022) 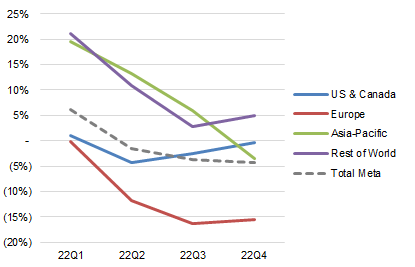 Source: Meta results releases. |
CFO Susan Li described ad impression growth as driven by both a growth in Reels and “ad load optimization” across formats, as well as “engagement tailwinds”:
“It’s a combination of both the growth in Reels – that’s certainly a faster-growing source of impressions – and there’s also I think some ad load optimizations that we’re making across formats that would include Feed and Reels. And then there are certainly engagement tailwinds … So I would really say all three of those play a role in the impression growth.”
The decline in average price per ad was, as in previous quarters, “primarily driven by strong impression growth, especially from lower monetizing surfaces and regions, lower advertiser demand and foreign currency depreciation”.
Among advertising verticals, Financial Services and Technology were the largest detractors from Q4’s year-on-year revenue growth, despite being relatively small; Travel and Healthcare were the largest contributors, despite also being relatively small. Consumer Packaged Goods and E-commerce, Meta’s largest verticals, saw revenues fall again, but the decline in E-commerce decelerated sequentially from Q3.
Click-to-Messaging ads across Messenger, WhatsApp and Instagram reached a $10bn revenue run-rate, up from $9bn in Q3, with SMBs being the “backbone” of this business (and the Instagram part being “much smaller”).
Published user statistics continue to be healthy, with Daily Average People (the number of people who use any of Meta’s family of apps daily) up 1.0% sequentially (to 2.96bn) and Monthly Average People up 0.8% sequentially in Q4 (to 3.74bn), though they do not measure the amount of time each user spends on Meta apps.
Reels Making Good Progress
Reels appeared to have made good progress. In addition to Reels’ contribution to revenue growth described above, CEO Mark Zuckerberg also shared two anecdotal datapoints:
- Reels plays across Facebook and Instagram have more than doubled over the last year
- Resharing of Reels has more than doubled on both apps in just the last 6 months
Just as importantly, management has signaled that Reels is now ready to focus on monetization. As Zuckerberg said on the earnings call:
“Is there any strategic advantage to letting it scale further than … would be profitable to do? And I think at the scale that it’s at right now, it’s not clear that there is much strategic advantage … The right thing to do is to work on monetization efficiency. And we know that there is demand to see some more Reels.”
While Reels are currently revenue-dilutive because it monetizes less well than established surfaces like Feed, management continued to expect Reels to be “overall revenue neutral at the end of this year, early next year”.
App Tracking Transparency Impact Receding
The headwind from Apple (AAPL) App Tracking Transparency (“ATT”) seemed to have continued to recede.
According to a Wall Street Journal article last week (subscription required), Meta’s Chief Marketing Officer and Vice President of Analytics said at an internal talk in October that:
“Meta had already absorbed the worst from Apple’s tracking changes. The damage had diminished from the more-than 8% hit to revenue early in the year to just 2.5%, and likely would disappear entirely in the fourth quarter”
Meta CFO Susan Li made similar comments on the Q4 earnings call:
“There is still certainly an absolute headwind to our revenue number. That is the impact of the ATT changes being in place. Having said that, we are lapping its rollout and adoption, and we’re making progress in mitigating the impact”
Meta has been countering ATT by improving its targeting ability with better analytics and growing onsite conversions, and this approach appears to be working.
Meta Q1 2023 Revenue Outlook
For Q1 2023, Meta has guided to total revenues of $26-28.5bn, which implied year-on-year growth of between -7% and +2% (from $27.9bn) in the prior-year quarter and “it reflects a wide range of uncertainty given the continuation of the general macro environment”, and implies an otherwise relatively stable operational performance.
Focus on Efficiency to Help Earnings
Meta has signaled a significantly more efficient operation in the future.
Management has reduced its 2023 OpEx and CapEx guidance significantly:
- FY23 expenses to be $89-95bn (was $94-100bn)
- FY23 CapEx $30-33bn (was $34-37bn)
The changes in guidance were relative to the new outlook issued on November 9 after Meta announced a headcount reduction of 11,000 and certain office footprint consolidation. The new reduction in OpEx was due to, in descending order of size, a smaller headcount than previously expected, a change in the accounting estimate of the useful lives of equipment and an expected office footprint consolidation expense now being $1bn instead of $2bn (as part of it was incurred already in Q4 2022). The reduction in CapEx involves in a part a more phased approach towards building data centers that will require less upfront costs.
Mark Zuckerberg also stated 2023 will be the “year of efficiency” and reiterated his commitment to earnings growth:
“My management theme for 2023 … is the Year of Efficiency … We will both build a stronger technology company and become more profitable. I am very focused on doing this in a way that helps us build better products … Even if our business outperforms our goals, this will stay our management theme for the year”
“I am also focused on delivering better financial results than what we have reported recently and on meeting the expectation that I outlined last year of delivering compounding earnings growth even while investing aggressively in future technology.”
Cutting costs to reverse pandemic-era over-hiring has been a common theme among Technology companies, with nearly all large players having announced significant reductions, in many cases (notably Salesforce (CRM) and PayPal (PYPL)) coinciding with the arrival of activist investors on the shareholder register. We believe Meta’s commitment to efficiency is real and will make a meaningful difference to future financials.
Meta 2023 P&L Forecast
For our 2023 forecast, we take the mid-point of management’s $89-94bn OpEx guidance (and subtracting the $1bn office consolidation expense for Adjusted EBIT), and assume a 2% year-on-year revenue growth:
|
Meta Key P&L Items – Historic & Our Forecasts (2018-23E) 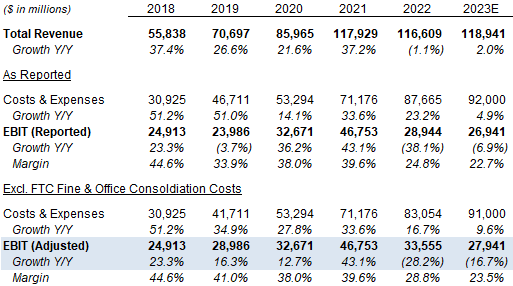 Source: Meta company filings, Librarian Capital estimates. |
These two assumptions imply a 2023 Adjusted EBIT of $27.9bn, down 17% year-on-year and 4% lower than in 2019.
Valuation: META Stock Key Metrics
At $190.20, on 2022 financials (with restructuring charges of $4.61bn adjusted out), Meta stock is at an 18.7x P/E:
|
Meta Net Income & Cashflows (2018-2022) 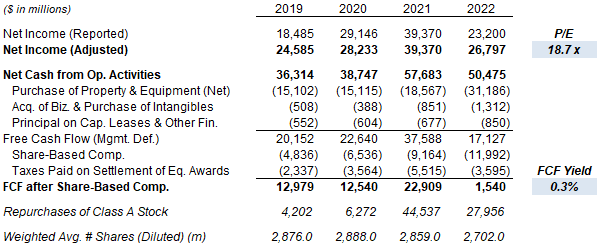 Source: Meta company filings. NB4. 2022 Net Income (Adjusted) adjusted for $4.61bn of restructuring charges, assumed to be taxed at 22%. |
On 2023 financials, we believe Meta stock is likely to be trading on a P/E of around 20x, based on our view that Adjusted EBIT will decline by 17% in 2023, offset by buybacks.
Meta generated only $1.54bn of FCF in 2022 by our definition, which subtracts non-cash shares-based compensation costs as well as cash spent on purchasing businesses and intangibles. This was primarily because, out of $50.5bn of Cashflow from Operations, Meta spent $31.2bn on Property & Equipment CapEx, $12.0bn on share-based compensation, and $3.6bn to settle taxes related to equity awards.
Meta spent $28.0bn on share buybacks during 2022, and the share count is down 5.7% year-on-year as of Q4 2022. At Q4 results management stated that the Board has added another $40bn to the buyback program, in addition to the $10.9bn still left. The $50.9bn total represents 10% of the current market capitalization, though there is no timetable for the buybacks. This is likely affordable regardless of 2023 P&L because of Meta’s large non-cash share-based compensation costs and its $40.7bn of gross cash (compared to $9.9bn of debt) as of 2022 year-end.
What Is META Stock’s 2025 Forecast?
We increase our Meta Net Income growth forecasts modestly and also increased 2023 buybacks. We also bring the exit P/E back to 25x, reflecting higher investor confidence, and still low by Technology standards.
We now assume:
- 2023 Net Income to fall 15% (was to fall 20%)
- From 2024, Net Income to grow by 10% each year (was 5%)
- Share count to fall by 7% in 2023 (was 3%)
- Share count to fall by 3% in 2024 and 2025 (unchanged)
- P/E at 25x at exit (was 20x)
- No dividends
The new 2025 EPS forecast of $11.42 is 25% higher than before ($9.20):
|
Illustrative Meta Return Forecasts 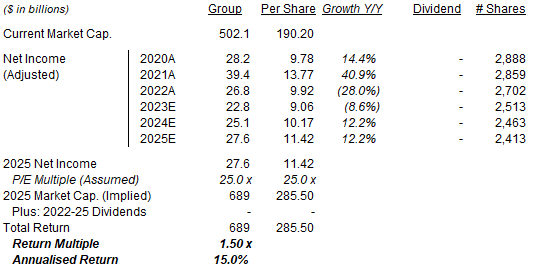 Source: Librarian Capital estimates. |
With shares at $190.20, we expect an exit price of $286 and a total return of 50% (15.0% annualized) by 2025 year-end.
Is META Stock A Buy, Sell, or Hold? Conclusion
We reiterate our Buy rating on Meta Platforms stock.
Disclosure: I/we have a beneficial long position in the shares of META,MSFT,PYPL either through stock ownership, options, or other derivatives. I wrote this article myself, and it expresses my own opinions. I am not receiving compensation for it (other than from Seeking Alpha). I have no business relationship with any company whose stock is mentioned in this article.
