Summary:
- Apple is improving its business model over time, increasing equity returns to record levels.
- The company has done so while doubling down on its R&D spending.
- Growing high margin service revenues have been key to this improvement.
- The value of equity over its cost (EMVA) has risen to a high of 90% of equity capitalization.
- Fundamental, forensic analysis shows that AAPL remains a “buy and hold” stock.
Shahid Jamil
This analysis is the second in a monthly series of long-term, business model-centric views based on the Value Equation framework I devised, successfully used as a multiple public company founder and CEO, and addressed in a book by the same name. The equation reduces companies to six universal variables to compute current equity returns, which are foundational to corporate valuation and shareholder wealth creation.
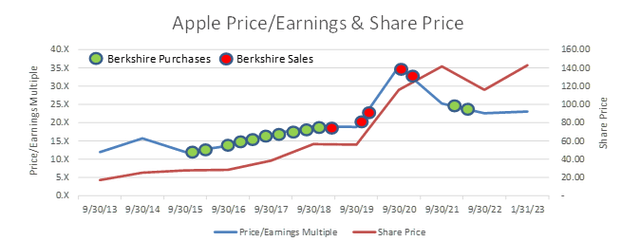
Apple (NASDAQ:AAPL) is the single largest public equity holding of iconic “buy and hold” investor Berkshire Hathaway (BRK.A) (BRK.B), representing almost 40% of its public share holdings. At nearly 6% of the company, Berkshire is also the largest single investor in Apple shares (Vanguard and BlackRock control more shares but are index investors). Since Berkshire began accumulating AAPL in 2016, only one investor has acquired more shares: Apple itself. Between then and the final quarter of 2022, the company repurchased nearly $450 billion worth of stock, representing approximately 30% of its shares.
Stockcircle / YCharts
In 2013, Jim Cramer coined the term FAANG to combine Facebook (META), Apple, Amazon (AMZN), Netflix (NFLX) and Google (GOOG) (GOOGL) into a single moniker. Today, the five companies account for roughly 10% of US equity total capitalization. In evaluating the five companies, two stand out to me as having the single best underlying business models, serving as magnets for long-term investors like Berkshire Hathaway: Alphabet and Apple. Of these, the latter is arguably the best.
This article will use the Value Equation framework to help determine if AAPL remains a “buy and hold” stock.
A Value Equation Look
Over the past decade, Apple’s potent business model has been able to maintain impressive average current equity returns on its cost-based equity of approximately 45%. To grow to the size of Apple and maintain such high levels of current equity returns, actually improving the business model over time, is a rarity.

AAPL SEC 10-K Filings / Author
There are just a few numeric relationships that determine current pre-tax equity returns. Sales/Investment ratios and operating profit margins are two of these. Three others relate to the amount and cost of borrowings and leases and the amount of maintenance capital expenditures. I have left these three variables out of the preceding table. Maintenance capital expenses are not very material and Apple has more cash and marketable securities than it has borrowings. In fact, the company has historically had more in interest income than interest expense, helping to make it one of three companies in the S&P 500 rated by Moody’s having a Aaa rating (Standard & Poor’s still has the company rated AA+).
Apple concluded its 2022 fiscal year with the highest current pre-tax return on its cost-based equity in its history: Better than 62%. If you were to back out the company’s investment in cash and marketable securities, which comprise almost half its business investment at cost, serving as a drag on investor returns, the 2022 fiscal year current pre-tax ROE would have swelled to more than 80%. And the company accomplished this feat with its highest level of research and development (R&D) costs as a percentage of revenues since 2004. Incredible.
Of course, none of us can buy AAPL at its approximate $340 billion equity cost. Instead, it’s equity is presently valued at close to seven times that number, or $2.3 trillion. AAPL is the world’s single most valuable company and among the half dozen global concerns having a value exceeding $1 trillion. This means that, for an investor buying Apple shares, the sales-to-investment ratio does not exceed 1X, but is under .2X. And the 2022 computed current pre-tax equity rate of return is not over 60%, but closer to 6%.
The market rate of return is what shareholders get when they invest. But the return at cost is what they get when the company reinvests their earnings. So, it serves to elevate compound return growth rate, to which Warren Buffett attributes much of his investing success.
At the time Berkshire Hathaway began accumulating AAPL shares, the market current pre-tax rate of return was almost double its present level. So, is the company still worthy of a “buy and hold” investment?
Performance
Apple’s financial performance is impressive, full stop. Over the past decade, the company has maintained an average operating profit margin exceeding 35% while raising its annual R&D expenses from under 3% of sales in 2013 to over 6% of sales in 2022.
The company computes its operating profit margin to be before R&D and G&A costs, so different than the Value Equation construct shown earlier, which is measured after these costs. The company began breaking out service and product operating profit margins in 2017, resulting in the below instructive table, highlighting a main reason underlying corporate margin improvements: increased services.

Company SEC 10-K Filings
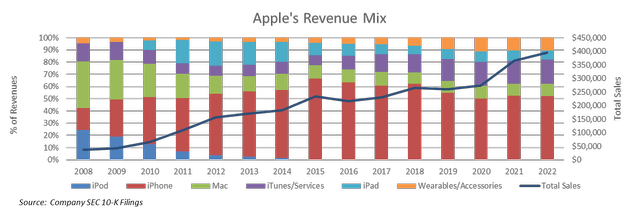
Over the past decade, the company’s revenue growth has averaged just over 10%, while its product mix has shifted. iPhone sales, which peaked at over 66% of revenues in 2015, remain slightly in excess of 52%. Revenue from services and wearables has been largely responsible for the shifting iPhone mix.
Company SEC 10-K Filings
Lost in the chart is the growth rate of each of the business segments. Over the past decade, service revenues have grown almost 20% annually, followed by iPhone revenues of close to 12%. Sales of Macs have been comparatively slow, averaging just over 6% growth, though they have averaged over 15% over the past three years, aided by the redesigned M2 MacBook Air and plentiful product supply in a tight supply market. iPad revenue growth has been comparatively lackluster, averaging under 1%.
I elected to take the preceding graphic to 2008, which better highlights a company that has grown through sustained product delivery and innovation. Fifteen years ago, AAPL’s revenue base was centered mostly in sales of computers and iPods. While the former has nearly tripled in sales, the latter no longer exists, having been “featurized” into the company’s iPhones and iPads.
When asked about Apple’s vision in 2009, CEO Tim Cook stated “We believe we are on the face of the earth to make great products and that’s not changing. We are constantly focused on innovating.” Indeed, they have.
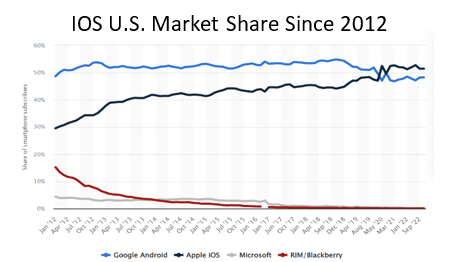
One final thing missing from the preceding graphic is the notion of market share. iPhone revenue growth over the past decade owes much to market share gains, with the company starting at around 30% of the US smartphone market in 2012, rising to 40% a year later and then climbing slowly to better than 50% in 2020.
Globally, the market share for the iPhone ranks second, below 20%, but growing. Samsung is the world leader, with three Chinese concerns (Xiaomi, Vivo and Oppo) rounding out the global top five manufacturers.
Statista
Geography
In a recent similar piece that I did for Amazon, one of the performance issues that stood out is the company’s persistent international losses. Such is not the case for Apple. The US has contributed a highly consistent 37% of revenues since 2013, with revenue growth spread virtually equally across the company’s international divisions. Of the reported geographic segments, Japan exhibited slightly weaker growth and the rest of Asia, slightly stronger growth.
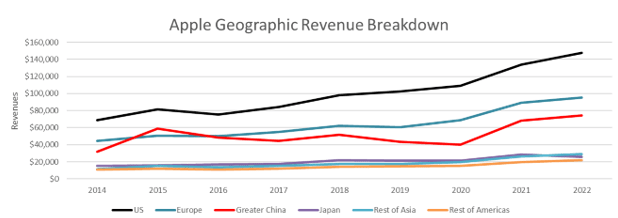
Company SEC 10-K Filings
From a margin perspective AAPL consolidates the U.S. into The Americas, where the operating profit margins reported are slightly below the company average, at under 37%. Asia, especially Japan, has been more lucrative, margin-wise, with the profitability in Greater China also showing impressive increases.

Company SEC 10-K Filings
The Applesphere
While Tim Cook’s earlier 2009 quote speaks to making great products, it is wrong to think of Apple as simply a company the produces great products. Since the introduction of its first smartphone, Apple has increasingly melded proprietary entertainment and lifestyle features into its products, which are foundational to its service revenues.
Once customers become part of the Applesphere, they tend to stick. Moving on from Apple imposes personal cost. There is music, videos and books to be purchased, healthcare statistics to be tracked, seamless automotive integration with CarPlay and much more. Finally, Apple makes it simple to buy more products. Through its iCloud service, iPhones, iPads and Macs can be backed up, both preserving data and making upgrades to new products virtually seamless.
The Applesphere, combined with potent branding and a reputation for product design and ease of use are central to Apple’s impressive defensive moat.
Given the potency of the Applesphere, it’s no wonder that the iPhone, Apple’s single most important product, has seen its market share hold steady or rise. At the beginning of 2022, Apple had more than 1.8 billion active devices worldwide. Five years prior, The CNBC All-America Economic Survey found that 64% of Americans owned an Apple product, with the average American household owning nearly three. Such statistics say much about the ability of the company to continue to post impressive growth numbers year after year.
There is an adage that says that the largest companies by equity capitalization should not be expected to grow faster than the economy as a whole. Apple has bucked this trend, with increasing product penetration and new product introduction. Not to be lost are its highly profitable service revenues derived from advertising, product warranty (AppleCare), iCloud backup, payment services and extensive digital content. Dependable service revenues have grown quickly, assuming an ever-larger shares of the company’s revenue mix.
What does the future hold for Apple products? That is a subject of much conjecture, as journalists eagerly generate thousands of column inches of press and many hours of broadcast time. Apart from a steady suite of product upgrades, conjecture swirls around such notions as a foldable iPad, an Apple TV, an Apple Car, augmented/virtual reality headsets and a HomePod inclusive of a facetime camera. Apple’s deserved reputation for innovation is well matched by eager media and consumers waiting for the next big thing.
To get to those big things, Apple is currently spending more than $20 billion annually on research and development. The number is breathtaking and behind the company’s impressive growth, defensive moat and equity value creation.
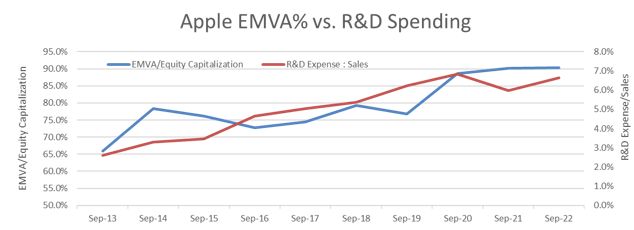
Part of the Value Equation framework is the computation of Equity Market Value Added (EMVA), which is the amount by which a company’s equity is worth more than it cost to create. In the case of Apple, the company’s EMVA currently amounts to almost $2 trillion, or approximately 90% of the company’s traded value. Few seasoned companies have ever done better.
Over the past decade, Apple’s EMVA percentage has steadily grown as the company’s current pre-tax ROE has risen. Steady business model improvement has also helped propel price/earnings multiple expansion, with the company’s P/E ratio increasing from 12X in 2013 to approximately 23X at the company’s current share price. Perhaps not coincidentally, the company’s EMVA has risen in concert with elevated commitments to R&D investments.
Company SEC 10-K Filings
Cash Flow and EMVA Growth
It is common for large, mature equity cap companies to make nominal (or even no) returns on reinvested shareholder equity. With Apple’s improving business models and record-breaking current equity returns, such is not the case. Apple is a cash cow, but investors can sleep well at night knowing that the company is able to reinvest their cash and compound their returns through corporate reinvestment. The company can be excused for growing its dividends at a pace slower than it has grown its cash flow.
For AAPL shareholders, 2022 represented the company’s lowest dividend payout ratio since the company first began paying dividends in 2013. For 2022, dividends paid approximated slightly over 12% of cash from operations.
Shareholders owning AAPL at the end of fiscal year 2022 received an approximate current pre-tax yield on their investment of 6%. After taxes and after dividends, approximately 4.4% was reinvested into the company. This small percentage of shareholder investment is now entitled to benefit from the AAPL’s current return at cost, or 63% at the end of 2022. After corporate taxes, the reinvestment compounds at rate of around 53%, providing a yield on the reinvested returns one year later of 6.8% at cost. Extrapolate this out for a few years and you can see how AAPL has been able to deliver so well for its shareholders, delivering returns that bracket 30% for the past five-, ten- and fifteen-year periods.

Author
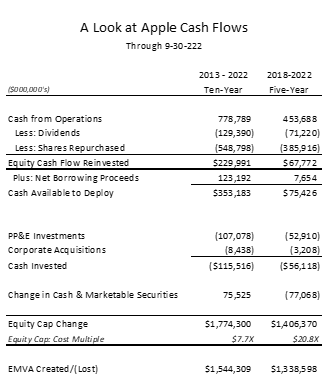
The following table illustrates Apple’s cash from operations over its most recent five- and ten-year period. Most of the company’s cash from operations has been used to buy in shares. That might be expected to reduce the company’s overall market capitalization. But note that, over the past ten years, the company has reinvested ~$230 million into the company, with its equity capitalization rising by $1.8 billion. That’s a 7.7X value creation multiple.
Over the past five years, the result is even more impressive. AAPL has been a phenomenal custodian of shareholder capital, with most of its EMVA created over just the past five years.
Company Filings
Expected Apple Returns
There are several ways to triangulate potential investment returns, starting with a company’s business model. In the case of Apple, that model begins with a current investor pre-tax equity rate of return of ~6%. Beginning with this number, predicted one-year returns might look as follows, assuming a stable share price multiple:

Author
To arrive at the above estimate, I am using approximate averages of recent share repurchases and earnings growth. Analyst consensus for 2023 is for little to no earnings growth, in which case the expected rate of return might fall to high single digits.
Another way to estimate total rates of return is to simply take the company’s current 0.64% dividend yield and add average EPS growth of ~9% (adding earnings growth to share repurchased percentages). While this gets to a high single digit rate of return, eliminating 2023 earnings growth would get you to a return in the area of low single digits.
A final way might be to simply take the AAPL dividend yield and then add the dividend growth, which has approximated 6% since 2020. That would deliver a high single digit rate of return.
In total, the estimated range of returns for 2023 might be expected to be from 7% to 14%, assuming a stable P/E multiple. What is the risk of multiple decline? The present multiple exceeds the ten-year average by 18%, but is actually slightly below the five-year average. Given the company’s business model improvements, the risks to valuation degradation do not appear excessive relative to the broader equities market.
Given the above analysis, it bears note that Apple’s share price is currently 15% over its starting 2023 $130 value, suggesting that the range of expected 2023 returns had already been breached during the month of January alone.
“If you aren’t willing to own a stock for 10 years, don’t even think about owning it for 10 minutes.” – Warren Buffett
The conclusion? Apple is simply one of the finest companies ever assembled and well worth owning over ten years. However, given its year-to-date appreciation, low dividend yield and a rising short-term interest rate environment, investors can be excused if they opt instead for fixed income alternatives as they wait to see if there might be a better price entry point. That said, Apple’s compelling business model and near impenetrable moat make the company a poster child for a “buy and hold” stock, meaning you won’t go wrong over the long term buying shares over time and dollar cost averaging.
Disclosure: I/we have a beneficial long position in the shares of AAPL either through stock ownership, options, or other derivatives. I wrote this article myself, and it expresses my own opinions. I am not receiving compensation for it (other than from Seeking Alpha). I have no business relationship with any company whose stock is mentioned in this article.

