Summary:
- Exxon has almost doubled in a year.
- The oil/gas situation is bullish, but XOM may be fully discounting it.
- I’ve changed my long position into a less aggressive short option position.
- Keep some dry powder in this sector for a bout of long liquidation.
jetcityimage/iStock Editorial via Getty Images
On July 30, 2021, I wrote a bullish article on (NYSE:XOM). This generated a lot of page views (for me anyway, since I usually write about off the run investments). It was also timed well; XOM has just about doubled since then. Total return, including reinvested dividends, is +91%. The purpose of this article is to reevaluate XOM and the oil + gas sector generally. In fact, what I write here also applies to the whole energy sector, including the ETF (XLE) and (OXY), which I also own.
The basic thesis of the article was that investment in upstream oil + gas had been too low for a number of years. Much of the reason was the rise of ESG and the idea of fossil fuels as the “new tobacco.” Since then, investment has increased, but not by that much. Here’s an updated graph from the International Energy Agency, in billions $US.
IEA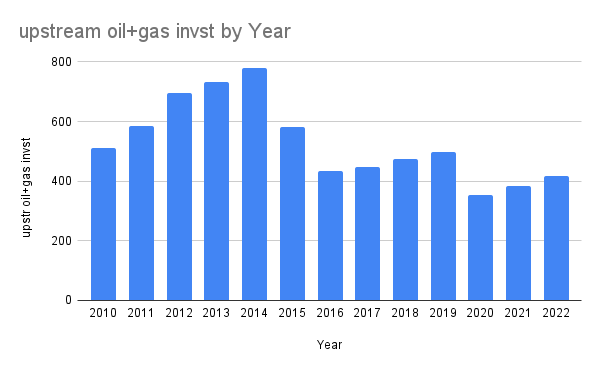
I do not think that oil investment has to get back to the levels of 2012. After all, the transition to carbon-neutral energy is a real thing. In particular, there will be a big increase in electric vehicles, and this will directly affect oil demand.
There’s more under the surface here than you might think. The only sector to recently (2019-2022) increase its investment is the Middle East national oil producers. Here’s another chart from the IEA:
The blue is investment in traditional energy; the green is clean energy. This means that an increasing proportion of oil and gas production will come from OPEC in the Middle East. This will increase their market power, and further stabilize oil prices at a high level. I read a lot of investment reports, and I have not seen this highlighted.
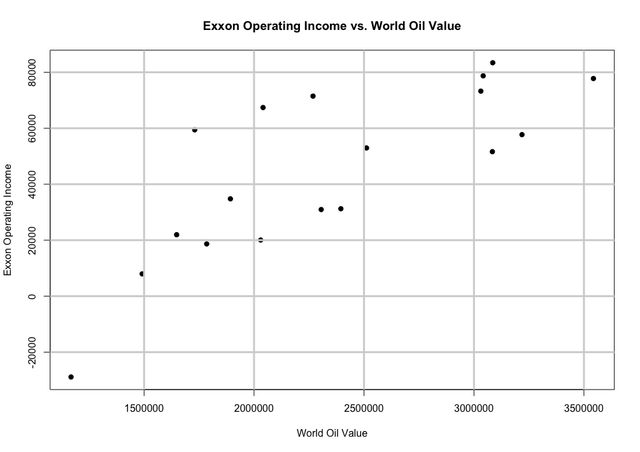
What does this mean for Exxon? In the original article, I graphed the relation between XOM’s operating income and total world spending on oil. Here’s that chart, updated with two more years:
The relationship is still pretty tight. With WTI at about $78/bbl now, this would imply opex of about $60 billion in 2023. That’s down from $77 billion in 2022, but still quite high.
So the underlying fundamentals of energy are still strong. However, I have changed my position, effectively reducing it by about 60%. Here’s why…
- Energy is no longer a hated sector. It was the best sector in 2022, and investors have taken notice. Also, the bloom is off the ESG rose. ESG portfolios basically overweight tech. I said in the last article that it’s easy to invest your politics when it’s making you money. It’s a lot harder when it’s costing you. So the sector has gotten a little crowded.
- These companies are no longer paying plus three sigma dividends. XOM is paying about 3%. That’s OK, but compare it to 4.75% on t-bills. At my first article, XOM was at 6% and t-bills just about 0%.
- Politics is turning against energy. The red blowout did not occur. I don’t believe that the taxes on buybacks will pass, but it will be a narrow defeat.
- My personal opinion is that the Chinese reopening will be less bullish for oil than expected. I believe the Chinese understand they have overbuilt residential and infrastructure. The bigger winners will be local Chinese services: health care, education, bars and restaurants. These are much less energy intensive than construction. Feel free to leave an argument in the comments if you disagree.
How Am I Trading It?
I’ve made three changes to my position. First, as I mentioned above, I have cut my total risk by 60%, and I am trading another 20%. One thing about crowded trades is that they can have sharp falloffs when the herd gets scared. I want to be able to buy into this.
Second, I have diversified. Besides XOM, I also have OXY. The theory is in the graphs below. Also, XOM is somewhat of an income stock, and I can’t see the point of 3% income.
Third, I have replaced outright longs with short OTM straddles. As I wrote in a piece on (JEPI), retail has been buying record amounts of options. I want to take the other side of this. I do delta hedging to keep my portfolio where I want it.
One last thing. In my recent articles, I displayed some graphs of cumulative alpha of the investments I was discussing. I’ve received a lot of favorable comment about this, both from SA members and others I know in the financial world. So I’ll put the graphs for XOM and OXY here. If you haven’t seen these graphs before, look at the aforementioned article on JEPI for an explanation.
author’s calculations author’s calculation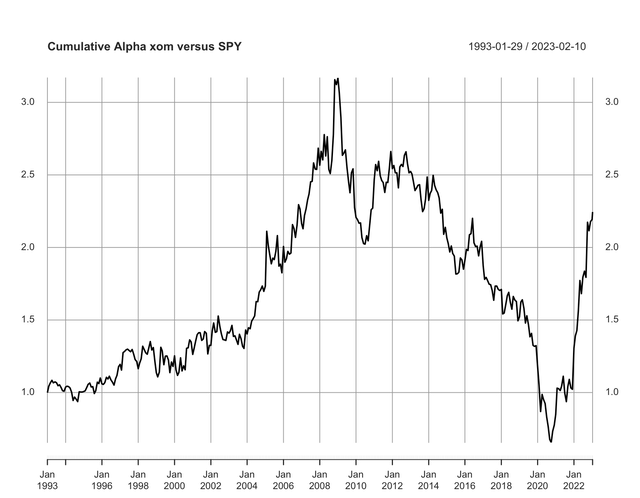
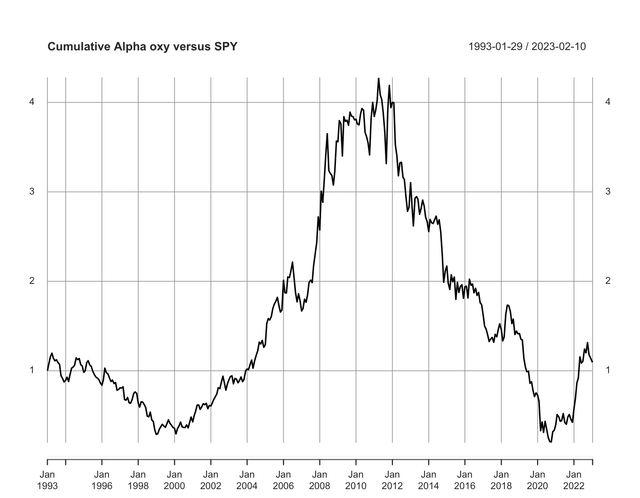
You can see why I diversified away from only XOM. XOM alpha is in the higher levels of its long term range. Alpha should be mean reverting in a free market. OXY still has some ways to go.
Disclosure: I/we have a beneficial long position in the shares of XOM, OXY either through stock ownership, options, or other derivatives. I wrote this article myself, and it expresses my own opinions. I am not receiving compensation for it (other than from Seeking Alpha). I have no business relationship with any company whose stock is mentioned in this article.
Additional disclosure: My long position is via options


