Summary:
- In 2023 it’s possible that crude prices could hit triple digits, creating trouble for stocks and bonds. Energy could be the No. 1 sector for a third straight year.
- XOM and CVX are the only two dividend aristocrats in the oil sector, and haven’t cut their dividends in over 100 years.
- Both have run circles around their global peers for decades, and both have plans to keep growing their dividends for decades to come.
- Both are AA-rated blue-chips with good long-term risk management and solid plans for the green energy transition which gives them solid growth outlooks for the next 30 years at least.
- But one has a slightly better balance sheet, management, long-term risk management, better transition plan, higher and safer yield, and far better growth prospects. Over the long term it could deliver 3X the income and returns of its rival, making it the better long-term, high-yield aristocrat buy.
R&A Studio
This article was published on Dividend Kings on Feb. 22, 2023.
It’s been a wild few years for all income investors, but especially energy investors.
During the Pandemic, we saw oil fall to $38. After the worst oil crash in human history, energy was the No. 1 performing sector in 2021 and 2022.
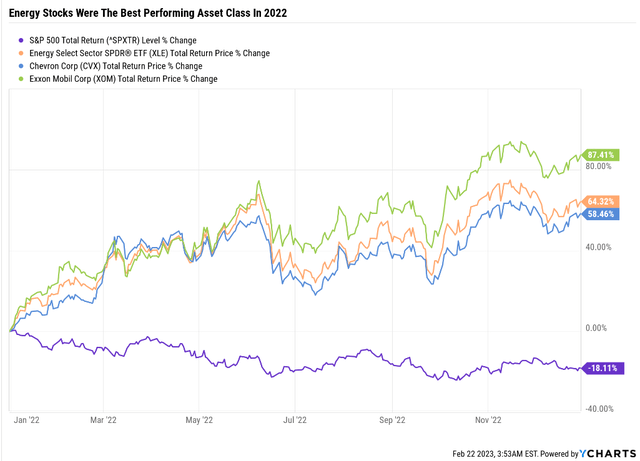
In fact, energy stocks were the best-performing asset class in 2022, a year when almost nothing worked.
Ycharts
After a decade of underinvesting in new oil production, the “revenge of the real economy” took hold, and oil prices soared.
Even after crude prices fell by nearly 50% from their post-Russian invasion highs, energy stocks remained red hot.
Ycharts
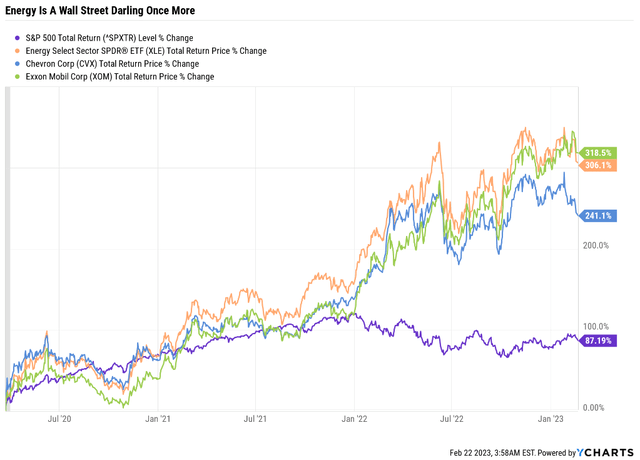
Off the Pandemic lows, oil stocks are up more than 300%, absolutely crushing the broader market.
Why? Because oil companies have gotten religion about capital discipline. Gone are the days when high prices meant companies like Chevron (NYSE:CVX) or Exxon (NYSE:XOM) would throw open the shale taps and flood the market with new supply.
Now it’s all about maximizing free cash flow and not production. Wall Street has fallen in love with the oil sector’s love of buybacks and fat dividends, and companies like Exxon and Chevron are providing both at record rates.
OK, but after two glorious years of soaring stock prices, is there still a reason to buy oil aristocrats like CVX and XOM?
The Case For Remaining Bullish On Chevron And Exxon
Thanks to China’s reopening after “COVID-zero,” some economists, such as UBS and Goldman, think that oil might soar back into the triple digits, potentially over $100 within a few months.
Why? Because the entire global energy industry is focused on maximizing profits, not production. When Russia announced it was cutting production by 500,000 barrels per day, OPEC shrugged and said it wouldn’t offset the cuts.
And despite record profits for US oil, producers are remaining focused on profits rather than increasing production.
China’s reopening is expected to increase global oil demand by about 1.5 million bpd starting in the second quarter. And Europe, China’s largest trading partner, is benefiting from increased Chinese demand and one of the mildest winters in years.
The European recession, which months ago seemed unavoidable, now looks like it might not happen at all. The global growth outlook has improved, and with it, expected oil demand.
- IEA estimates 1.9 million bpd oil demand growth in 2023
What happens when supply rises by around 2 million bpd and supply stays flat in one of the tightest oil markets in history? Potentially crude prices could soar 50% to 100%.
Does that mean they will double? No, that’s not how Wall Street or the real world work.
It’s very possible oil prices could fall a bit or trade in a range. In fact, oil prices are down six days in a row.
But if crude does end up climbing back to triple digits, that means bad news for inflation, interest rates, and likely great news for XOM and CVX shareholders.
Why Oil Is Once More The Ultimate Inflation Hedge
In early 2022 Deutsche Bank and Bridgewater put out reports saying their worst-case scenario was that high inflation would force the Fed to hike to 5% to 6% and create a severe recession, resulting in the S&P falling a peak 40% off record highs.
Given that the bond market expected the Fed to hike just 0.5% in all of 2022, this scenario seemed absurd.
CME Group
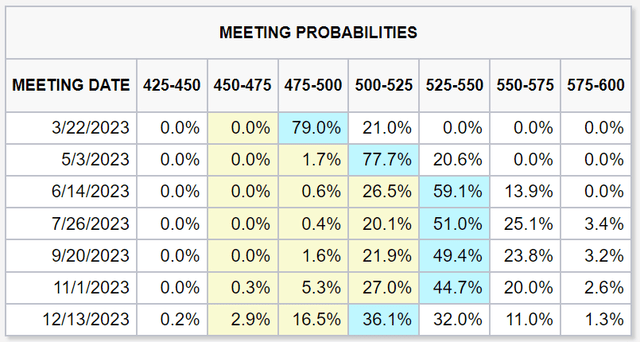
But here we are, with inflation proving sticky and the bond market now expecting the Fed to hike to 5.25% with a 28.5% chance it might go to 5.5%.
But the reason inflation is sticky, and the reason the Fed keeps hiking, is because the economy is too darn strong. Unemployment is at 54-year lows thanks to lots of baby boomer retirements during the Pandemic, a smaller labor force, and a sharp contraction in immigration.
Consumer spending is holding up, and that’s 70% of the US economy.
Even the housing sector is showing signs of rebounding, despite mortgage rates pulling back just 1% from 7% to 6%.
Over the last three weeks, the overall average of 18 economic indicators, which represent about 200 data points, has begun to accelerate.
This has given rise to the new “no landing” scenario, which is Apollo Management’s new base case.
- Soft landing: Inflation comes down without a recession, just a major slowdown
- Hard landing: Inflation comes down due to a recession
- No landing: The economy doesn’t slow down at all and keeps growing at 2% to 3%
In the 1990s, the US economy averaged 4% growth, and we had the best bull market in history with 6% 10-year yields. So the no-landing scenario isn’t as crazy as it sounds.
However, it’s not the overall economist consensus and three weeks of improving economic data doesn’t change the fact that recession risk, while falling, is still the most likely outcome.
But given that CVX and XOM could remain two of the best high-yield aristocrats during a no-landing scenario, let’s take a look at which of these legendary dividend aristocrats is the potentially better buy to protect yourself from potentially high oil prices and sticky inflation in 2023.
Chevron and Exxon: The Best Oil Giants You Can Own
Chevron and Exxon are legendary oil companies, part of the Standard Oil empire created by John Rockefeller in 1870.
Rockefeller was famous for his love of dividends, which is likely why these spin-offs from the breakup of standard oil in 1911 have the best dividend track records in the industry.
- CVX has a 36-year dividend growth streak and has paid uninterrupted dividends for 111 years
- XOM has a 40-year streak and has paid uninterrupted dividends for 142 years (since 1882)
That focus on dividends, built into the DNA of both companies, is likely why these have been the best-performing oil majors for decades.
Total Returns Since 1985

Portfolio Visualizer Premium
CVX and XOM are two of the few oil stocks to beat the S&P over the long term, despite the inherent volatility of oil prices.
That’s likely due to their incredible dividend dependability, which creates shareholder loyalty that no other oil stock enjoys.
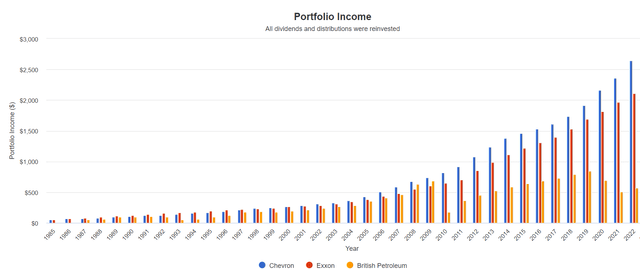
Dividends per $1,000 Initial Investment
Portfolio Visualizer Premium
Since 1986 the dividend income growth for CVX and XOM has been most impressive.
- 10.7% annually for CVX
- 9.7% for XOM
- 7.0% for BP
- 3.1% for S&P 500
The yield on cost for an investment in 1985 is now 211% for XOM and 264% for CVX.
What About Dividend Safety In The Future?
The Dividend Kings uses a 2,000-point safety and quality model incorporating over 2,000 metrics, including payout ratios, debt metrics, credit ratings, long-term risk management, and consensus future growth rates.
Exxon Dividend Safety
| Rating | Dividend Kings Safety Score (250 Point Safety Model) | Approximate Dividend Cut Risk (Average Recession) | Approximate Dividend Cut Risk In Pandemic Level Recession |
| 1 – unsafe | 0% to 20% | over 4% | 16+% |
| 2- below average | 21% to 40% | over 2% | 8% to 16% |
| 3 – average | 41% to 60% | 2% | 4% to 8% |
| 4 – safe | 61% to 80% | 1% | 2% to 4% |
| 5- very safe | 81% to 100% | 0.5% | 1% to 2% |
| XOM | 80% | 1.0% | 2.10% |
| Risk Rating | Medium Risk (49th S&P Global percentile risk-management) | AA- Stable Outlook credit rating = 0.55% 30-year bankruptcy risk | 10% or less max risk cape |
Long-Term Dependability
| Company | DK Long-Term Dependability Score | Interpretation | Points |
| Non-Dependable Companies | 20% or below | Poor Dependability | 1 |
| Low Dependability Companies | 21% to 39% | Below-Average Dependability | 2 |
| S&P 500/Industry Average | 40% to 59% | Average Dependability | 3 |
| Above-Average | 60% to 79% | Dependable | 4 |
| Very Good | 80% or higher | Very Dependable | 5 |
| XOM | 100% | Very Dependable | 5 |
Overall Quality
| XOM | Final Score | Rating |
| Safety | 80% | 4/5 safe |
| Business Model | 70% | 2/3 above-average |
| Dependability | 100% | 5/5 very dependable |
| Total | 90% | 11/13 SWAN aristocrat |
| Risk Rating |
3/5 Medium Risk |
|
| 10% OR LESS Max Risk Cap Rec |
15% Margin of Safety For A Potentially Good Buy |
Chevron Dividend Safety
| Rating | Dividend Kings Safety Score (250 Point Safety Model) | Approximate Dividend Cut Risk (Average Recession) | Approximate Dividend Cut Risk In Pandemic Level Recession |
| 1 – unsafe | 0% to 20% | over 4% | 16+% |
| 2- below average | 21% to 40% | over 2% | 8% to 16% |
| 3 – average | 41% to 60% | 2% | 4% to 8% |
| 4 – safe | 61% to 80% | 1% | 2% to 4% |
| 5- very safe | 81% to 100% | 0.5% | 1% to 2% |
| CVX | 90% | 0.5% | 1.50% |
| Risk Rating | Medium Risk (52nd S&P Global percentile risk-management) | AA- Stable Outlook credit rating = 0.55% 30-year bankruptcy risk | 15% or less max risk cape |
Long-Term Dependability
| Company | DK Long-Term Dependability Score | Interpretation | Points |
| Non-Dependable Companies | 20% or below | Poor Dependability | 1 |
| Low Dependability Companies | 21% to 39% | Below-Average Dependability | 2 |
| S&P 500/Industry Average | 40% to 59% | Average Dependability | 3 |
| Above-Average | 60% to 79% | Dependable | 4 |
| Very Good | 80% or higher | Very Dependable | 5 |
| CVX | 100% | Very Dependable | 5 |
Overall Quality
| CVX | Final Score | Rating |
| Safety | 90% | 5/5 very safe |
| Business Model | 70% | 2/3 above-average |
| Dependability | 100% | 5/5 very dependable |
| Total | 91% | 12/13 Super SWAN dividend aristocrat |
| Risk Rating |
3/5 Medium Risk |
|
| 15% OR LESS Max Risk Cap Rec |
10% Margin of Safety For A Potentially Good Buy |
How do these oil aristocrats compare to the world’s best blue chips?
- XOM is the 196th highest-quality company on the DK 500 Master List (top 39%)
- CVX is the 183rd highest-quality company (top 37%)
How impressive is it to score 61st and 63rd percentile on the Master List?
The Dividend Kings 500 Master List includes some of the world’s best companies, including:
- every dividend champion (25+ year dividend growth streaks, including foreign aristocrats)
- every dividend aristocrat
- every dividend king (50+ year dividend growth streaks)
- every Ultra SWAN (as close to perfect quality companies as exist)
- the 33% highest quality REITs according to iREIT
- 40 of the world’s best growth blue-chips
It means that even among the world’s best blue chips, XOM and CVX stand out in terms of safety, quality, and dependability.
These are true sleep-well-at-night high-yield blue-chips you can trust even in the most extreme economic and industry conditions.
Why Exxon And Chevron Are The Safest Big Oil Stocks
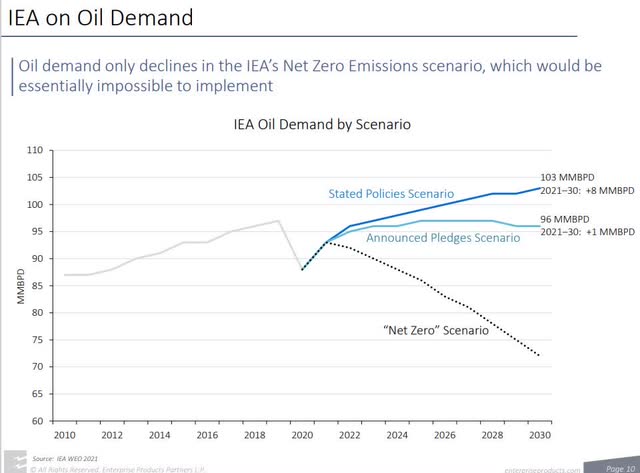
What about the end of oil? The green energy transition? Some politicians call for the US to get off oil within 10 years.
Enterprise Products Partners
According to the International Energy Agency, the global oil demand will remain stable or even rise through at least 2030.
Calpers, the California Pension giant which is on board with the green energy transition, says its base case is the transition will take 30 years, with a conservative case of 40 years.
Those politicians are posturing because, as we saw in Europe in 2022, the world still needs oil and gas to run the economy, feed its people, and not freeze in the winter.
- in Germany, green party politicians were calling for not shutting down nuclear power plants and even restarting coal plants to keep the lights on
Enterprise Products Partners
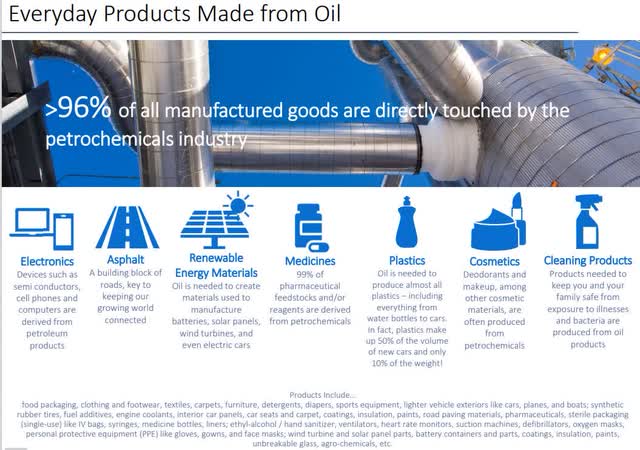
Petrochemicals are used in 96% of the products we use, including solar and wind. Stop using oil today, and the green energy transition will never happen.
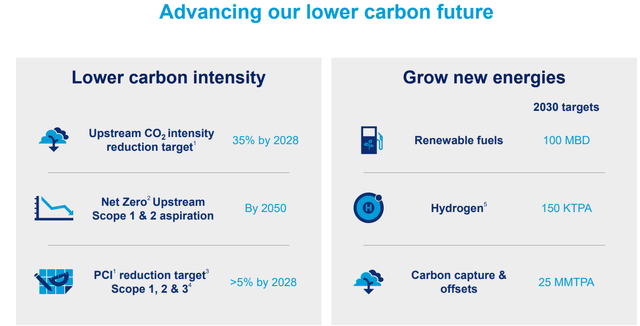
Chevron Has A Good Plan For A Green Energy Transition
Chevron investor presentation
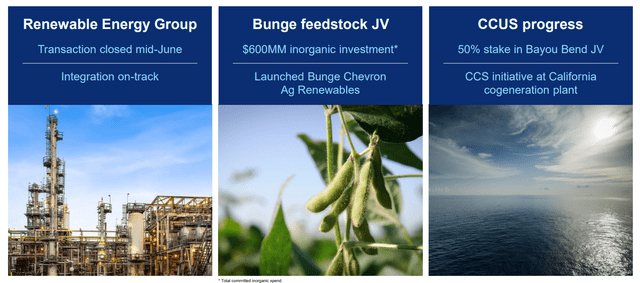
Chevron is investing billions into future energy, including hydrogen, biofuels, and carbon sequestration.
- Cummins estimates hydrogen (useful for cement and steel industries) could be a $3.5 trillion industry by 2030.
Chevron investor presentation
CVX is steadily buying the assets it needs to make the energy transition, while never forgetting what business is paying for all this green energy investment.
Chevron investor presentation
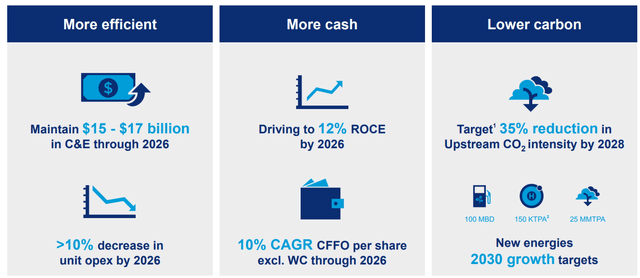
That’s part of its longer-term plan to grow cash flow per share by 10% while reducing emissions, maximizing profits, and showering investors with buybacks and dividends.
- CVX just authorized a $75 billion buyback
- enough for about 25% of existing shares
Chevron investor presentation
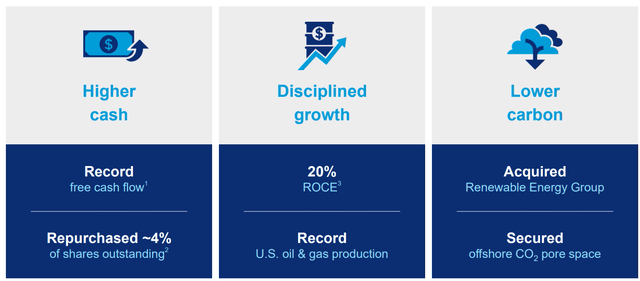
In 2022 alone, it repurchased 4% of its shares for $5.5 billion, going forward, analysts expect that to increase significantly.

DACF = debt-adjusted cash flow (FactSet Research Terminal )
Analysts expect CVX to buy back about 3X as much stock in the coming years, out through at least 2027.
At today’s valuations, that represents about 5% of shares each year for the next five years.
Meanwhile, its free cash flows are expected to remain above $20 billion annually, while its dividend costs $6.6 billion annually.
- 42% free cash flow payout ratio in 2024 vs. 40% safe per rating agency guidelines
Chevron investor presentation
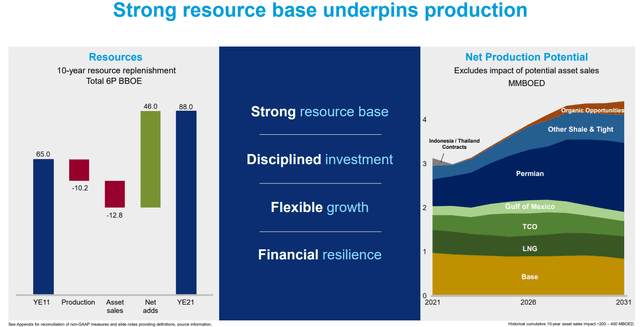
CVX is currently producing 3 million bpd and has the capacity to take that all the way to 4.5 million by 2031. When politicians say CVX isn’t investing in future production, that’s not true. It’s positioning itself to be able to increase production by 50%… if it makes economic sense.

FactSet Research Terminal
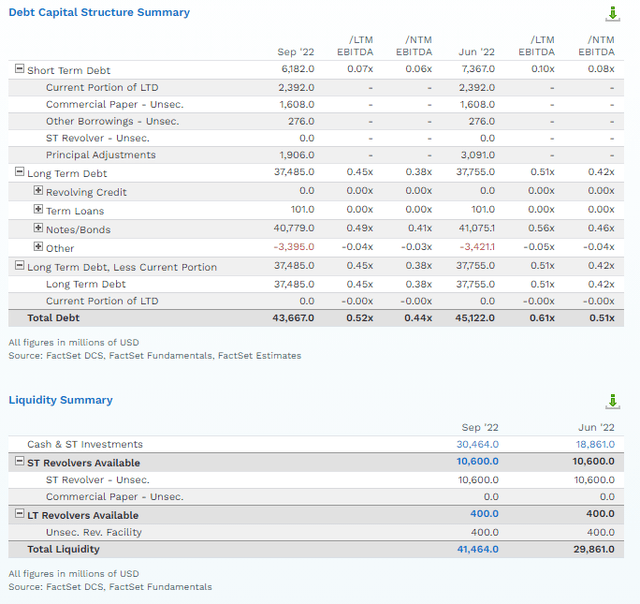
Chevron’s balance sheet is a fortress, with a debt/EBITDA or leverage ratio of 0.4X in 2022 and 0.34X expected in 2023.
- Net debt/EBITDA of 1.5X or less is safe according to rating agencies
CVX’s net debt/EBITDA ratio is 0.1, 15X better than the safety guideline.
It has $31 billion in short-term liquidity to execute on its plans, which involve investing about $14 billion per year in new production and green energy.
- CVX’s liquidity alone is enough to fund two years’ worth of growth plans
FactSet Research Terminal
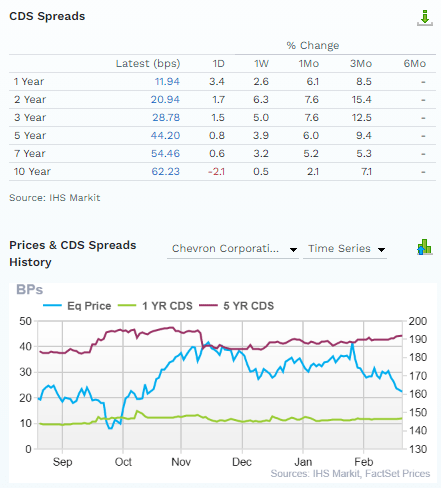
Credit default swaps or CDS are insurance policies bond investors take out against defaults. They trade daily and represent the “smart money’s” real-time default (bankruptcy) risk assessment.
The bond market estimates a 30-year default risk of about 1.8% for CVX, and the rating agencies even less.
- AA- stable credit rating = 0.55% 30-year default risk
The bond market is willing to lend to CVX at reasonable interest rates out to 2050, indicating that bond investors think CVX will be in business at least that long.
Exxon’s Plans For The Future
We positively view Exxon’s break from peers in avoiding investment in renewable power generation, where it lacks expertise, and it is difficult to carve out a competitive advantage. Instead, its investment in low-carbon solutions will focus on carbon capture, where it’s already a leader and where innovation could ultimately improve the competitive position of its existing operations by reducing emissions in specific projects. Although the technology remains expensive in most applications and currently is not viable to deploy on a large scale, Exxon’s investment of $15 billion by 2027 is measured.” – Morningstar
XOM’s green energy transition plans include small investments in biofuels, but primarily its focus is on carbon capture and sequestration, where it already has expertise.
How? Because CCS means capturing CO2 and pumping it back into the ground. That’s how enhanced oil recovery works, and XOM has been using that for decades. That’s why it has the logistics network to pipe CO2 to oil wells and sequester it.
- while enhancing oil production at the same time
XOM, like CVX, is planning to invest in green energy modestly compared to global peers, but that doesn’t mean that XOM, like CVX, doesn’t have plans to keep growing for decades to come.

FactSet Research Terminal
XOM is expected to spend a lot more on growth than CVX, about 50% more through at least 2027.
- $22 billion per year
Its free cash flow is expected to remain at least $34 billion through 2025, compared to $15.2 billion per year in dividends.
- 38% free cash flow payout ratio in 2026 vs 40% safe
Its buybacks are expected to be slightly more aggressive than CVX’s, totaling $87.5 billion through 2027.
- 19% of shares at current valuations, about 4% of shares repurchased each year
The XOM dividend is expected to grow 4.7% annually for the next few years, while CVX’s is expected to grow 5.2%.
Both companies must be careful not to grow the dividend too quickly, lest a future oil crash force them to cut them.
- XOM and CVX haven’t ever cut their dividends in over 100 years, and this conservative dividend growth strategy is why
FactSet Research Terminal
XOM’s net debt/EBITDA is 0.5X and expected to decline a bit in 2023.
That’s 5X higher net leverage than CVX, but still 1/3rd the safety guideline from rating agencies.
- XOM is AA- stable rated just like CVX
- 0.55% 30-year bankruptcy risk
XOM’s $41 billion in liquidity is enough to fund its growth plans for two years even if its cash flow fell to zero.
FactSet Research Terminal
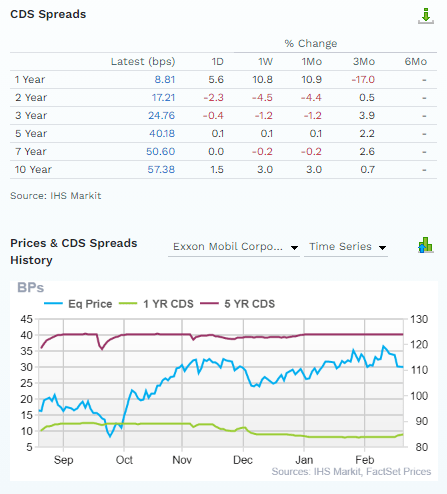
Bond investors estimate XOM’s 30-year default risk at about 1.7%, slightly lower than CVX’s.
Bond investors are willing to buy XOM’s 2051 maturing bonds at 5.1% yields, indicating strong conviction that XOM will still be around in three decades.
Long-Term Risk Management: How Well Are CVX and XOM Planning For The Future?
There are no risk-free companies, and no company is right for everyone. You have to be comfortable with the fundamental risk profile.
We all know the risk profiles of big oil.
- commodity price risk: oil, gas, and petrochemical prices can be crazy volatile
- regulatory risk: governments can impose carbon caps, carbon taxes, “windfall profit taxes”
- industrial accident risk: it can cost billions to clean up spills when they happen
- M&A execution risk: XOM is famous for some bad acquisitions in the past
- currency risk
How do we quantify, monitor, and track such a complex risk profile? By doing what big institutions do.
Long-Term Risk Management Analysis: How Large Institutions Measure Total Risk Management
DK uses S&P Global’s global long-term risk-management ratings for our risk rating.
- S&P has spent over 20 years perfecting their risk model
- which is based on over 30 major risk categories, over 130 subcategories, and 1,000 individual metrics
- 50% of metrics are industry specific
- this risk rating has been included in every credit rating for decades
The DK risk rating is based on the global percentile of how a company’s risk management compares to 8,000 S&P-rated companies covering 90% of the world’s market cap.
CVX Scores 52nd and XOM 49th Percentile On Global Long-Term Risk Management
S&P’s risk management scores factor in things like:
- supply chain management
- crisis management
- cyber-security
- privacy protection
- efficiency
- R&D efficiency
- innovation management
- labor relations
- talent retention
- worker training/skills improvement
- occupational health and safety
- customer relationship management
- business ethics
- climate strategy adaptation
- sustainable agricultural practices
- corporate governance
- brand management
| Classification | S&P LT Risk-Management Global Percentile |
Risk-Management Interpretation |
Risk-Management Rating |
| BTI, ILMN, SIEGY, SPGI, WM, CI, CSCO, WMB, SAP, CL | 100 | Exceptional (Top 80 companies in the world) | Very Low Risk |
| Strong ESG Stocks | 86 |
Very Good |
Very Low Risk |
| Foreign Dividend Stocks | 77 |
Good, Bordering On Very Good |
Low Risk |
| Ultra SWANs | 74 | Good | Low Risk |
| Dividend Aristocrats | 67 | Above-Average (Bordering On Good) | Low Risk |
| Low Volatility Stocks | 65 | Above-Average | Low Risk |
| Master List average | 61 | Above-Average | Low Risk |
| Dividend Kings | 60 | Above-Average | Low Risk |
| Hyper-Growth stocks | 59 | Average, Bordering On Above-Average | Medium Risk |
| Dividend Champions | 55 | Average | Medium Risk |
| Chevron | 52 | Average | Medium Risk |
| Exxon | 49 | Average | Medium Risk |
| Monthly Dividend Stocks | 41 | Average | Medium Risk |
(Source: DK Research Terminal)
CVX and XOM’s long-term risk management is similar to such blue-chips as:
- Brown-Forman (BF.B): Ultra SWAN dividend aristocrat
- Dover (DOV): Ultra SWAN dividend king
- NextEra Energy (NEE): Super SWAN dividend aristocrat
- Automatic Data Processing (ADP): Ultra SWAN dividend aristocrat
- Sysco (SYY): Ultra SWAN dividend aristocrat
The bottom line is that all companies have risks, and CVX and XOM are average at managing theirs according to S&P.
How We Monitor CVX and XOM’s Risk Profile
- 60 analysts
- three credit rating agencies
- 63 experts who collectively know this business better than anyone other than management
- and the bond market for real-time fundamental risk-assessment
When the facts change, I change my mind. What do you do, sir?” – John Maynard Keynes
There are no sacred cows at iREIT or Dividend Kings. Wherever the fundamentals lead, we always follow. That’s the essence of disciplined financial science, the math behind retiring rich and staying rich in retirement.
Which Is The Better Long-Term Buy?
What kind of returns can investors expect from buying CVX or XOM today?
Long-Term Consensus Total Return Potential
| Investment Strategy | Yield | LT Consensus Growth | LT Consensus Total Return Potential | Long-Term Risk-Adjusted Expected Return |
| ZEUS Income Growth (My family hedge fund) | 4.1% | 10.4% | 14.5% | 10.1% |
| Chevron | 3.8% | 10.0% | 13.8% | 9.7% |
| Vanguard Dividend Appreciation ETF | 2.2% | 10.0% | 12.2% | 8.5% |
| Schwab US Dividend Equity ETF | 3.6% | 8.6% | 12.2% | 8.5% |
| Nasdaq | 0.8% | 10.9% | 11.7% | 8.2% |
| Dividend Aristocrats | 1.9% | 8.5% | 10.4% | 7.3% |
| S&P 500 | 1.7% | 8.5% | 10.2% | 7.1% |
| Exxon | 3.3% | 6.8% | 10.1% | 7.1% |
| REITs | 3.9% | 6.1% | 10.0% | 7.0% |
| 60/40 Retirement Portfolio | 2.1% | 5.1% | 7.2% | 5.0% |
(Source: DK Research Terminal, FactSet, Morningstar)
Chevron yields more and is growing faster, thus offering nearly 4% higher long-term return potential.
Inflation-Adjusted Consensus Total Return Forecast
| Time Frame (Years) | 7.9% CAGR Inflation-Adjusted S&P 500 Consensus | 7.9% Inflation-Adjusted XOM Consensus | 11.6% CAGR Inflation-Adjusted CVX Consensus | Difference Between Inflation-Adjusted CVX Consensus And S&P Consensus |
| 5 | $1,465.25 | $1,459.83 | $1,728.00 | $262.74 |
| 10 | $2,146.96 | $2,131.10 | $2,985.97 | $839.01 |
| 15 | $3,145.84 | $3,111.04 | $5,159.74 | $2,013.90 |
| 20 | $4,609.44 | $4,541.59 | $8,916.00 | $4,306.56 |
| 25 | $6,753.99 | $6,629.95 | $15,406.81 | $8,652.82 |
| 30 (bond market time frame) | $9,896.29 | $9,678.60 | $26,622.89 | $16,726.60 |
(Source: DK Research Terminal, FactSet)
CVX is expected to run circles around XOM in terms of future returns and income growth.
| Time Frame (Years) | Ratio Inflation-Adjusted CVX Consensus/XOM Consensus | Ratio Inflation-Adjusted CVX Consensus vs. S&P consensus |
| 5 | 1.18 | 1.18 |
| 10 | 1.40 | 1.39 |
| 15 | 1.66 | 1.64 |
| 20 | 1.96 | 1.93 |
| 25 | 2.32 | 2.28 |
| 30 | 2.75 | 2.69 |
(Source: DK Research Terminal, FactSet)
CVX offers about 3X better return potential than the S&P and XOM, on top of a slightly higher and safer yield.
Historical Rolling Returns Since 1985

Portfolio Visualizer Premium
CVX’s historical returns are superior to XOM’s, BP’s, and the market’s.
Even if it doesn’t grow as quickly as management expects, it’s likely to be a better long-term investment.
Valuation: Both CVX and XOM Are Potentially Reasonable Buys
CVX Valuation Profile:
- quality score: 91% medium-risk 12/13 Super SWAN quality aristocrat
- current price: $161.00
- fair value: $161.17
- historical discount: 0.1%
- DK rating: potentially reasonable buy
- good buy price: $145.06 (10% discount)
XOM Valuation Profile:
- quality score: 90% medium-risk 11/13 SWAN quality aristocrat
- current price: $111.17
- fair value: $124.33
- historical discount: 10%
- DK rating: potentially reasonable buy
- good buy price: $105.68 (15% discount)
XOM is slightly more undervalued than CVX right now.
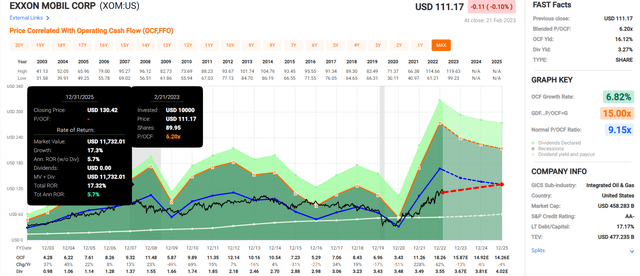
Exxon 2025 Consensus Total Return Potential
(Source: FAST Graphs, FactSet)
Exxon 2029 Consensus Total Return Potential
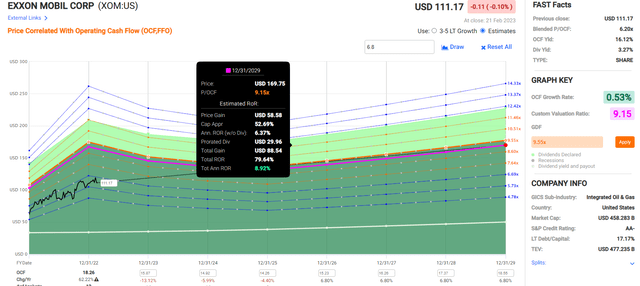
(Source: FAST Graphs, FactSet)
XOM offers about 2X the return potential of the S&P 500 through 2029.
Chevron 2025 Consensus Total Return Potential
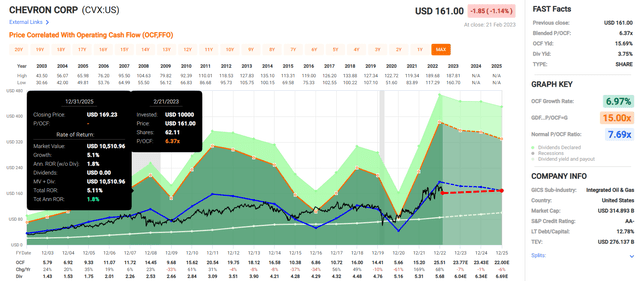
(Source: FAST Graphs, FactSet)
Analysts don’t expect much from CVX in the next few years due to a consensus decline in oil and gas prices.
Chevron 2029 Consensus Total Return Potential
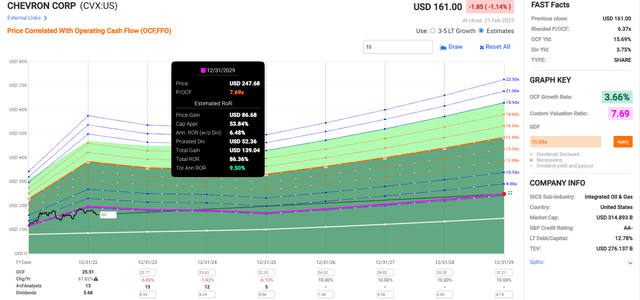
(Source: FAST Graphs, FactSet)
If CVX grows as expected and stays at historical fair value, it could nearly double over the next six years.
- 2X the S&P total return consensus
Keep in mind that oil prices are extremely volatile, and if crude goes over $100 then these consensus cash flow estimates will improve in the future.
Bottom Line: Chevron and Exxon Are The Best Oil Stocks You Can Own For The Long Term
Let me be clear: I’m not calling the bottom in XOM or CVX (I’m not a market timer).
SWAN and Super SWAN quality does NOT mean “can’t fall hard and fast in a bear market.”
Fundamentals are all that determine safety and quality, and my recommendations.
- over 30+ years, 97% of stock returns are a function of pure fundamentals, not luck
- in the short term; luck is 25X as powerful as fundamentals
- in the long term, fundamentals are 33X as powerful as luck
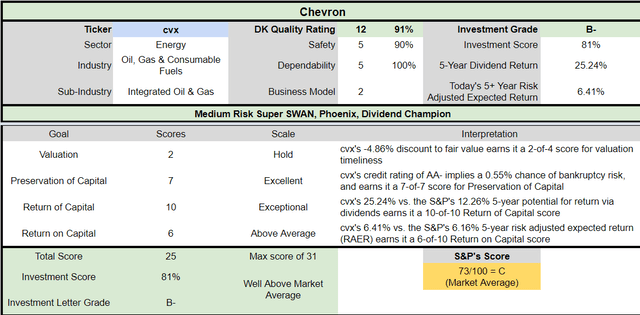
While I can’t predict the market in the short term, here’s what I can tell you about CVX and XOM.
- world-beater oil companies
- the only dividend aristocrats in the sector
- safe or very safe 3.3% to 3.8% yields with about 5% dividend growth over the next few years
- 10.1% to 13.8% long-term return potential Vs. 10.2% S&P
- fair value to 10% undervalued
- potentially reasonable buys
- 79% to 86% consensus return potential over the next six years, about 9% to 11% annually, about 2X the S&P 500
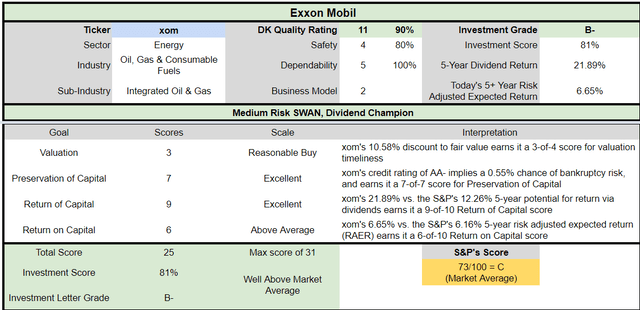
(Source: Dividend Kings Automated Investment Decision Tool)
(Source: Dividend Kings Automated Investment Decision Tool)
Both are fine inflation hedges for 2023 if oil prices spike higher.
And in the short term, XOM’s superior valuation makes it a potentially better buy.
But long term, I prefer Chevron for a few reasons:
- a slightly stronger balance sheet
- slightly better management
- slightly better long-term risk management
- a more diversified green energy transition plan
- faster-long-term growth outlook
- a slightly higher yield
- a slightly safer dividend
- slightly higher overall quality
For decades CVX and XOM have been outperforming their peers and the energy sector as well as the S&P 500.
I expect that to continue well into the future, along with the most dependable dividend growth in the industry.
You can’t go wrong with either, but CVX represents the better Buffett-style “wonderful company at a fair price” because of its slightly superior fundamentals.
Disclosure: I/we have no stock, option or similar derivative position in any of the companies mentioned, and no plans to initiate any such positions within the next 72 hours. I wrote this article myself, and it expresses my own opinions. I am not receiving compensation for it (other than from Seeking Alpha). I have no business relationship with any company whose stock is mentioned in this article.
—————————————————————————————-
Dividend Kings helps you determine the best safe dividend stocks to buy via our Automated Investment Decision Tool, Zen Research Terminal, Correction Planning Tool, and Daily Blue-Chip Deal Videos.
Membership also includes
-
Access to our 13 model portfolios (all of which are beating the market in this correction)
-
my correction watchlist
-
50% discount to iREIT (our REIT-focused sister service)
-
real-time chatroom support
-
real-time email notifications of all my retirement portfolio buys
-
numerous valuable investing tools
Click here for a two-week free trial, so we can help you achieve better long-term total returns and your financial dreams.
