Summary:
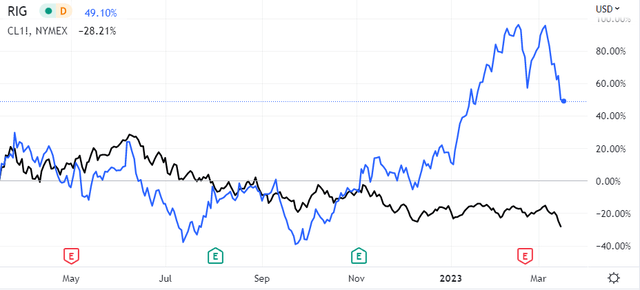
- RIG has rallied almost 100% while WTI crude oil has continued a shallow decline, losing 10% since late September 2022.
- Recently reported backlog additions do not reflect a turnaround, in my opinion; current backlog is similar to that reported since 2017.
- Based on current backlog, I believe RIG is unlikely to report a profitable quarter this year.
- I recommend investors sell RIG at its current price.
Lemon_tm
Background
This analysis is a follow-up to a previous analysis wherein the riskiest oilfield services investments were identified by screening for profitability followed by a multi-factor quality evaluation. In that analysis, Transocean (NYSE:RIG) rated very poorly with relation to the oilfield services sub-sector and its closest peers, offshore drillers
Recent Performance
In late September of last year, Transocean dropped to $2.35 and has rebounded to reach a new 52-week-high of $7.74 on March 7th. Most recently, RIG has retreated to its last close at $5.77.
RIG: Recent Performance vs Oil
More importantly, RIG has rallied almost 100% while WTI crude oil has continued a shallow decline, losing another 10% since late September 2022.
I believe RIG’s rally is based largely on overly rosy sentiment around recently reported contracts and backlog. However, RIG’s valuation is currently unsupported by fundamentals or future revenue.
Rosy Sentiment Is Based On Increased Backlog
Backlog is best understood as forward revenue based on future contracts awarded with set day rates and duration. RIG has most recently reported backlog of $8.5B vs $6.5B in early 2022. Several analysts have cited RIG’s increasing backlog as grounds for a “Buy” rating.
RIG Reported Backlog – February 2023
RIG Investor Presentation, 02/28/23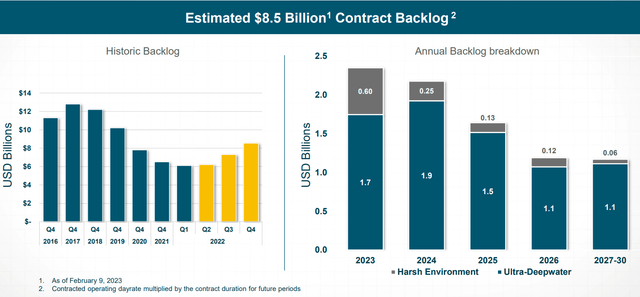
However, the $8.5B backlog reported above is spread out over eight years, with backlog of only $2.3 billion reported for 2023. Some investors and analysts have concluded that RIG has finally turned a corner and its long-awaited recovery is underway. A deeper look at RIG’s historical backlog suggests business as usual – underperformance and continuing disappointment for shareholders.
RIG Backlog: A Deeper Look
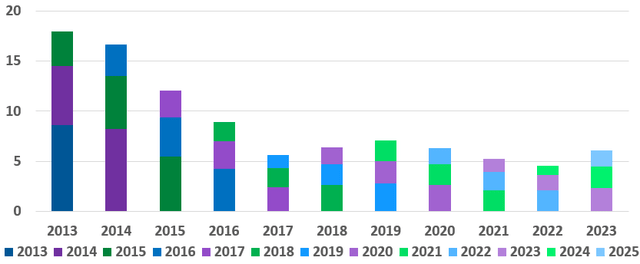
RIG investor presentations have been reporting backlog in a similar fashion for at least a decade. The plot below was assembled from investor presentations from early 2013 forward.
RIG 3YR Backlog: History
Reported backlog was tabulated for each 3YR forward period from 2013 to present. These data show a steep decline in expected revenue from 2013 to 2017. Although backlog has recently increased, current backlog remains historically low.
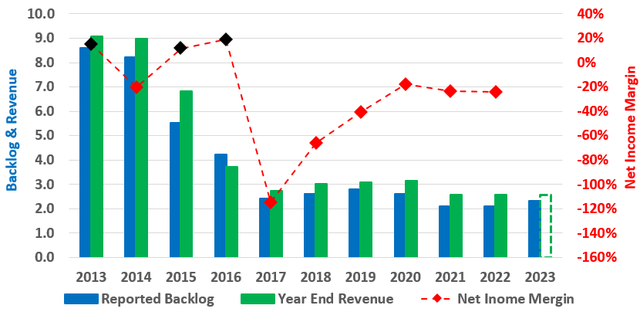
Historic Backlog, Revenue, and Net Income Margin
The good news is RIG has done a great job at converting reported backlog (blue columns) to revenue (green columns) in each of the last ten years. In fact, over the last five years, year-end revenue has averaged 118% of reported backlog. Based on that trend, 2023E revenue is estimated at $2.7B (dashed green column) and will likely miss the consensus estimate of 3.03B.
The bad news is RIG has reported losses on revenue between $2.6 and $3.2B every year since 2016. Most recently, RIG reported 4th quarter losses of $0.49/share on revenue of $606M, with a miss of $14.89M.
Relative Valuation
RIG and its offshore drilling peers were evaluated using a quality matrix with factors including Price/Sales, Net Income Margin, Free Cash Flow Margin, and Debt to Equity. The values for each provider’s factors were normalized by means of statistical percent ranking with relation to the group. The quality matrix for each driller was calculated as the sum of the percent ranks of each factor.
Offshore Drillers: Quality Matrix Chart
(RIG) tied with (VAL) for 3rd place behind (NE) and (DO) while outscoring only (BORR).
Quality Matrix Plot
Author, SA Data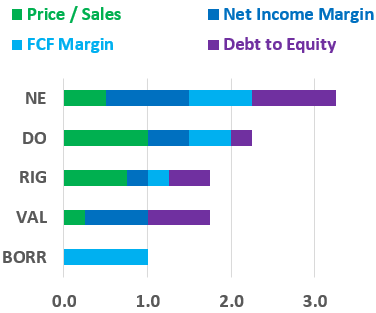
The quality matrix is presented graphically in the stacked bar chart to the left. Although RIG has the second-best valuation score, it ranked in the lower half for profitability, free cash flow, and debt.
Fair Value Estimate
Assuming that the sector as a whole is fairly valued, RIG’s four peers were selected for relative valuation based on EV/Sales.
RIG: Estimated Valuation
The average comparable EV/Sales was 3.89 compared to RIG’s current figure of 4.65. EV, Market Cap, and Share Price were estimated as follows:
- EV = Average Peer EV/Sales * Estimated 1Q 23 Revenue * 4
- Market Cap = EV – Net Debt
- Estimated Share Price = Estimated Market Cap/Outstanding Shares
Based on the peer average EV/Sales and estimated 1Q 23 revenue, RIG’s fair value share price was estimated at $3.90.
Conclusions and Recommendations
I believe that RIG’s recent rally is based on momentum and overly optimistic sentiment regarding reported backlog. When viewed historically, the current backlog represents neither a turnaround nor substantially increased future revenues. RIG has reported losses each quarter since early 2017 with similar backlog. Based on current backlog, RIG is unlikely to report a profitable quarter in 2023.
Finally, RIG’s current share price is 47% higher than its estimated fair value based on comparable peers’ EV/Sales and estimated 1Q 23 revenues. I expect sentiment to cool and RIG to decline from its current level of $5.77 towards its estimated fair value under $4.00 over the next several weeks. I recommend investors sell RIG at its current price.
Information is a source of learning. But unless it is organized, processed, and available to the right people in a format for decision making, it is a burden, not a benefit. – William Pollard (Physicist and Theologian)
Disclosure: I/we have no stock, option or similar derivative position in any of the companies mentioned, but may initiate a beneficial Short position through short-selling of the stock, or purchase of put options or similar derivatives in RIG over the next 72 hours. I wrote this article myself, and it expresses my own opinions. I am not receiving compensation for it (other than from Seeking Alpha). I have no business relationship with any company whose stock is mentioned in this article.

