
Summary:
- Nvidia is trading at valuations on par with some of the biggest bubbles in US history, with a Price/Sales ratio of 25x and Price/Free Cash Flow ratio of 175x.
- Such extreme valuation ratios are rare for large established companies as growth is a declining function of market size, suggesting equity losses are likely even if earnings grow rapidly.
- Reasonable assumptions put the fair value of Nvidia at $64 billion, 90% below current levels.
Justin Sullivan
The extreme valuation of Nvidia’s (NASDAQ:NVDA) stock suggests holders are likely to experience negative returns for years if not decades to come as they learn first-hand that great companies do not always make great investments. The 34% decline in Tesla’s (TSLA) share price since its peak valuation in January 2021, despite a 13-fold rise in earnings, should be a warning sign, as should the performance of Cisco (CSCO) following the dot com bubble peak. Nvidia is trading at similarly extreme levels as we saw at these bubble peaks, with a price-to-sales ratio of 25x and a price to free cash flow ratio of 175x.
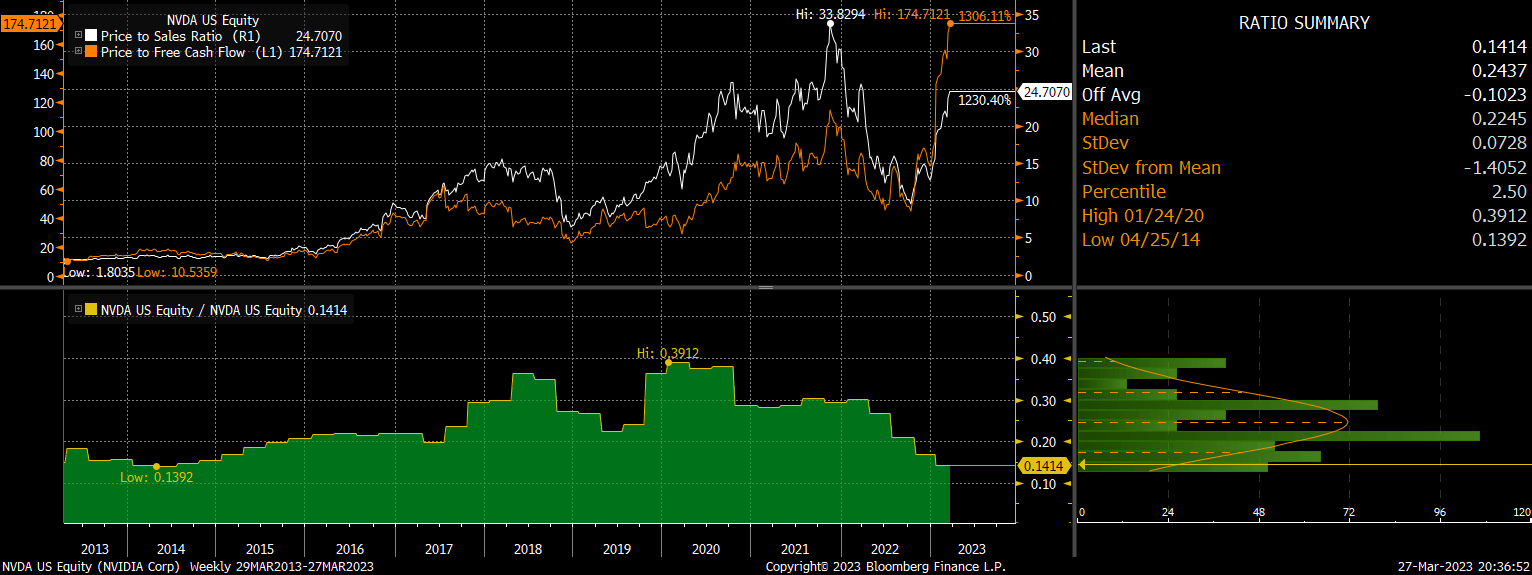
Nvidia P/FCF and P/S Ratios (Bloomberg)
Nvidia is not a small startup. Its sales amounted to $27bn over the past year, while its free cash flow came in at $3.8bn, reflecting a free cash flow margin of 14%, which is higher than the NDX average of 12%. Such extreme valuation ratios are rare for large established companies as growth is a declining function of market size. As I argued in the case of Tesla a few years ago (see ‘3 Problems With Tesla’s Valuation), such valuation metrics can only be justified by assuming unrealistic earnings growth expectations. Not only because of the high valuation itself, but also because it takes time for these earnings to grow and there is a time value of such money, particularly at today’s interest rates. In fact, as I argue below, even if Nvidia manages to replicate the growth seen in Apple’s revenues and earnings over the past 20 years, the stock may still be overvalued today.
What Is Nvidia’s Fair Value?
In order to calculate the fair value of a growth stock we need to make a number of assumptions about the required rate of return, expected revenue growth, an estimate of the profit margin that can be sustained over the long term, the expected growth rate at which the company will grow once it reaches maturation, the time it takes for the company to reach a large enough size that growth slows to the pace of the overall economy, and a dividend payout ratio that the company will sustain over the long term. In the case of Nvidia I will make the following assumptions:
Required rate of return: 10%. This is derived from the historical average equity risk premium of 5% plus the yield on Nvidia’s 10-year bonds of 5%.
Revenue Growth: 20% Revenue growth has averaged 20% annually over the past decade and I will assume it can continue this rate over the next decade after which growth slows to the pace of nominal GDP.
Sustainable Profit Margin: 14%. Nvidia’s free cash flow margin is 14% at present and I will assume it remains at this level as revenues rise.
Nominal GDP Growth: 3%. This combined my forecast for real GDP growth to average less than 1% and 10-year breakeven inflation expectations of just above 2% (see ‘Zero Percent Long-Term Growth Is A Real Possibility‘).
Time To Maturation: 10 years. I will assume that Nvidia can grow its revenues rapidly for 10 years, after which the growth rate will slow to that of the overall market and nominal GDP.
Dividend Payout Ratio: 50%. I will assume that Nvidia pays out 50% of its free cash flow to shareholders, in line with the overall market.
These assumptions put the fair value of Nvidia at $64bn, 90% below current levels. The calculation is as follows.
1: Free Cash Flow in 2033 = ((Current Revenues * (1+ Revenues Growth Rate ^ 10 Years) * Free Cash Flow Margin
(26.8*1.2^10)*0.14 = $23.3bn
2: Price/Free Cash Flow in 2033 = 100 / (Required Rate of Return – Nominal GDP Growth) * Dividend Payout Ratio
100/(10-3) * 0.5 = 7.1x
3: Fair Value in 2033 = Price/Free Cash Flow in 2033 * Free Cash Flow in 2033
7.1*23.3 = $166bn
4: Fair Value Today = Fair Value in 2033 / (1+Required Rate of Return) ^ 10 Years
166/(1.1)^10 = $64bn
The following table shows how the fair value of Nvidia declines as we adjust the assumptions to become more favorable, by lowering the required rate of return, raising nominal GDP growth, raising the free cash flow margin, or raising the revenue growth rate over the next decade. Even if we assume that Nvidia’s free cash flows grow at 29% for a full decade and 5.5% thereafter, a required rate of return of just 7.5% would still make Nvidia’s stock overvalued today.
| Revenues Today ($bn) | 26.8 | 26.8 | 26.8 | 26.8 | 26.8 | 26.8 |
| Free Cash Flows Today ($bn) | 3.8 | 3.8 | 3.8 | 3.8 | 3.8 | 3.8 |
| Required Rate of Return, % | 10 | 9.5 | 9 | 8.5 | 8 | 7.5 |
| Long Term Nominal GDP Growth, % | 3 | 3.5 | 4 | 4.5 | 5 | 5.5 |
| Dividend Yield in 2033 | 7.0 | 6.0 | 5.0 | 4.0 | 3.0 | 2.0 |
| Price/Free Cash Flows in 2033 | 7.1 | 8.3 | 10.0 | 12.5 | 16.7 | 25.0 |
| Free Cash Flows In 2033 ($bn) | 23.2 | 27.0 | 31.3 | 36.1 | 41.5 | 47.4 |
| Revenues in 2033 ($bn) | 166 | 180 | 196 | 212 | 230 | 250 |
| Free Cash Flow Margin, % | 14 | 15 | 16 | 17 | 18 | 19 |
| Revenue Growth to 2033, % | 20 | 21 | 22 | 23 | 24 | 25 |
| Free Cash Flow Growth to 2033, % | 20 | 22 | 24 | 25 | 27 | 29 |
| Fair Value Market Cap in 2033 ($bn) | 166 | 225 | 313 | 451 | 691 | 1186 |
| Fair Value Market Cap Today ($bn) | 64 | 91 | 132 | 200 | 320 | 575 |
| Current Market Cap ($bn) | 661 | 661 | 661 | 661 | 661 | 661 |
Source: Bloomberg, Analyst Calculations
Even A Repeat Of Apple’s Success May Not Result In Strong Returns
Artificial Intelligence is now seen as potential game changing technology, and Nvidia is seen as well placed to benefit from the boom in hardware demand. Investors may see Nvidia now as similar to Apple (AAPL) in the mid-2000s, with the potential for a surge in AI-driven demand to replicate the smartphone boom experienced by Apple. At the beginning of 2006, Apple’s revenues were similar to Nvidia’s today as a share of the overall market, and its profit margin was also similar. Apple was able to generate 30% annualized revenues growth and 40% free cash flow growth over the next decade, before growth began to converge towards nominal GDP in 2016. Over this 10-year period Apple’s stock posted annual returns of 27%.
Even if Nvidia manages to replicate such an incredible boom in free cash flows, it may still result in poor long-term returns for the stock. The reason being that in 2006 Apple traded at a price to free cash flow ratio of just 26x and ended 2015 at a ratio of just 10x. If Nvidia were to grow its free cash flows by 40% annually over the next decade and the price-to free cash flow yield were to fall to 10x over this period, this would result in just 5% annual gains in Nvidia’s stock price, which is no higher than the company’s 10-year bond yield.
Cisco Provides A Cautionary Tale
The performance of Cisco’s share price following the dot com bubble provides a cautionary tale for investors buying Nvidia today. Cisco traded at a price-to-free cash flow ratio of 200 at its peak in 2000, similar to Nvidia’s today. Over the following 9 years free cash flows per share rose an annualized pace of 18%, as the growth story that many anticipated came to fruition amid the internet revolution. Over this period the stock fell by 83% to its 2009 lows as its price-to-free cash flow ratio fell to just 7.5x. Furthermore, despite the stock having recovered strongly since then, it has still lost 72% versus US Treasuries since its 2000 peak as shown below.
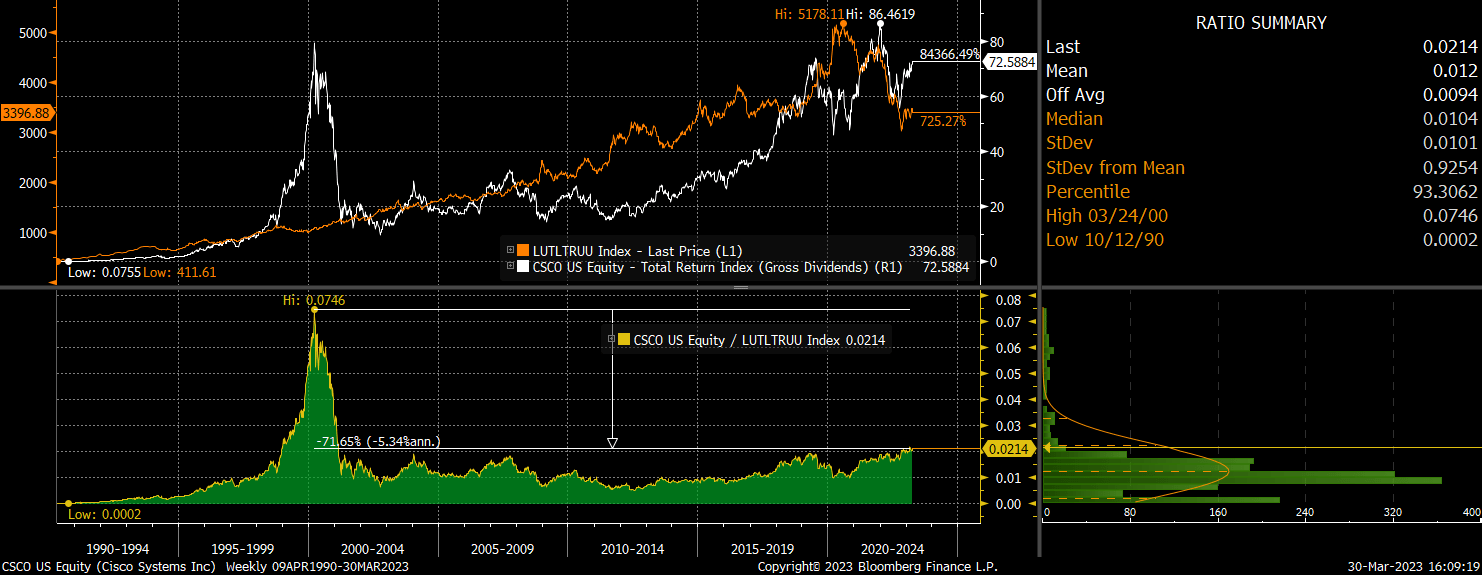
Ratio of Cisco over US Long-Term Treasuries, total return (Bloomberg)
How Did We Get To Such Extreme Valuations, And What Could Trigger A Reversal?
The combination of speculative trading activity, particularly in options markets, and the allure of a new game-changing technology often come together to create spikes in stock prices that are far out of line with any fundamental developments. As a stock’s price rises, its gain attracts attention and strengthens the credibility of the underlying bullish story, which creates further buying interest. When a high volume of option trading takes place as in the case of Nvidia currently, this adds fuel to the fire as relatively small amounts of individual capital can have an outsized impact on prices.
We often see investors abandon traditional valuation methods or ignore valuations altogether when a fashionable stock such as Nvidia rallies significantly beyond its earnings potential. Many recent articles on Nvidia do a good job of explaining why the company will grow strongly, yet ignore the issue of valuation.
While I have no idea what could act as a pin to burst Nvidia’s bubble, the rapid increase in prices, widespread bullish sentiment, and slowing growth, compound the risks posed by extreme valuations. I am selling out of the money calls options on the stock as a way of generating income from high implied volatility. June 16 at-the-money calls on Nvidia trade at $2,570, which translates to an annualized premium of over 40%. The risk is that we see the stock continue to soar higher at an even faster annualized pace, which could occur in the event of a gamma squeeze as we saw in November 2021 (see ‘Nvidia Stock: Big Gains Will Not Last‘).
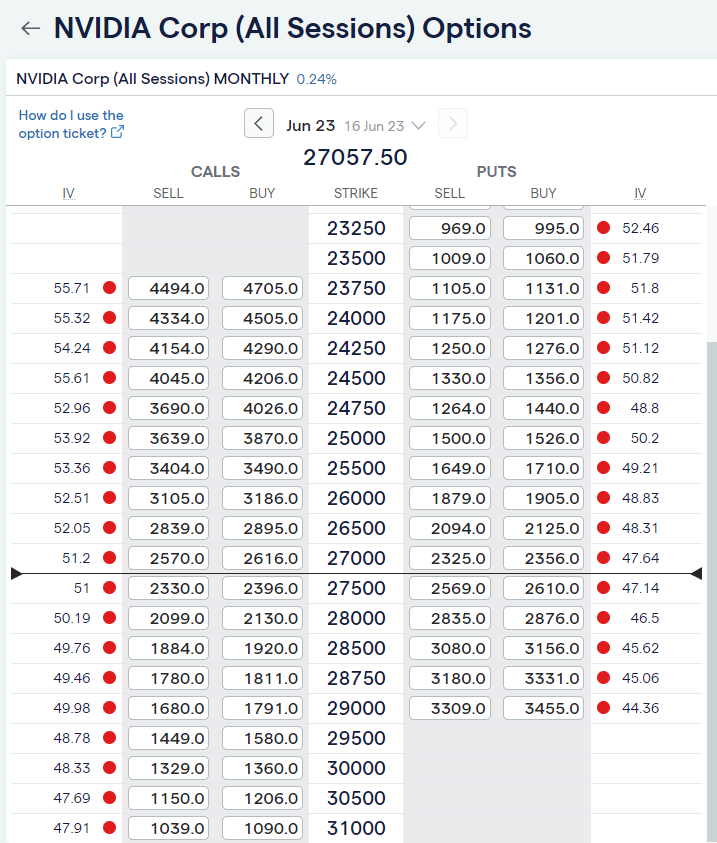
Nvidia Option Prices (IG)
AI Driven Productivity Boom Is A Potential Upside Risk
From a long-term perspective the main risk is that Nvidia’s sales and earnings can deliver rapid growth over many decades, which could conceivably be the case if artificial intelligence can generate the game-changing productivity boom that many proponents expect. This article citing Goldman Sachs argues that AI could boost US productivity by 1.3% annually and global growth by 7% annually over the next decade. If Nvidia were able to play a key role in this growth, then it is possible that the earnings will eventually catch up with current valuations. However, productivity growth has remained on its long-term trend over the past two decades despite such factors as the mass adoption of the internet and smartphone, and the entrance of hundreds of millions of Chinese workers into the labor market. It would be a very welcome surprise if AI was able to reignite productivity growth, but low savings rates and declining economic freedom will act as major headwinds to this as I argued in ‘Zero Percent Long-Term Growth Is A Real Possibility’.
Disclosure: I/we have a beneficial short position in the shares of NVDA either through stock ownership, options, or other derivatives. I wrote this article myself, and it expresses my own opinions. I am not receiving compensation for it (other than from Seeking Alpha). I have no business relationship with any company whose stock is mentioned in this article.