Summary:
- This analysis is the third in a monthly series of long-term, business model-centric views based on my Value Equation framework.
- Shareholders who have held Walmart for the past five years have done well (>12% annually).
- The question for investors today is whether the current dividend yield, cash flow growth, and after-tax equity return is enticing.
patty_c
This analysis is the third in a monthly series of long-term, business model-centric views based on the Value Equation framework I devised, successfully used as a founder and CEO of multiple public companies and addressed in a book by the same name. The equation reduces companies to six universal variables to compute current equity returns, which are foundational to corporate valuation and long-term shareholder wealth creation.
Founded by Sam Walton in 1969 in Bentonville, Arkansas, Walmart (NYSE:WMT) is the nation’s largest retailer having more than 10,600 locations across the United States and internationally. The company retains the title of having the most revenues of any company globally, the most employees globally, and the most employees in the United States. The iconic company is the single largest employer in 22 states, with the founding Walton family controlling over half the voting shares while holding onto seven spots in the Forbes 400 list of wealthiest Americans. If he were alive, founder Sam Walton would have celebrated his 105th birthday on March 29, while being the world’s richest person. Creating more than $200 billion in personal wealth through retail innovation and disruption ranks among the single greatest achievements in business.
The question is whether this company is worth holding today. I say no. There are far better and less risky places to put your money.
Walmart’s Value Equation
At a high level, there are six corporate business model variables that combine to deliver equity returns. For seasoned and mature companies like Walmart, the lion’s share of shareholder returns can be expected to come in the form of a current return. Return growth, which comes from cash flow reinvestment into expansion together with same-store earnings growth, will generally be less.
What follows is Walmart’s business model and results viewed over the past ten years:
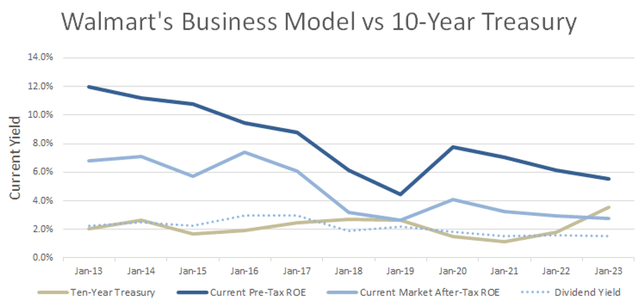
Over the past decade, the company’s current after-tax returns on its cost-basis equity investment have fallen from around 8% to the most recent January 31, 2023 annual report indicating a current after tax equity return rate of under 4%. The main culprit has been a persistent decline in the company’s operating profit margin, falling from over 8% to under 5.45%. I compute the operating margin before lease expense, since the company pays more than $3.2 billion annually in rents associated with leasing approximately 40% of is locations and two thirds of its distribution facilities. This means that I added the approximate cost of leased real estate to business value in computing a fully loaded sales/business investment ratio. The formula will work fine without doing this, but the sales/business investment ratio will be distorted since the use of leases will shave off approximately 15% of the company’s asset requirements while depressing operating margins by including real estate rents.
Including leased real estate as a form of financing, Walmart today is funded with a mix approximating 75% equity and 25% debt and leases, or what I like to call other people’s money (OPM). The slightly elevated equity mix has had a minimal impact on the decline in equity returns because the blended cost of leases and borrowings are not materially different from the company’s current unlevered equity return. That blended cost of 5.2% is comprised of leases (I estimated a blended developer yield of 6%) and lower cost borrowings. The company’s low leverage and large size are foundational to its rare AA corporate credit rating.
One of the variables impacting Walmart’s equity returns is the amount of maintenance capital expense. Over the past decade, the company’s store count has declined from a high of 11,781 in 2018 to 10,410 for its recent fiscal year ended January 31, 2023. This means that the company’s 2023 capital expenditures of $16.8 billion were virtually all maintenance capital expenditures. More than this, the company took over $14 billion in charges between 2018 and 2021 for store and market closures in the UK, Japan, Argentina and Brazil. Inclusive of accumulated depreciation, the loss on cost would have likely been much higher. Store closures and relocations come standard with seasoned retailers and I normally include the cost associated with this activity as an addition to maintenance capital expense. Simply smoothing the $14 billion over the decade reviewed results in an approximate 0.3% of added business investment to account for likely losses.
Companies having the finest business models tend to have the highest unlevered current rates of return. In the case of Walmart, the simple computation would be as follows:
Overlaying the company’s OPM capital stack mix onto its unlevered return completes the Value Equation and looks like this:
Multiply the current pre-tax rate of return by (1 – Tax Rate) and you arrive at a current after-tax rate of return on cost of 3.84%. Assuming you could buy shares of Walmart at their cost, that would be your rate of return in year 1. Your total expected rate of return would be equal to your year 1 rate of return plus expected annual growth.
With most well-known and large cap companies, you will be unable to buy in at original cost and Walmart is no exception. The delta between a company’s equity capitalization and its cost basis equity is called equity market value added (EMVA). In the case of Walmart, its EMVA stands at about $111 billion, or an equity markup of 39% above its original cost. As a current Walmart shareholder, this markup lowers your current equity rate of return to approximately 2.75% (3.84% / 1.39).
In our elevated interest rate environment, Walmart’s current shareholder equity rate of return of around 2.75% seems low and it is. With the exception of 2019, the 2023 current shareholder equity rate of return is the lowest it has been over the past decade.
Historical Performance in Charts
Using a financial approach to compute a current equity rate of return for shareholders should approximate an Earnings/Price yield, which it does. The advantage of using The Value Equation approach is to dissect the company business model to see how it gets there. Digging into the numbers helps you to determine whether Walmart is a company you would like to own. As Warren Buffett has said often, his approach is not to think of himself as a stock picker, but as a buyer of companies. That is The Value Equation approach. Whether forming a company yourself or investing in a company, the business model dynamics that collectively work to create shareholder wealth are the same.
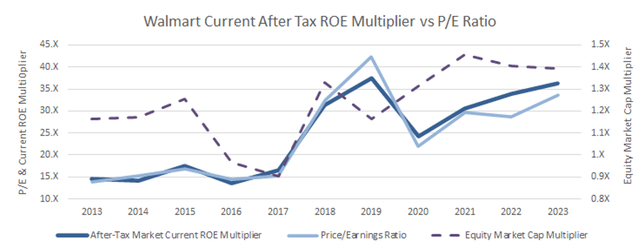
The following chart overlays Walmart’s annual Price/Earnings multiple onto the company’s market after tax equity current rate of return expressed as a multiplier (1/the after-tax market current return). Walmart presently trades at a P/E multiple of more than 33X, which is historically high. Since the “E” part of a P/E multiple is based on accounting earnings and not corporate cash flow, it will aways be wrong, though it may be close. Peeling back the financials to get an after-tax multiplier shows that the real multiple shareholders are getting is about three turns wide, or about 36.4X.
Between 2016 and 2017, you could have purchased shares in Walmart with an equity capitalization multiplier below 1X, meaning you could have purchased the company at below its cost to create. After 2017, the company’s Price/Earnings multiple steadily rose while its underlying business model was getting worse. The combination of the two trends brought the company to where it is today, with shareholders pricing the stock to accept the lowest current shareholder returns in recent history.
Walmart’s business model erosion and record low current shareholder market rates of return would make an investor consider investing elsewhere in any market. That it is happening at a time of record interest rates highlights the disconnection between price and value. The current dividend yield of 1.6% is about half that the Ten-Year Treasury rate, with its annual growth trending inside of 2% annually.
Walmart’s Use of Cash
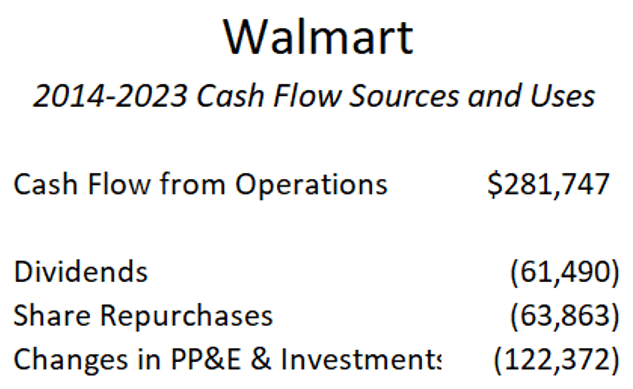
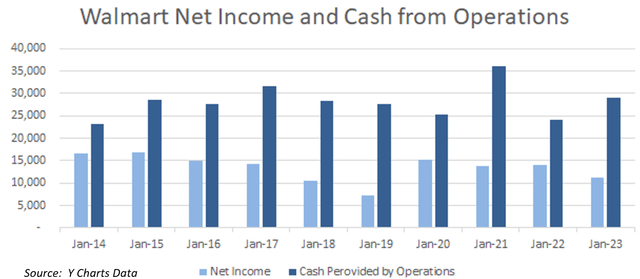
Of the roughly 2.75% market shareholder yield produced by Walmart, approximately 1.6% is distributed in the form of dividend distributions. The remainder has been used to repurchase shares and support annual capital expenditures. The following table illustrates the company’s principal sources and uses of cash over the past ten years.
Cash Flow Growth
Between 2014 and 2023, Walmart generated over $281 billion from operations. Cash from operations was largest in 2021, concurrent with a reduction in international locations. Over the ten-year period, compound annual cash flow growth through 2023 amounted to approximately 1.3% annually, or slightly lower than the company’s annual dividend growth, which has trended inside of 2% annually.
Share Repurchases
Between 2014 and 2023, Walmart repurchased nearly 17% of its outstanding shares. Absent the shares bought between 2016 and 2017, the company’s current yield on the company’s share repurchases have been below overall corporate returns. This raises the question of whether shareholders would have been better off with elevated dividends as opposed to share repurchases. The answer is probably tied to tax considerations. Earnings per share growth arising from share repurchases is not taxable, while elevated dividend distributions are. So, the decision to repurchase shares favors Walmart’s taxable shareholders.
eCommerce
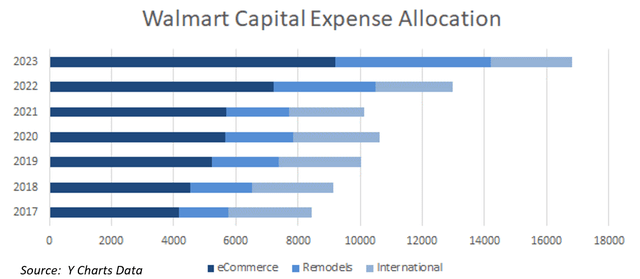
Beginning in 2016, Walmart began to disclose its allocation of capital expenditures. Over that seven-year period, the company spent over $80 billion on capital expenses, approximately half of which was devoted to eCommerce activities. Assuming for the moment that this amount represents all the company’s eCommerce investments and knowing that ecommerce sales amounted to 13.6% of sales for the year ended 2023, it is possible to do a “back of the napkin” estimate of unlevered ROE for this endeavor. Given similar operating margins and maintenance capital expenditures, the investment in eCommerce would have an approximate unlevered current pre-tax rate of return of 7.4%, which is below the 8.8% estimated unlevered pre-tax current return on the entire enterprise. Of course, this assumes that all ecommerce sales were incremental, which is unlikely. So, eCommerce shareholder returns would likely be worse.
For Walmart, investments in eCommerce are hardly an option. Absent the company’s eCommerce investments, it is likely that revenue growth would have been diminished. Still, between 2021 and 2023, the company’s percentage of eCommerce sales rose modestly from 11.7% to 13.6%. Walmart remains very much a bricks and mortar retailer.
Sales Growth and Composition
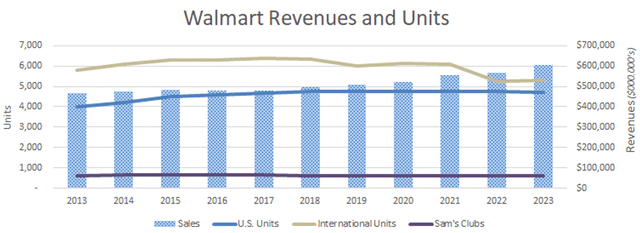
Between 2014 and 2023, Walmart’s revenues grew at a compound annual rate of 2.7%, benefitting from an inflation-aided 6.7% in 2023. While not impressive, it bears note that the company’s overall unit count at the end of January 2023 was over 9% below its 2018 high. The store closures resulted in a 16% drop in sales for the international division in 2022.
Walmart’s sales and cash flow growth over the recent decade bring to mind the notion that extremely large companies are unlikely to achieve growth that exceeds our economy as a whole. Walmart has not shown that it can do that. At the same time competitive pressures and cost increases have contributed to operating margin compression that has diminished the potency of the company’s business model.
Non coincidentally, I wrote my first forensic long-term outlook piece on Amazon (AMZN), where I designated the shares as a hold. One of the comments I made in the article was this:
“For “brick and mortar” retailers, the [AMZN] segment reporting chart must be particularly annoying. It is one thing to compete head-to-head with the convenient services Amazon provides. It is another matter altogether to compete with a retailer whose operations and values are effectively subsidized by a highly profitable and scalable web services company.”
Amazon has a similar current market pre-tax equity rate of return to Walmart. The difference is AWS, Amazon’s highly profitable web services provider subsidiary. In 2022, AWS contributed under 16% of Amazon’s revenues, but provided almost 75% of its operating profit. Stripped of AWS, Amazon’s current market shareholder returns would be nearly non-existent.
For Doug McMillon, Walmart’s CEO, the company’s competitive dynamics must be particularly troublesome. The company’s business model is under long-term siege while its primary competitor, with a 2.5X higher equity value, behaves like a non-profit.
Walmart’s ROI Reporting
Over the years, Walmart has consistently disclosed its Return on Investment (ROI). The company’s computation is similar to my unlevered return computation, but is much higher (12.7% vs 5.46%). The company uses operating income (earnings before interest expense) and then adds back interest income, depreciation, and rent expense to arrive at what the company calls ROI Operating Income. They then essentially compare the ROI Operating Income to a computation similar to my Business Investment. Here it is:
Author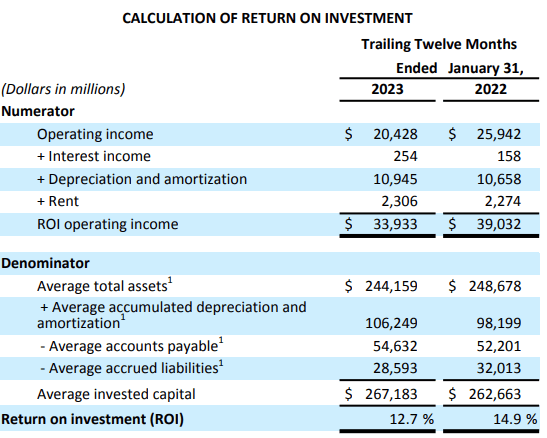
So, what are the major differences between Walmart’s unlevered return and mine? There are two:
- The company adds back rent expense in the numerator but fails to add in the corresponding cost of the leased real estate in the denominator. To do this, one needs to exclude “right of use” assets from total assets (these are not designed to arrive at an estimated real estate cost) and then capitalize rents at an estimated developer cap rate (I chose 6%). The difference between the two in my computation is approximately $35 billion. To compute an unlevered ROI, you can either retain rent expense in ROI Operating Income and use the company’s definition of Average Invested Capital (subtracting “right of use assets”) or you can add rents back and then include the estimated cost of the leased assets. But it is improper to do one without the other. Using Walmart’s Return on Investment computation will likely result in upward moves anytime the company chooses to rent a building, rather than own it.
- The company fails to make any accommodation for maintenance CapEx. It is one matter to add back depreciation, since it is a GAAP estimate of the cost of wear and tear. It is another to fully exclude the cost of wear and tear, which Walmart does. When you look at the company’s annual capital expense, including its eCommerce investments, there is a case to be made that it is all maintenance CapEx. To classify any of their capital expenditures as growth capital, would entail knowing how much of eCommerce revenues did not cannibalize bricks and mortar revenues. To the extent that eCommerce investments are defensive, helping the company to maintain the customers it already has, the investments are more akin to maintenance CapEx. Lastly, Walmart periodically closes stores or exits markets and there is no acknowledged cost in their computation for this activity.
Keep in mind that Walmart’s computed ROI, just like my unlevered equity return, are shown at cost. Investors will realize lower rates of return if the company’s market equity capitalization exceeds its cost.
The Value Equation approach to business model evaluation is designed to remove accounting estimates and then illustrate business models financially. Finance, like music, is an international language, whereas GAAP is not.
In visiting Walmart’s investor relations website, the company’s ROI is front and center. It my opinion, the company’s ROI computation is optimistic and inconsistent with its financial performance.
Conclusion
Walmart is an American staple and a truly iconic company. But, like many such seasoned companies, its best business model years seem long gone. The fortune created by Sam Walton relied on a very solid business model, together with relentless growth. Company unlevered pre-tax current equity returns in the 1980’s well exceeded 20%, while the company grew at a blistering pace. Forty years on, no longer the disruptive force it once was and facing stiff competition, unlevered current returns have fallen by more than half, with reduced operating efficiency (operating margins) and asset efficiency (sales/business investment ratios) exacting a steep cost. At the same time, the company is no longer expanding its unit count. It is contracting.
The question for investors today is whether a 1.6% dividend yield, coupled with dividend growth inside of 2%, cash flow growth less than that and a current after-tax equity return at market of 2.75% is enticing. Like all good businesses, Walmart is looking at added avenues of growth, including financial services and healthcare. But turning around an aircraft carrier is hard. The company’s declining equity returns and eroding business model are not easily reparable. To me, given Walmart’s current valuation, there are far better places to put your money.
Shareholders who have held Walmart for the past five years have done well (>12% annually) despite Walmart’s challenges, riding on elevated valuation multiples. For 2022, a loss of 0.5% also looked good relative to the S&P 500, which posted a loss of 18%. But all good things come to an end. An eventual material drop in valuation for Walmart is highly likely absent meaningful business model improvements.
Disclosure: I/we have no stock, option or similar derivative position in any of the companies mentioned, and no plans to initiate any such positions within the next 72 hours. I wrote this article myself, and it expresses my own opinions. I am not receiving compensation for it (other than from Seeking Alpha). I have no business relationship with any company whose stock is mentioned in this article.
