Summary:
- 3M’s growth has been tepid, with a 5-year CAGR of 0.88%.
- Profitability has been in decline, with gross profitability, operating income margins, earnings and ROIC all down in the last five years.
- While the company’s fundamentals do not suggest it is a candidate for long-term investment, it is a candidate for mean reversion.
jetcityimage
3M Corp. (NYSE:MMM) is a storied name in American business. It has paid out dividends since 1916, and for 64 consecutive years, it has grown dividends. However, the gloss starts to come off when you observe the firm’s performance over the last five years, with growth tepid and profitability declining. In addition the incentive plan poorly aligns shareholder and management interests. While the firm is not a good bet for long-term investment, it is a bet for mean reversion.
A Stock Market Loser
In the last five years to-date, 3M’s share price has declined 52.12% and investors have earned a total shareholder return (TSR) of -43.13%. In contrast, the S&P 500 (SPX) has risen by 55.6%, while the Dow Jones Industrial Average (DJI) has risen by 38.05%.
Source: Morningstar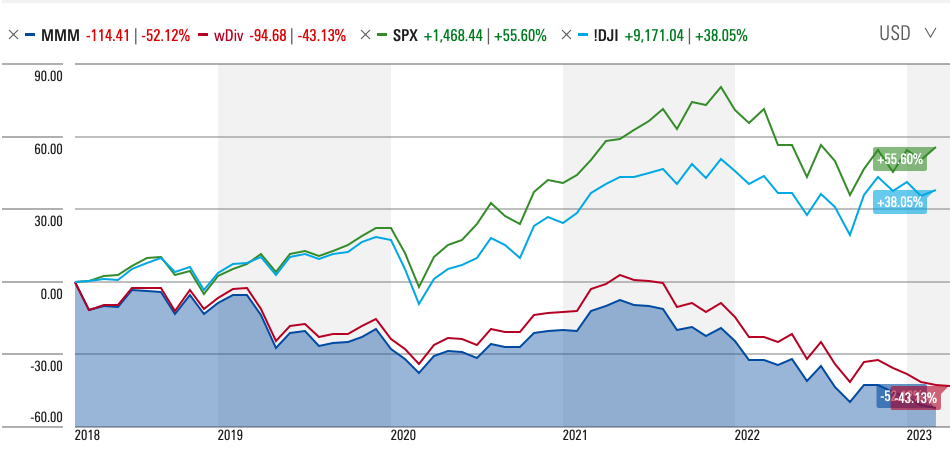
A Flawed Attempt at Aligning Shareholder and Management Interests
According to 3M’s 2022 Proxy Statement, target total direct compensation paid to named executive officers (NEOs) is shared out between base salary, and annual incentives, and long-term incentives in the form of performance share awards, stock options, and restricted stock units (RSUs). The long-term incentives attempt to link shareholder interests with those of management. In that vein, the performance shares are awarded according to earnings per share growth, free cash flow [FCF] growth, and relative organic sales growth targets. These metrics have been chosen because they drive long-term shareholder value. Management is also rewarded for any subsequent increase in the share price, and for remaining in situ.
Source: 3M 2022 Proxy Statement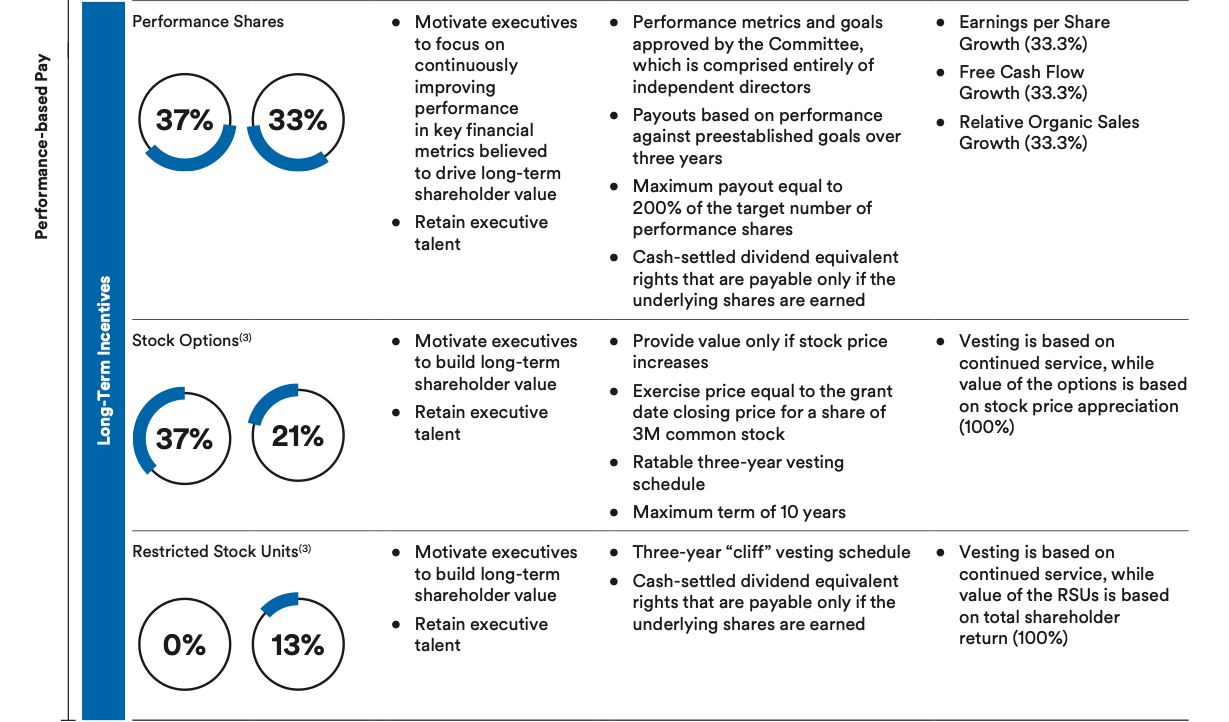
While the compensation scheme does attempt to link shareholder and management interests, and it is laudable that 3M has embraced value based management, the compensation plan could be greatly improved. The chief executive officer, Michael F. Roman, and other NEOs should be judged according to TSR and economic profits (return on invested capital [ROIC] – weighted average cost of capital [WACC] earned. This simpler, clearer plan would focus decisions on what investors really care about. At present, the performance awards are insufficiently focused on the economic profitability of the company. Indeed, economic profit is more highly correlated to TSR than earnings per share, and higher economic profit plus higher revenue growth leads to higher TSR.
Poor Growth Rates
In the last five years, revenue has grown from $32.77 billion in 2018 to $34.23 billion in 2022, at a 5-year CAGR of 0.88%. According to Credit Suisse’s “The Base Rate Book”, 28.8% of firms between 1950 and 2015 earned a 5-year sales CAGR of between 0% and 5%. In that reference period, the mean 5-year sales CAGR was 6.9% and the median 5-year sales CAGR was 5.2%. In short, 3M’s growth has been abysmal.
Source: 3M Corp. Filings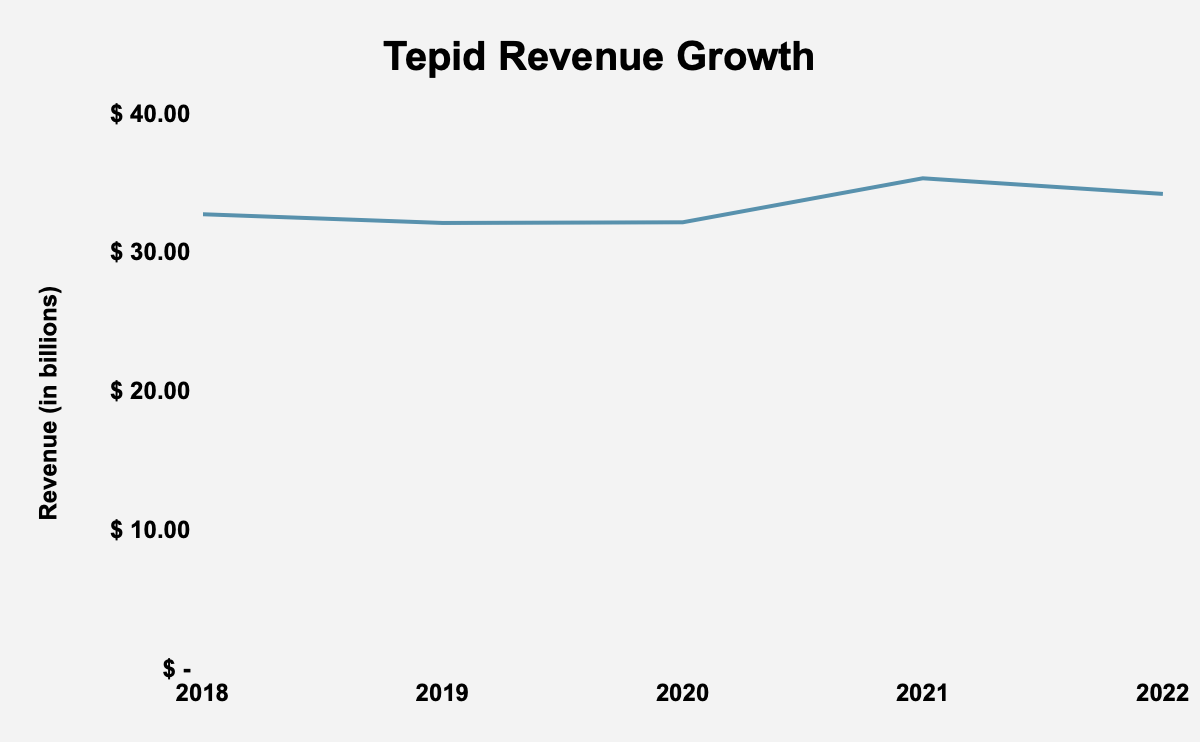
Declining Profitability
Gross profitability has declined from 0.44 in 2018 to 0.32 in 2022. Robert Novy-Marx’ research showed that a gross profitability of 0.33 and higher was attractive and a good signal of value superior to the traditional price-earnings (P/E) multiple. The decline in gross profitability reflects a decrease in, not just the profitability of the firm, but its attractiveness.
Operating income margin has also declined, from 22% in 2018 to 19.1% in 2022, further highlighting our point about the firm’s declining profitability. 3M’s operating income margin remains greater than that of the industrial sector in our reference period, where the mean operating income margin was 8.1% and the median was 8.5%.
Net income has risen from $5.35 billion in 2018 to $5.78 billion in 2022, at a 5-year CAGR of 1.56%. In the 1950 to 2015 reference period, 34.1% of firms had a 5-year earnings CAGR of 0% to 10%. The firm’s adjusted earnings have at times been meaningfully different from reported GAAP earnings, declining from $6 billion in 2018 to $5.74 billion in 2022, at a 5-year CAGR of -0.88%. In our reference period, 17.9% of firms achieved a 5-year earnings CAGR of between 0% and -10%. In that reference period, the mean 5-year earnings CAGR was 7.3% and the median earnings CAGR was 5.9%. Once again, 3M’s results do not look particularly good compared to the universe of companies.
Source: 3M Corp. Filings
Declining ROIC
In the last five years, adjusted-ROIC has declined from 24.6% in 2018 to 18.4% in 2022. Given the correlation between ROIC and long-term corporate value, it is not surprising that 3M’s market value has declined over the last five years. The company has suffered from litigation, Covid-19 related supply chain constraints, and other difficulties, in that period. Management has spun-out its Health Care business in an effort to drive long-term value, and this may help increase ROIC going forward. Nevertheless, there are no big signs suggesting that ROIC is on the path to long-term growth. This will negatively impact the firm’s long-term value.
Source: 3M Corp. Filings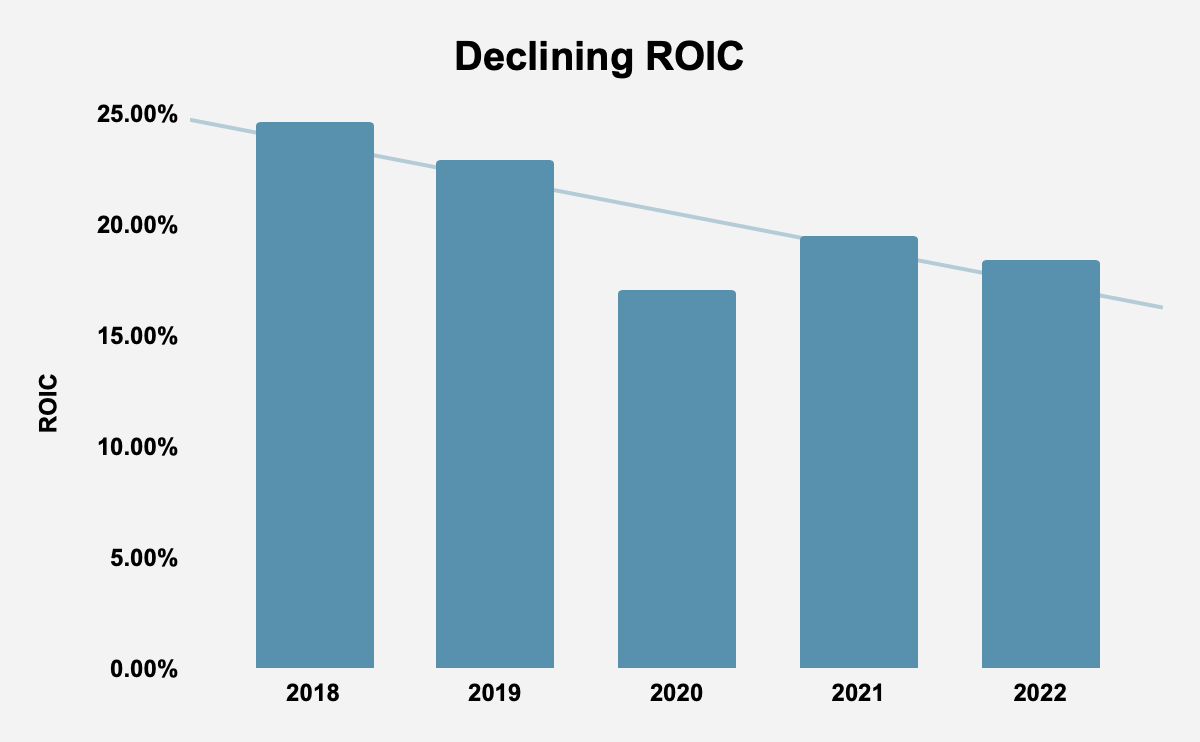
FCF Supports Dividend Policy
3M has increased its dividend payout from $0.21 per share in 1977 to $5.96 in 2022, at a 45-year compound annual growth rate [CAGR] of 7.72%. In fact, 3M has paid a dividend since 1916, and has increased its dividend payout for 64 consecutive years. In Q1 2023, 3M paid out a $1.50 per share dividend, annualized at $6 per share, for a dividend yield of 5.74%.
In the last five years, adjusted-FCF has declined from $5.57 billion in 2018 to $4.69 billion in 2022, at a 5-year CAGR of -3.38%. Nevertheless, 3M’s FCF has easily supported the dividends the company has paid out every year. In the 2018-2022 period, the company has generated $28.59 billion, or 49.58% of the company’s market capitalization. In that time, the company has paid out $16.69 billion in dividends.
Source: 3M Corp. Filings
Investors can place their confidence in the company’s ability to continue to pay out and grow dividends, based on 3M’s history of FCF supported dividend payouts.
Valuation
3M has a P/E multiple of 10.27, compared to 22.05 for the S&P 500. However, as we have shown, its gross profitability is below 0.33 and is in secular decline. With $4.69 billion in FCF, and an enterprise value of $70.55 billion in enterprise value, 3M has an attractive FCF yield of 6.65%. What this suggests to us is that 3M is a good bet for mean reversion, but that the company is not a good long-term investment.
Conclusion
3M is one of America’s great companies, with a world renowned brand. Yet, despite over a century of value creation, the firm has struggled to beat the market over the last five years. This is attributable to declining profitability and poor growth, as well as long-term incentives that poorly align shareholder and management interests. 3M should be considered as a decent bet for mean reversion, but not for long-term investment.
Analyst’s Disclosure: I/we have no stock, option or similar derivative position in any of the companies mentioned, and no plans to initiate any such positions within the next 72 hours. I wrote this article myself, and it expresses my own opinions. I am not receiving compensation for it (other than from Seeking Alpha). I have no business relationship with any company whose stock is mentioned in this article.
Seeking Alpha’s Disclosure: Past performance is no guarantee of future results. No recommendation or advice is being given as to whether any investment is suitable for a particular investor. Any views or opinions expressed above may not reflect those of Seeking Alpha as a whole. Seeking Alpha is not a licensed securities dealer, broker or US investment adviser or investment bank. Our analysts are third party authors that include both professional investors and individual investors who may not be licensed or certified by any institute or regulatory body.
