Summary:
- While Meta Platforms, Inc.’s core business Family of Apps has attractive economics, its ugly sister Reality Labs is destroying shareholder value at a rapid pace.
- Reality Labs’ revenues decreased ~5% to $2.2 billion in 2022 while its operating margin was -635% or -$13.7 billion. Still, Meta Platforms management cannot promise profits before a decade from now.
- Family of Apps faces market saturation in addition to an overall weaker economic environment which will drive lower revenue growth than investors have been used to.
- With Meta Platforms, Inc. currently trading at a P/E (TTM) of 25x, there are more attractive opportunities out there such as Alphabet/Google.

photoman
Investment Thesis

Meta Platforms, Inc. (NASDAQ:META) took the world by storm when they got listed on the NASDAQ. Anybody who participated in the IPO has enjoyed a very attractive annual return of about 17.2% compared to NASDAQ’s 14.6% during the same period. The difference of 2.6% per year doesn’t sound like much, but it adds up to over 100% for the whole period. It’s been a good ride so far, but what returns can investors expect from here? My current view of Meta is bearish due to:
- User growth in Family of Apps (FoA) is starting to stagnate due to a high market penetration
- Short-term weakness in KPIs as economic growth stagnates and companies cut down their advertising budgets
- Increased actions by competitors to erode Meta’s market position such as Apple’s privacy policy change
- Meta’s economics starting to deteriorate due to deploying a vast amount of capital in a start-up venture with an uncertain outlook
- Currently a high valuation of 25x P/E (TTM).
I’ll go through all of these points in this article and try to argue why investors better stay clear of Meta at this price level.
The Big Picture
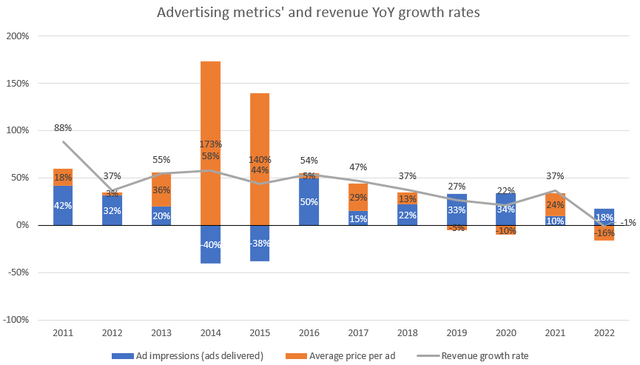
Advertising metrics’ and revenue YoY growth rates (Company financial statements, author)
When it comes to Meta, one of the most relevant metrics to follow is ad impressions and average price per ad. Ad impressions are simply the number of ads displayed across Meta’s ad products. When you take these two metrics and compare the sum of them to advertising revenue growth, you can see that they are fairly in line with each other (the difference is between -5% to +5% during the period 2016-2022). The extremely high increase in average price per ad and decrease in ad impressions during 2014 and 2015 was due to a product change that decreased the number of ads displayed but increased the relevance of the ads and therefore their price. The metrics look solid up until 2022.
It’s worrying that the average price per ad decreased by 16% in 2022. Part of the decrease has to do with Apple’s privacy policy change that made Meta’s ads less relevant for advertisers as Meta can’t track iPhone users without receiving their consent. It will be interesting to see how these metrics develop during 2023. I foresee continued weakness in the average price per ad as advertisers usually reduce their ad budgets when consumers are less likely to spend. However, there’s been some talk about Meta more efficiently monetizing WhatsApp and Messenger (through Click-To-Message) which could increase ad impressions during the year. The truth is however that this advertising tool has been available since 2015-2016 and is not a new stream of revenue. With these points in mind, top line advertising growth will most likely be in the single digits for 2023 although it’s hard to predict any single year with certainty.
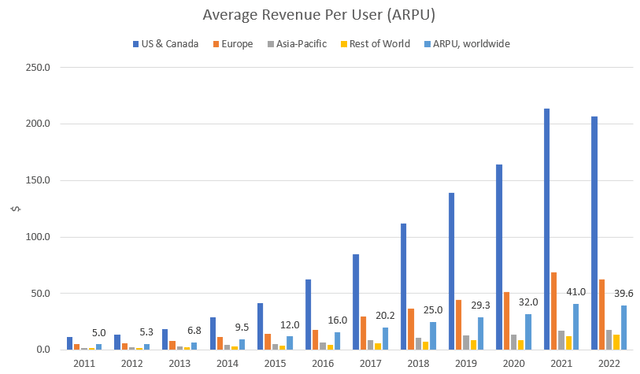
ARPU, Facebook and Messenger (Company financial statements, author)
The year 2022 was the first time Meta experienced a decrease in average revenue per user (ARPU). The decrease also came in its most profitable geographies, namely U.S. & Canada and Europe. Facebook and Messenger worldwide ARPU were down 3.2% in 2022 while the broader definition Family metrics ARPU was down 5.6% indicating that Instagram and WhatsApp ARPU decreased more than Facebook and Messenger. The driver behind the decreased ARPU is the decreased price per ad.
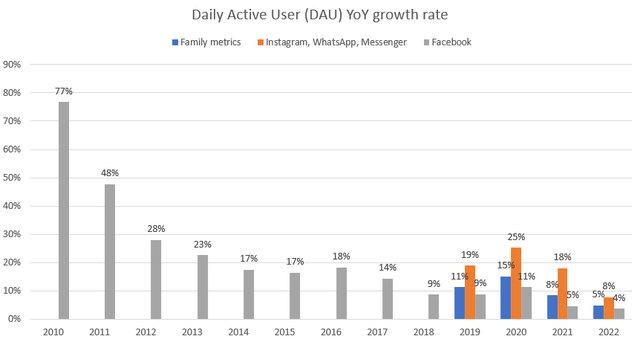
DAU YoY growth rate across products (Company financial statements, author)
What’s interesting is that ad impressions have increased by 18% during 2022 (as shown in the Advertising metrics graph above) while the growth rate in daily and monthly active users (DAU and MAU) slowed down in 2022 across products. This indicates that users are shown more ads which, in my view, decreases the user experience of Meta’s products. In the medium to long term, it could decrease the user experience of Meta’s different products. Assuming people don’t like their social media apps being bombarded with ads, they may try out competing products.
Economics
Meta’s business model is asset-light and the company, therefore, earns high returns on invested capital (ROIC). However, just as with Alphabet Inc. (GOOG) (you can read my recent article about Alphabet’s economics here), the company has had a bunch of excess cash on its balance sheet which dilutes the otherwise high returns. Let’s compare Meta’s ROIC with Alphabet’s. The figures below are adjusted for excess cash. I’ve defined operating cash as 5% of annual revenues (a simple approximation). I’ll also show the unadjusted figures in the next graph.
Meta and Alphabet ROIC, adjusted (Company financial statements, author)
Meta’s ROIC is just as attractive as Alphabet’s. Reality Labs is diluting Meta’s returns while Google Cloud and Other bets are diluting Alphabet’s. The difference between these two companies is that Alphabet is on the verge of breaking even with Google Cloud while Meta’s Reality Labs could still be a decade away from producing an operating profit.
Meta and Alphabet ROIC, unadjusted (Company financial statements, author)
When including all of the cash in the capital base we see that Meta is the more profitable company of the two. The reason is simple, Alphabet has more cash on its balance sheet and could, in my opinion, be more shareholder friendly with its payback policy.
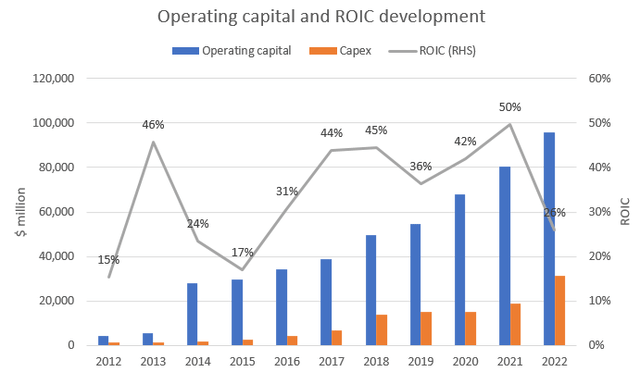
Operating capital and ROIC development (Company financial statements, author)
I suspect that Meta’s high ROIC of above 40% in recent years is a thing of the past as the company is investing heavily in its Family of Apps segment (82% of total costs in 2022) in addition to Reality Labs (18% of costs). Meta is predicting capital expenditures of $30-33 billion in 2023. I assume most of the capex is allocated to Family of Apps (FoA) as investments in this segment relate to data centers, technical infrastructure and headcount while Reality Labs investments are related to headcount and technology development which are (most likely) expensed and therefore not included in capex. If 1) FoA stagnates, which is my base case for 2023 (looking forward to the Q1 reports by the way), 2) operating capital increases and 3) the operating loss of Reality Labs increases, ROIC will be negatively affected. At some point in 2024, the cycle should turn, hopefully, and FoA should be able to grow. The question then is whether it will be enough to offset the dilution by Reality Labs.
Reality Labs
Meta’s strategic decision to push into the metaverse is embodied by its segment Reality Labs that it split out for reporting purposes in 2021 (first mentioned in the 2020 report as far as I’m aware). The market is still in its infancy and it will take at least until year 2030 before it will become mainstream (if it is to become mainstream at all). I’ve seen a couple of reports that estimate the market size to be about $1.5 trillion by 2030 which is huge (see Fortune Business Insights or PwC). I don’t do predictions that are that far out in the future as I suspect that my success rate in that endeavor would be close to 0% (and you should probably zip up your wallet when someone tells you they know how it will play out). Although there are a bunch of applications that can benefit from the metaverse it’s way too early to say whether Meta will be the major beneficiary of the opportunities out there.
With that said, the gateway to the metaverse seems to be VR/AR goggles. Here Meta is the market leader with an 80% market share according to IDC. ByteDance’s Pico comes in second place with a 10% market share.
Reality Labs is in the early stages and heavily in the red as can be seen from the figures below.
| Year | Revenue | Operating income/loss | Revenue YoY growth | Operating margin |
| 2019 | 501 | n/a | ||
| 2020 | 1,139 | -6,623 | 127.3% | -581.5% |
| 2021 | 2,274 | -10,193 | 99.6% | -448.2% |
| 2022 | 2,159 | -13,717 | -5.1% | -635.3% |
To my understanding, most of the revenues are derived from sales of Meta Quest (VR goggles) and related software which are used in gaming. It’s worrying that revenues decreased during the year while expenses grew. The expense growth is driven by increased headcount (it would be interesting to see how headcount has developed for the segment but Meta doesn’t disclose that). Meta predicts that the segment will operate at a loss for the foreseeable future. If topline development doesn’t improve in 2023 while expenses continue to grow it’s a very worrying sign. According to IDC, the global shipments of AR/VR goggles decreased by about 21% to 8.8 million units in 2022. The drivers behind the weak figures were a challenging macro environment and a lack of demand from consumers. However, the market is expected to rebound to 10.1 million shipped units in 2023 (14% growth) and grow at an annual rate of about 33% between 2023 and 2027. This implies that Reality Labs returns to topline growth in 2023 as it accounts for most of the market.
AR/VR headset market forecast (IDC, author)
Just looking at the AR/VR market as a whole and not including any other metaverse-related revenue, the size of the opportunity is significant even in Meta’s scale. It’s unrealistic to assume that Meta can increase their market share as it’s already 80%. A more likely scenario would be a decrease in market share as new players enter the market such as Sony, Apple, Microsoft, and Alphabet. As a thought experiment, let’s say Meta can keep a market share of 50% in 2027. It implies $15.5 billion in revenues or 7x higher than in 2022, a very good outcome. The market forecast and my assumption are of course very uncertain and you have to have the conviction that this or some other optimistic scenario will unfold. I can’t bet on it as I’m not knowledgeable enough on this topic. Zuckerberg, which is undoubtedly very knowledgeable on the subject, has made a big bet on the metaverse becoming mainstream sometime in the 2030s. Zuckerberg’s foresight may be enough for some (but not for me).
Valuation

As of this writing, Meta is trading at around 25x P/E (TTM) or 22x P/E (FWD). It’s also noteworthy that due to Meta’s heavy capex program, price-to-free cash flow (TTM) is about 30x. This is a very high multiple to put on a business that is not expected to grow in the near term (according to me) and is burning cash on a very uncertain venture that didn’t grow last year due to weak consumer demand. When Meta traded below 12x P/E it was most likely an overreaction. The current run-up in stock price seems to be an overreaction in the other direction. In my opinion, Meta should trade at well below 20x P/E (TTM), perhaps as low as 15x.

For comparison, you could buy Alphabet, which has a broader product portfolio than Meta (more diversified revenue streams), a stronger balance sheet (Meta’s balance sheet is also strong but burning cash at a faster rate than Alphabet) in addition to a proven growth segment in Google Cloud which is nearing breakeven. The catch with Alphabet is the potential disruption it is facing from the likes of OpenAI’s ChatGPT, although I believe the verdict on that topic to be a couple of years away.
Conclusions and Recommendation
Although Meta Platforms, Inc. has had a great run since its IPO, there are a couple of clouds on the horizon that may develop into a hurricane or wither away into clear skies. While its core business social media advertisement is still generating a vast amount of positive free cash flow, it subsidizes the heavily loss-making Reality Labs venture that, according to Meta’s own statement, could be a decade away from becoming profitable. If everything works out, great, I’ll be the first to applaud those who had the guts to put their capital at risk here. For me, the risk-reward ratio at these valuation levels is too low and for that reason, I rate Meta Platforms, Inc. stock a sell.
Analyst’s Disclosure: I/we have no stock, option or similar derivative position in any of the companies mentioned, and no plans to initiate any such positions within the next 72 hours. I wrote this article myself, and it expresses my own opinions. I am not receiving compensation for it (other than from Seeking Alpha). I have no business relationship with any company whose stock is mentioned in this article.
Seeking Alpha’s Disclosure: Past performance is no guarantee of future results. No recommendation or advice is being given as to whether any investment is suitable for a particular investor. Any views or opinions expressed above may not reflect those of Seeking Alpha as a whole. Seeking Alpha is not a licensed securities dealer, broker or US investment adviser or investment bank. Our analysts are third party authors that include both professional investors and individual investors who may not be licensed or certified by any institute or regulatory body.
