Summary:
- As a value investor, I seek to purchase the stocks of great companies at inexpensive prices.
- I employ a number of factors before making a major investment decision. My general investment thesis template is outlined in the article.
- The Home Depot ticks the boxes and passes qualitative markers, too.
- Please read the article following for data and detail on HD.
jetcityimage
Current market volatility is uncovering many bargains.
In this article, I would like to introduce my readers to a new stock position I’ve been accumulating over the year: Home Depot Inc (NYSE:HD).
Home Depot sports just about everything I like in a stock:
-
Sound balance sheet
-
Strong franchise
-
Earn profits in cash
-
Well-managed, shareholder-friendly
-
Pays a meaningful, safe dividend
In addition, recent bids on HD shares indicate the common stock is trading at a solid discount to my Fair Value Estimate.
As a general rule, I add new portfolio positions infrequently. However, I believe Home Depot represents a great company at a fair price. I do not want to pass it up.
Home Depot Investment Thesis
I submit if one cannot explain to someone off the street in three or four bullet points why he / she should own a given stock, then he / she should not invest in it.
Given that backdrop, here are my reasons for wanting to own Home Depot shares:
-
The business is understandable.
-
The company earns its profits in cash and generates outstanding return-on-capital.
-
Management pays a reliable dividend on the stock. It has been increased for 12 consecutive years. Currently, the dividend yield is 2.9 percent.
-
Despite short-term pressure on consumer spending for repair / remodeling, the long-term prognosis for the home improvement industry remains intact.
Let’s break it down.
What Is the Home Depot?
The Home Depot is the world’s largest home improvement retailer. The business caters to three primary customers: Do-It-Yourself (DIY) customers who turnkey their own projects; Do-It-Yourself customers that purchase materials and hire third parties to complete the project; and Professional customers consisting of remodelers, general contractors, and tradesmen. HD sells a wide range of building materials and related products / services to their customers. The business is straightforward and understandable.
A Strong Franchise
Home Depot owns a strong franchise. The brand is readily recognizable. More importantly, a strong franchise is evidenced by some level of pricing power. Home Depot is the largest home improvement retailer, in 2022 logging over $157 million in sales, or ~17 percent of the TAM. In North America, Lowe’s Companies, Inc (LOW) runs second at ~12 percent of the total market. Then follows Menards, Ace Hardware, and TruValue. These businesses focus upon smaller stores, localized operations, and more of a value-for-cost differentiated business model.
In 2022, Home Depot customers’ average ticket increased 8.8 percent versus the year earlier. This eclipsed the 6.5 percent rise in the Consumer Price Index (CPI-U). The difference indicates HD had enough pricing power to more than offset inflationary costs.
Furthermore, despite last years’ economic crosscurrents, Home Depot retained a 15.2 percent operating margin; comparable to 2021.
Solid Fundamentals
Note: Author generated data and created the tables proceeding using input data from Home Depot and Lowe’s investor websites.
Sound Balance Sheet
Home Depot has a sound balance sheet. Currently, S&P awards the company an “A” credit rating. Several metrics support this strong designation:
-
The company’s debt leverage ratio is 1.9x. For a retailer, a rating under 2.0x may be considered acceptable. Home Depot is not overleveraged with debt.
-
The current ratio is 1.4x. A ratio over 1.0x is acceptable. This means the company appears to have sufficient liquidity to cover its obligations that come due within the next year.
-
The 2022 interest coverage ratio is over 15x. Home Depot was able to cover its interest expense easily.
Cash Profits!
Few companies earn their profits in cash. Home Depot is one of those few.
Home Depot – Profits To Cash Flow ($B)
|
YE Jan-23 |
YE Jan-22 |
|
|
Net Income |
17.1 |
16.4 |
|
Operating Cash Flow |
14.6 |
16.6 |
|
Free Cash Flow |
11.5 |
14.0 |
The profit-to-operating cash flow conversion rate was 85 percent last year and 101 percent in 2021.
Please note in the prior two years, operating cash flow was impacted negatively by working capital movement. Ex delta working capital, Home Depot generated $20.9 billion and $19.6 billion in YE January 2023 and 2022, respectively.
Excellent Return-on-Invested-Capital
HD management focuses upon several key metrics: sales growth, operating margin, and return-on-capital.
For the YE January 2023, the company reported 44.6 percent RoIC versus 44.7 percent in the year prior. On an absolute basis, these are outstanding figures. For perspective, later in this article we will compare Home Depot’s RoIC and several other important metrics versus Lowe’s.
Rising Sales Per Square Foot
Most retail businesses gauge performance via same store sales or a comparable metric. Home Depot measures sales per retail square feet. This offers insight into how effectively management is growing the business as a function of the actual operating facilities.
Last year, Home Depot recorded $627 Sales/Sqf, up 3.7 percent from $571 in 2021. However, investors noticed the 4Q figures (for the period November 2022 through January 2023) showed a year-over-year 0.1% drop. This suggests slowing consumer spend.
As a long-term investor, I view any near-term reduced customer spend to be a temporary phenomenon. Please see more detail under the “Macro Setup” heading below.
Shareholder-Friendly Management
Passive investors may judge management by several measures; some quantitative and others qualitative. In the case of Home Depot, I am highly constructive on the way management handles the business.
Clear Financials
Management presents quarterly financials in a clear and unambiguous fashion. Generally, there are no adjustments to the reported income statement or statement of cash flow. The financial statements are “clean,” or “don’t have any hair on them.”
Measurable Forward Guidance
Management provides annual forward guidance and updates it as necessary. The guidance includes projected sales revenue, operational metrics, expected margin, and EPS.
Management Delineates Corporate Strategies
Superior management teams communicate overarching corporate strategies without stuttering. Home Depot management is notable in this area.
To reinforce the point, I offer several remarks by Home Depot CFO Richard McPhail at the JP Morgan Retail Roundup Conference held on March 30, 2023. (Bold italics for emphasis are mine).
On key business metrics and the HD operating model:
Well, to me, it’s all about operating profit, dollar growth and return on invested capital, making sure that I can drive — we can drive earnings growth as fast as possible and deliver an appropriate return on the capital required to make that happen.
And the building blocks of that are absolutely growing the top line faster than the market and then delivering operating expense leverage as we flow volume through our business, and that’s been a hallmark of the Home Depot. We have always generated operating expense leverage, and we intend to continue that. That is our operating model.
On the workup for 2023 guidance and the expectation to take market share:
We assumed flat consumer spending for 2023. We also assumed that, that shift from goods back into services, as COVID dynamics kind of reverse themselves all the way, that shift from goods to services is going to put more pressure on our market. But the Home Depot has a long history of taking market share in any environment. We intend to do that again in 2023. And so that’s why we’ve said that any pressure from those two dynamics is going to be offset by our ability to take share.
On corporate strategy:
We know it’s our job to make sure that we are — our expense base reflects the fact that we’re the low-cost provider. That will be a position that we will seek to extend indefinitely, right?
There — that’s part of our economic flywheel. We must remain the low-cost provider. But we are going to make sure that we stay a pace of wage inflation.
Businesses “win” in the marketplace by focusing upon one of three basic models. These are 1) be a low-cost provider, 2) offer clearly differentiated service-for-cost, or 3) operate within a niche, meaning there are few or no competitors.
The Home Depot Values Cash Dividends
Typically, shareholder-friendly management seeks to reward stockholders with meaningful return-of-capital; specifically, consistent cash dividends and / or timely stock repurchases that reduce diluted share count and are not offset by excessive ESOPs.
Unquestionably, HD management and the directors are committed to a significant, sustainable cash dividend.
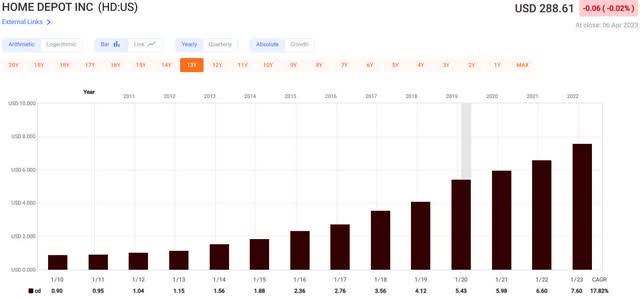
Home Depot investors have enjoyed an increasing cash dividend for 12 consecutive years. Over the past 10 years, Home Depot the payout has increased the dividend by 19.2 percent annually. Over the previous 5-year period, the dividend rose by 16.4 percent.
Here is a long-term chart of HD dividend history:
The current dividend yield is ~2.9 percent.
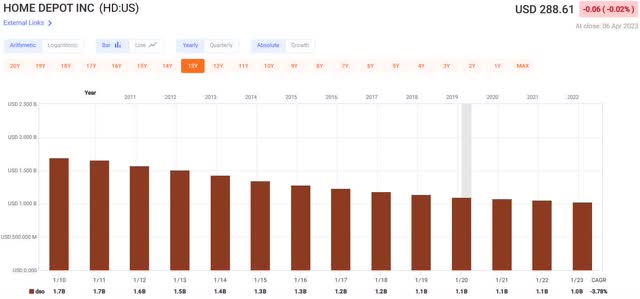
Meanwhile, the long-term trajectory of diluted common shares outstanding is down.
Home Depot Values Its Employees
Well-managed companies value their employees, then back it up.
CFO McPhail offered color on the matter through a story:
I said, “Everyone with 20 years of tenure or more, please stand up.” And I was expecting not a massive population, [but] a vast majority of the room stood up.
I have the stats around it, but it’s pretty overwhelming to realize that the leadership team of the Home Depot, [of] which the nexus of that is the store manager, is someone who has dedicated their entire career to the Home Depot. I don’t think you find that anywhere else in retail.
Management doubled down in the February 21, 2023, earnings release. HD announced plans to invest an additional approximately $1 billion in annualized compensation for frontline, hourly associates. The change was effective February 1, 2023. CEO Ted Decker commented, “The most important investment we can make is in our people. We believe this investment will position us favorably in the market, enabling us to attract and retain the level of talent needed to sustain the customer experience we strive to deliver.”
A billion dollars adds about 4 percent to the company’s 2022 total SG&A costs. That isn’t chicken feed. Notably, the increase targets frontline, hourly associates; not management or administrative support staff.
A Good Macro Setup
My Home Depot investment thesis includes the view the current economic turbulence is temporary. It appears to me most of the market’s problems revolve around Federal Reserve activity (tightening credit and raising interest rates to stem inflation.) If you will, these actions represent economic policy decisions, not systemic financial risk. Fed tightening is nothing new.
Having invested for nearly 40 years, I see it as simply part of the economic business cycle. Typically, these cycles last seven to ten years or so, with the “contraction” or “recessionary” phase lasting only a year or two.
I contend we are in a garden-variety recessionary phase. I do not know whether the economy will fall into the textbook definition of a recession. Nor do I know how long the current contraction phase will last. What I do know with conviction is investors with the patience and fortitude to purchase the stocks of good companies at fair prices today will be rewarded tomorrow.
I also recognize that historically, one of the market sectors that tends to outperform as the economy transitions from the recessionary phase into the early recovery phase is Consumer Discretionary.
For Home Depot management perspective, here are macro remarks by CFO Richard McPhail:
But the statistic that has really stuck with me is the [residential home] vacancy rate in the United States.
It is at its all-time low. This is post-World War II. That rate has hovered somewhere between 1% and 2% of housing stock being vacant in the United States for decades. It shot up to 3% just before the GFC [Global Financial Crisis], when we vastly overbuilt. And then since then, since 2010, we have built ourselves into a chronic condition of lack of housing.
And so vacancy right now is less than 1%. I think it’s 0.6% in the last reading. You combine that condition with the wealth of the homeowner in North America, and I think that much stronger conditions have [never] existed for home improvement. 2023 is going to be a year with uncertainty. And as you know, we guided flat sales for 2023 and that, I think, really just reflects the fact that the Fed is in the ring with us here, and monetary policy and its impact is real.
Home Depot is an excellent company residing in the Consumer Discretionary sector. The stock appears to trade inexpensively. Management pays an investor to wait for the economy to straighten itself out.
Home Depot: A Step Ahead of Lowes?
The home improvement space is fragmented. Home Depot and Lowe’s control 17 percent and 12 percent of the market, respectively. These two competitors are similarly situated, though Home Depot tends to cater more Pro customers.
In this section, I’ve performed a quick-check comparison between the two largest players. Specifically, I’ve chosen to review the following metrics:
-
revenue growth
-
operating margins
-
operating leverage (delta revenue minus delta opex)
-
return-on-invested-capital
Year-over-Year Revenue Growth
|
YE 1-20 |
YE 1-21 |
YE 1-22 |
YE 1-23 |
Total |
|
|
Home Depot |
1.8% |
19.9% |
14.5% |
4.1% |
42.8% |
|
Lowe’s |
1.1% |
24.3% |
7.5% |
0.8% |
34.7% |
Over the past four years, Home Depot has grown its top line faster than Lowe’s.
Operating Margins
|
YE 1-20 |
YE 1-21 |
YE 1-22 |
YE 1-23 |
4Y Avg |
|
|
Home Depot |
14.4% |
13.8% |
15.2% |
15.2% |
14.7% |
|
Lowe’s |
9.1% |
10.8% |
12.6% |
13.1% |
11.4% |
Home Depot generates better EBIT margins than Lowe’s.
Operating Leverage
Operating leverage is year-over-year sales growth less year-over-year opex growth / reduction. A positive differential indicates the company is able to convert increasing sales into even greater profits.
|
YE 1-20 |
YE 1-21 |
YE 1-22 |
YE 1-23 |
|
|
Home Depot |
0.4% |
-2.6% |
10.0% |
0.9% |
|
Lowe’s |
4.0% |
3.7% |
7.5% |
2.8% |
Lowe’s has outperformed Home Depot on this metric. However, investors should note that I accepted Lowe’s “adjusted” opex to calculate the figures. These adjustments reflect what Lowe’s management believes are one-time, non-core expenses. Home Depot does not adjust its reported figures.
Return-on-Invested-Capital
|
YE 1-20 |
YE 1-21 |
YE 1-22 |
YE 1-23 |
|
|
Home Depot |
51.5% |
46.3% |
56.2% |
47.5% |
|
Lowe’s |
28.1% |
42.5% |
51.7% |
56.4% |
Note: The figures in the table above may not reconcile with those reported by Home Depot and Lowe’s. There are multiple ways to calculate RoIC. For continuity and comparison, author performed the calculation using the same standard formula for both companies.
Both companies sport outstanding RoIC.
Bottom line
Overall edge to Home Depot. Lowe’s is improving on several fronts, but currently HD is a superior operator.
HD Is An Inexpensive Stock
The last piece of the puzzle is valuation. Valuation is what separates the most successful investors from the rest. I share with you a comment by the legendary investor Peter Lynch: he said if an investor only got two out of three investments “right,” he / she would beat the Street.
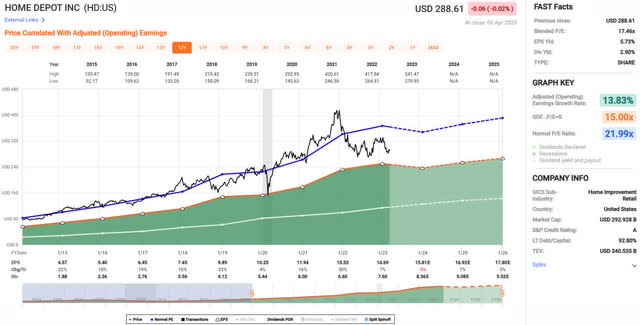
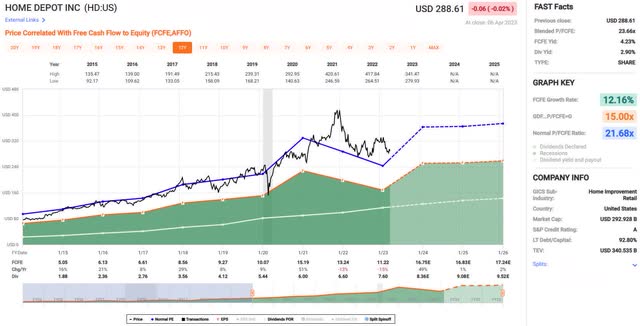
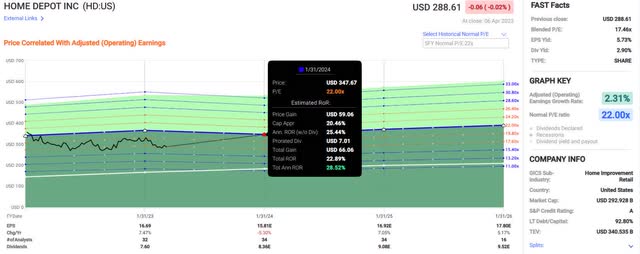
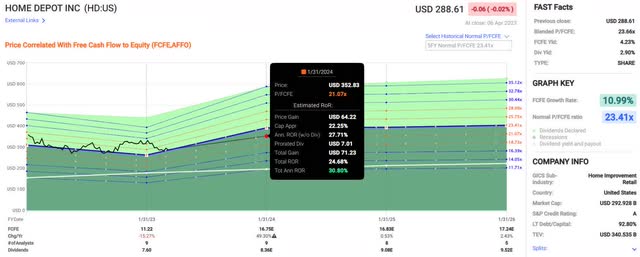
I evaluated Home Depot stock using two price-and-multiple measures: price-to-earnings and price-to-free cash flow. Two long-term FAST Graphs follow; each illustrating the relationship.
Price-and-Earnings:
Price-and-Free Cash Flow:
Next, the FAST Graph forecasting calculator takes the aforementioned data and indicates the potential upside for HD stock.
First, through the P/E lens:
Next, through the P/FCF lens:
Currently, my FVE (Fair Value Estimate) for Home Depot stock is ~$343. I lowered the expected valuation multiples to 21x (versus the charts above) for EPS and FCF. Therefore, based upon YE January 2024 estimates, my FVEs are $333 and $352. I averaged the two data points for the $343 marker.
Using the foregoing figures, HD common stock may be undervalued by about 19 percent, excluding dividend income.
Summary
Home Depot appears to offer long-term value investors a trifecta: a well-run company, buttressed by strong fundamentals, with the current share bid looking like a discount.
There’s a lot to like about Home Depot. HD management speaks to stakeholders clearly. They set measurable goals underpinned by a straightforward overarching strategy. Management and directors have a long record of rewarding stockholders with growing dividends. Senior leadership values its employees and is willing to put money where their collective mouths are.
The company has a sound balance sheet. Home Depot earns its profits in cash. Lowe’s, the #2 operator in the space, is improving but has not yet demonstrated an ability to outperform HD.
Home Depot common stock appears undervalued by approximately 20 percent based upon FY2024 projected financials, indicating an adequate factor-of-safety.
On balance, Home Depot appears to be a great company trading at a fair price.
Long and strong HD.
Please do your own careful due diligence before making any investment decision. This article is not a recommendation to buy or sell any stock. Good luck with all your 2023 investments.
Analyst’s Disclosure: I/we have a beneficial long position in the shares of HD either through stock ownership, options, or other derivatives. I wrote this article myself, and it expresses my own opinions. I am not receiving compensation for it (other than from Seeking Alpha). I have no business relationship with any company whose stock is mentioned in this article.
Seeking Alpha’s Disclosure: Past performance is no guarantee of future results. No recommendation or advice is being given as to whether any investment is suitable for a particular investor. Any views or opinions expressed above may not reflect those of Seeking Alpha as a whole. Seeking Alpha is not a licensed securities dealer, broker or US investment adviser or investment bank. Our analysts are third party authors that include both professional investors and individual investors who may not be licensed or certified by any institute or regulatory body.

