Summary:
- This is a technical analysis article. Meta Platforms has our proprietary fundamental and technical Buy Signal, but it is overvalued.
- This is compounded with a weak Growth rating by Seeking Alpha Quant score. The overvalued metrics can sometimes be excused if there is aggressive growth.
- Facebook made a false start by changing its name and pivoting too quickly into Meta Platforms. The market punished it ruthlessly.
- Now we have what looks like a “dead cat” bounce from deeply oversold, and the hedge fund traders may be looking to take profits. Investors burned by the crash have long memories.
- If the market takes a dive to retest the bottom, as we expect, then overvalued, high PE, slower growing stocks like Meta will take a hit.
Kira-Yan
Facebook changed its name to Meta Platforms (NASDAQ:META) but that did not improve its revenues or earnings. In fact, it reduced earnings and the price took a dive to the bottom. You can see that on the chart below. META has announced big layoffs to improve earnings and that has created a nice bounce off the bottom, but cost cutting is not growth.
However, according to Seeking Alpha’s Quant Ratings, it gets a poor grades for the Valuation metrics and a weak grade for growth. That spells trouble if the PE is too high because price will drop on any market pullback. Investors may take profits after the enormous bounce from $88 to $214.
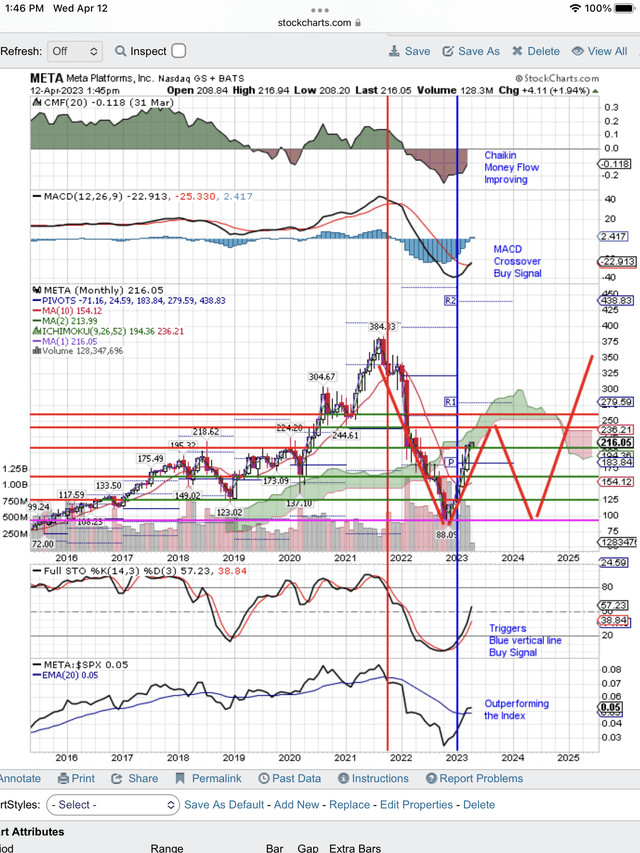
Here is the monthly chart showing what looks to be a dead cat bounce off the bottom:
Meta Platforms forming a “W” bottom? (StockCharts.com)
As you can see on the above chart, all the signals are still positive. Chaikin Money Flow is improving. The Moving Average Convergence/Divergence (MACD) signal has a crossover Buy Signal. The Full Stochastic (Full STO) has triggered our vertical, blue line Buy Signal. The uptrend in META:SPX indicates that META is outperforming the market. So what’s the problem?
If you tap the SA Valuation tab, you will see all the problem metrics that indicate META is overvalued at these prices. That is a slight problem for aggressive growth stocks. However, META is no longer aggressive growth, and so it needs to be closer to fairly valued. Overvalued metrics indicate that it is in for a future price adjustment.
We think that comes when earnings are announced or when the market pulls back or both. We have outlined that projection with red lines under price showing what we think will be an eventual retest of the bottom before price moves higher again, especially if we have a recession and ad revenue drops.
So why is our StocksInDemand (SID) system coming up with a Buy Signal? Mainly because of the strong bounce up and the continuing buy signals on the chart. META is attempting a 50% retracement of the dive down and that is not unusual. SA is giving good grades to META for Profitability, Revisions and Momentum. Obviously our SID Buy Signal likes that and overlooks the Valuation problem for the time being. The market may not be so generous with a high PE and low growth stock, especially if earnings disappoint or the market pulls back, as we expect in the next few months.
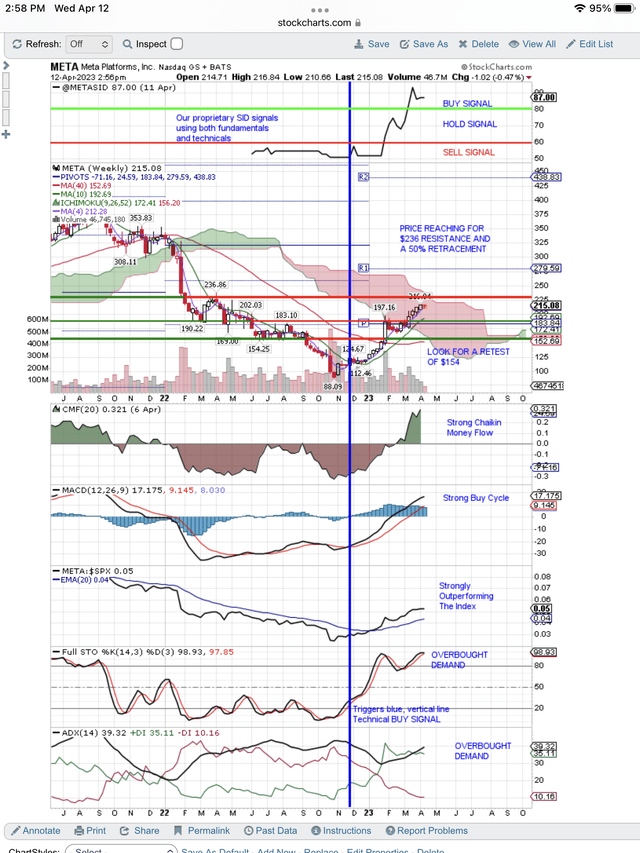
Here is our weekly chart showing the blue line technical buy signal for the bounce. At the top of the chart is our proprietary SID Buy Signal that is slower than the technical buy signal because it uses both fundamentals and technicals. Before the layoffs, fundamentals were not looking as good as the technicals. Our SID score needs both good fundamentals and good technicals to trigger a Buy Signal. Obviously our SID system Buy signal thinks we now have that combination. However, Valuation and Growth challenges make META vulnerable to a market pullback or disappointing earnings reports.
Meta buy signals reaching for next resistance (StockCharts.com)
As you can see at the top of the chart, META has our proprietary Buy Signal scoring 87 out of a possible 100. This signal uses both fundamentals and technicals and is significantly slower to flash a Buy Signal than the purely technical buy signal that triggers the blue, vertical line.
As indicated above, we think the technical buy signals are targeting a test of resistance at $236. Then we think on any market pullback that it will retest the support at $154 and near the 200-day moving average.
Analyst’s Disclosure: I/we have no stock, option or similar derivative position in any of the companies mentioned, but may initiate a beneficial Long position through a purchase of the stock, or the purchase of call options or similar derivatives in META over the next 72 hours. I wrote this article myself, and it expresses my own opinions. I am not receiving compensation for it (other than from Seeking Alpha). I have no business relationship with any company whose stock is mentioned in this article.
Disclaimer: We are not investment advisers and we never recommend stocks or securities. Nothing on this website, in our reports and emails or in our meetings is a recommendation to buy or sell any security. Options are especially risky and most options expire worthless. You need to do your own due diligence and consult with a professional financial advisor before acting on any information provided on this website or at our meetings. Our meetings and website are for educational purposes only. Any content sent to you is sent out as any newspaper or newsletter, is for educational purposes and never should be taken as a recommendation to buy or sell any security. The use of terms buy, sell or hold are not recommendations to buy sell or hold any security. They are used here strictly for educational purposes. Analysts price targets are educated guesses and can be wrong. Computer systems like ours, using analyst targets therefore can be wrong. Chart buy and sell signals can be wrong and are used by our system which can then be wrong. Therefore you must always do your own due diligence before buying or selling any stock discussed here. Past results may never be repeated again and are no indication of how well our SID score Buy signal will do in the future. We assume no liability for erroneous data or opinions you hear at our meetings and see on this website or its emails and reports. You use this website and our meetings at your own risk
Seeking Alpha’s Disclosure: Past performance is no guarantee of future results. No recommendation or advice is being given as to whether any investment is suitable for a particular investor. Any views or opinions expressed above may not reflect those of Seeking Alpha as a whole. Seeking Alpha is not a licensed securities dealer, broker or US investment adviser or investment bank. Our analysts are third party authors that include both professional investors and individual investors who may not be licensed or certified by any institute or regulatory body.

Use our free, 30 day training program to become a succesful trader or investor. Join us on Zoom to discuss your questions.
