Summary:
- Microsoft reported its Q3 of FY6/23 yesterday after the close. The stock hit 52-week highs after hours.
- Revenue growth accelerated, margins were flat, and the balance sheet remains unassailable.
- Underlying growth slowed but not to a worrisome level at this stage.
- We anticipate some short-term weakness for the stock after this big run up, followed by a run to new all-time highs within 12 months.

Moon Soon?
dima_zel
DISCLAIMER: This note is intended for US recipients only and, in particular, is not directed at, nor intended to be relied upon by any UK recipients. Any information or analysis in this note is not an offer to sell or the solicitation of an offer to buy any securities. Nothing in this note is intended to be investment advice and nor should it be relied upon to make investment decisions. Cestrian Capital Research, Inc., its employees, agents or affiliates, including the author of this note, or related persons, may have a position in any stocks, security, or financial instrument referenced in this note. Any opinions, analyses, or probabilities expressed in this note are those of the author as of the note’s date of publication and are subject to change without notice. Companies referenced in this note or their employees or affiliates may be customers of Cestrian Capital Research, Inc. Cestrian Capital Research, Inc. values both its independence and transparency and does not believe that this presents a material potential conflict of interest or impacts the content of its research or publications.
Still No Recession
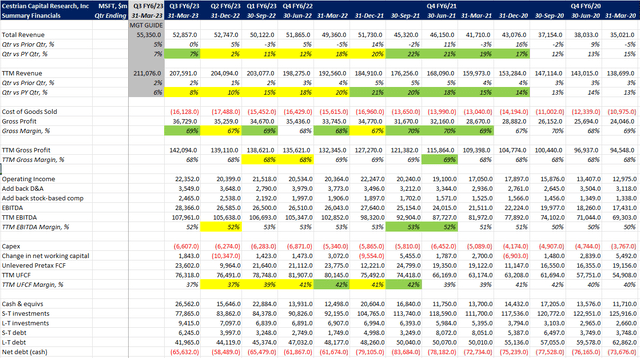
We may yet have a recession, but right now, there isn’t one. That’s our take from Microsoft’s (NASDAQ:MSFT) accelerating growth rate: +7% revenue growth in the quarter – vs. the management guide of +3% issued just one quarter ago – isn’t nothing, and it’s one of the reasons the stock positively moved in the aftermarket trading session yesterday.
Since literally the entire Internet will be full of Microsoft stuff today, we can keep this note brief.
Our take on fundamentals is this:
- The acceleration in growth is real, meaningful and growth at this level can in our view be sustained.
- Margins at every level – gross margin, EBITDA, cash flow – were flat. That’s not wonderful but if the trade-off for higher growth is no operating leverage for the time being – that’s likely OK for the stock, since generally speaking Nasdaq component names respond better to growth moving up than they do margins moving up.
- The balance sheet remains utterly unassailable.
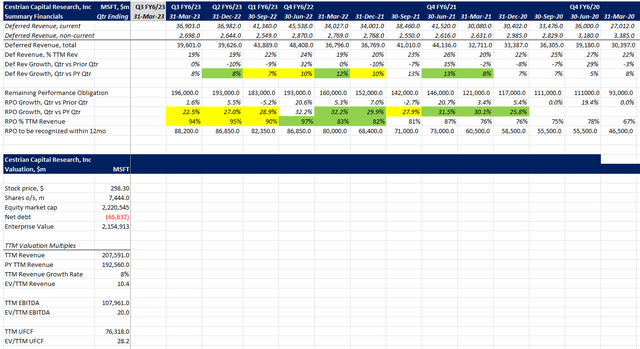
- Remaining Performance Obligation – that’s the totality of the customer order book, whether prepaid or not – growth is slowing. Our confidence in the stock would rise if RPO growth leveled off or began to climb once more. But this isn’t a panic-now issue, it’s a watch-the-horizon issue.
Here’s the numbers and the valuation.

MSFT Fundamentals I (Company SEC Filings, YCharts.com, Cestrian Analysis)

MSFT Fundamentals II (Company SEC Filings, YCharts.com, Cestrian Analysis)
Now on to the stock chart.
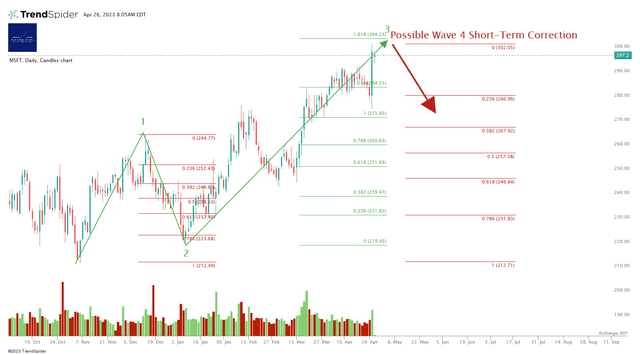
In the smaller degree, Microsoft has put in a big move since its November 2022 lows. The overnight high hit a textbook Wave 3 termination level, being the 1.618 extension of the prior Wave 1 up. (Sounds complicated, isn’t. Take the share price change in the Wave 1, multiply by 1.618 which is a typical Fibonacci extension, add that number to the share price at the Wave 2 low, there’s your Wave 3 high). You can open a full page version of our short term chart here.

MSFT Daily Chart (Cestrian Analysis, TrendSpider)
Wave Threes can move way beyond that 1.618 extension for sure – way beyond – but in the light of downward pressure in the Nasdaq and the S&P at present, we believe that a local high may have been struck in Microsoft and if so we would expect a short correction down to no lower than that Wave 1 high you see in December. Let’s call it somewhere between $270-$280 before reversing upward once more. If MSFT pumps higher today, we will reset our chart to start the drop from wherever the peak is, but we do believe a correction is on the way. Why? Because MSFT’s big move will mean a whole lot of folks get excited and start buying the stock today (having declined the opportunity to buy in the low $200s in November). And the inevitable consequence of that is that they turn out to be a source of liquidity for many folks who did buy those Q4 lows, which is to say – Big Money. This being the point of the stock market. To act as a funds transfer agent from Small Money to Big Money. Once a correction bottoms out? Expect Small Money to be scared (watch the Armageddonistas appear all over social media once again soon) and Big Money to scoop up handfuls of MSFT stock once more.
Longer term? Here’s our larger-degree chart. Again, for easier reading, click here to open a full page chart.

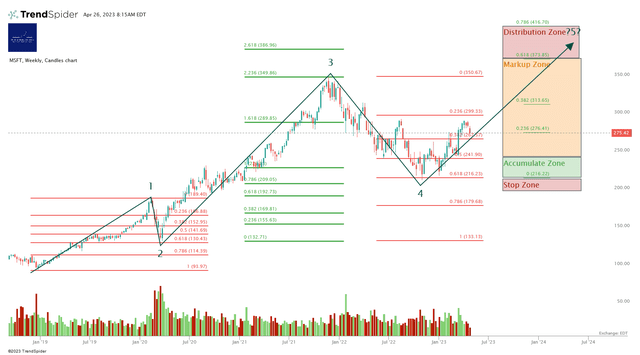
MSFT Weekly Chart (Cestrian Analysis, TrendSpider)
This is a real beauty of a chart. You could use this to teach the Elliott Wave and Fibonacci Method in Chart School. Here’s how it runs.
- Wave 1 – From the 2018 lows (the last time the Fed reversed monetary tightening) to the 2020 highs, right before the Covid Crisis; a ~100% move up from $93-$189/share.
- Wave 2 – From the Feb 2020 highs, a 61.8% Fibonacci retracement into the COVID crisis lows. Wave 2s typically terminate between the 61.8%-78.6% retracement levels. (MSFT proved much more resilient in the COVID selloff than did the Nasdaq or the S&P, by the way).
- Wave 3 – Fueled by a tidal wave of Federal liquidity, a 2.618 extension of the prior Wave 1 high (see what we mean about Wave Threes?) peaking at the end of 2021 – this was a ~160% move up from $133-$339/share in less than two years. Yikes. Don’t be on the wrong side of a Wave Three is the message.
- Wave 4 – Under pressure from the rising cost and decreasing availability of money, a 61.8% Fibonacci retracement (meaning the stock surrendered a little over 60% of the gains it achieved from March 2020 to December 2021), bottoming out in November 2022 at $213. The clear “Accumulate” signal was the triple bottom in January 2023 showing that this low $200s zone was proving very strong support. Yes we did say this at the time.
- We’re now in a Wave 5 up, which if the pattern holds – and it has, since that 2018 low – We’re in our view likely to see a top somewhere between the 61.8%-78.6% Fib extension of Waves 1-3 combined – this is a textbook Wave 5 high, and if it comes to pass it means a new all-time high in MSFT to be hit somewhere between $374-417.
And if that happens? Then get very, very worried, because if that pattern plays out, it means quite a sizable drop thereafter. Why? No idea. Something. But a drop nonetheless.
So our plan in staff personal accounts – hence our rating on the name – is, do nothing. Hold while the stock zigzags its way up through the Markup Zone, where late buyers come to play. If the stock does reach those highs, we’ll consider taking gains in our long-term positions. But that’s for another day. For now, doing nothing, Hold rating.
Cestrian Capital Research, Inc – 26 April 2023.
Analyst’s Disclosure: I/we have a beneficial long position in the shares of MSFT either through stock ownership, options, or other derivatives.
Business relationship disclosure: See disclaimer text at the top of this article.
Cestrian Capital Research, Inc staff personal accounts hold long positions in MSFT and hedged long and short positions in the Nasdaq.
Seeking Alpha’s Disclosure: Past performance is no guarantee of future results. No recommendation or advice is being given as to whether any investment is suitable for a particular investor. Any views or opinions expressed above may not reflect those of Seeking Alpha as a whole. Seeking Alpha is not a licensed securities dealer, broker or US investment adviser or investment bank. Our analysts are third party authors that include both professional investors and individual investors who may not be licensed or certified by any institute or regulatory body.
GET INSTITUTIONAL GRADE BUYSIDE RESEARCH FROM CESTRIAN CAPITAL RESEARCH
We provide investment research prepared to institutional investor quality, presented in a way anyone can understand. Our work allows you to make sense of company fundamentals and stock technicals without resort to jargon or esoterica. We provide actionable ideas and disclose all staff personal account positions in covered stocks. Superb investor community works together 24/7 to achieve better outcomes. Join us! Click HERE for more.

