Summary:
- Mr. Market’s response to AT&T Inc.’s earnings reveals a lack of understanding of financial metrics.
- The company’s execution and projection for the year are in line with the issued guidance.
- I’ll profit from Main Street’s panic, AT&T’s cheaply valued +6% qualified dividends are up for grabs.
z1b
Co-authored with “Hidden Opportunities.”
The stock market can be a very volatile place. Prices are often swayed by “investor sentiment,” which outside of Wall Street, would be called emotions. The market is filled with traders who have their fingers poised on the buttons to buy or sell at a moment’s notice. These traders feel like they have to race everyone else. Their profit is determined by whether or not they can be faster than their peers and whether or not they can predict short-term price changes more accurately.
This is a race I know I cannot win. There are firms on Wall Street with complex computer algorithms and entire teams dedicated to trying to win this race. Fortunately, I don’t have to win the race. They are like children, running to be first in line at a buffet. I’ll sit back and let them have the first pick. Then when the lines are empty, I will make my way up to the line to leisurely have my pick. Newsflash, the buffet isn’t going to run out of food.
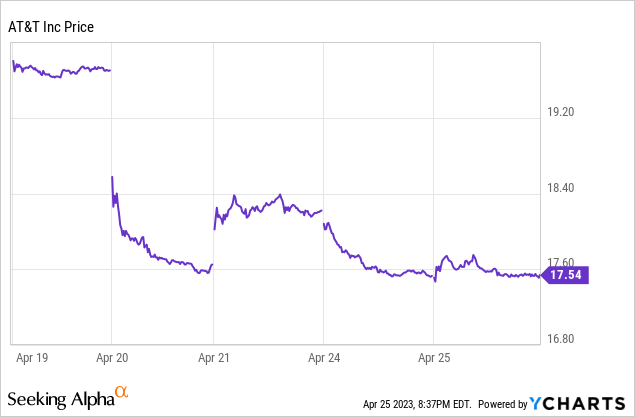
AT&T Inc. (NYSE:T) announced Q1 earnings on April 20th, and as always, Wall Street behaved pretty much like they always do – Sell First And Examine Details Later. All those investors were in a hurry to sell because of what they perceived as a “bad” quarter.
Marketwatch.com
The most important takeaway from the earnings report is that T’s core wireless and consumer wireline businesses performed well in Q1, and the FY 2023 guidance remains unchanged. Yet, headlines are designed to induce fear, despite being quite misleading. We will examine the details today.
Widening Moat Through Network Expansion
During Q1 2023, T continued expanding coverage of 5G and Fiber technologies, increasing availability to the American population. T’s mid-band 5G spectrum now covers over 160 million people; nationwide, 5G has reached 290 million people. T is currently positioned to serve fiber to 19.7 million consumers and more than 3 million business customer locations in more than 100 U.S. metro areas. During the quarter, the telecom company reported 424,000 postpaid phone net adds, and 272,000 Fiber net adds. Source.
AT&T Website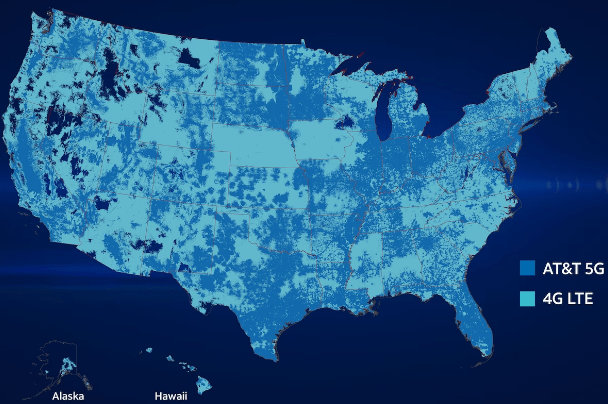
AT&T Website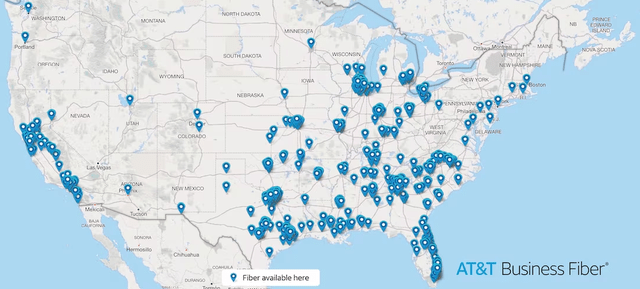
Revenue, Profitability, and Debt
T reported top-line growth in every business segment, and consolidated quarterly revenue rose to $30.14 billion. T’s EBITDA was $8.4 billion, up 8% YoY, with an EBITDA margin of 40.7% (up from 38.6% in Q1 2021).
Author’s Calculations
5G and Fiber buildout are significant expenses for global telecom companies, and T expects to spend $24 billion in Capital Expenditure for the fiscal year. Notably, $4.3 billion was spent in Q1 2023.
At the end of Q1, T reported that 95% of its debt was fixed at an average rate of 4.1%. The company continues to expect to achieve a net debt-to-adjusted EBITDA ratio to drop to the 2.5x range by early 2025.
The market didn’t really look at any of the parameters mentioned above, but was fixated on a specific metric with flawed expectations.
Let us talk about the Free Cash Flow
Let’s say you earn $4,000 monthly and spend approximately $3,000, leaving behind a healthy $1,000 towards savings. Suppose your Air Conditioner breaks down in August, and you spend $6,000 for a replacement. So you were at negative $5,000 for the month. Does that immediately term you an over-spender, meaning lenders will disqualify you for your loan application in September?
Free Cash Flow (“FCF”) is a non-GAAP metric and, most importantly, a lumpy one. Let me explain more. FCF is calculated as cash from the company’s operations plus the cash distributions from DIRECTV minus capital expenditures and cash paid for vendor financing. We know T is spending heavily on 5G and fiber rollout. Cash spent on Capex can be irregular or lumpy depending on when they invest in different projects. Major cash expenses are accounted for immediately and significantly impact quarterly numbers. This lumpiness makes quarterly FCF numbers less likely to indicate the annualized amount, much less the ability to gauge annual dividend coverage.
The market thinks that T’s quarterly dividend spend of $2 billion is not covered by the reported $1 billion quarterly FCF and is raising the 200% FCF payout ratio in a false alarm.
We believe the lumpy quarterly numbers could lead to misleading conclusions (as clearly seen from the company’s stock price performance since the earnings release).
Author’s Calculations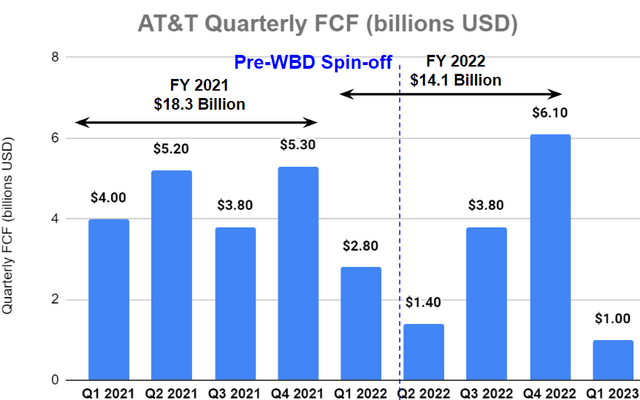
Combining the numbers of the last four quarters makes better sense (trailing 12 months, or TTM). The $12.3 billion TTM FCF adequately covered T’s $8 billion dividend for the same period at a 65% payout ratio.
Towards the end of Q4, management provided $16 billion in FCF guidance for FY 2023. This guidance was further affirmed after Q1 2023. Notably, management had told us after Q4 that they expect higher expenditure in Q1 and that the FCF will be higher as the fiscal year progresses.
Similar to last year, we expect greater free cash flow generation in the back half of the year based on higher capital investment levels and device payments in the first half of the year as well as the timing of the annual incentive compensation payout. – Pascal Desroches, CFO (Q4 2022 Earnings Transcript).
Looking at numbers from recent quarters, it is not unreasonable to expect the company to meet its projected annual $16 billion FCF.
…We came in exactly as we anticipated. Remember, in my commentary at the year-end when we gave guidance, we said that Q1 was going to be the low watermark for free cash flow for several reasons. One, it’s the highest quarter of device payments. Recall, Q4 holiday sales is the heaviest volume for devices we pay for those in Q1. You saw our capital spend is elevated relative to the annual guidance that we gave. And Q1 is the quarter we pay incentive comp. When you factor all those things in, along with our expectations that we will continue to grow EBITDA, we feel really good about delivering $16 billion or better. – John Stankey, CEO (Q1 2023 Earnings Transcript).
Looking into the TTM Adjusted Earnings Per Share (“EPS”), T maintains a 43% dividend payout ratio. Notably, the company’s quarterly dividend maintains coverage through Adj. EPS, which has been more consistent over between quarters.
Author’s Calculations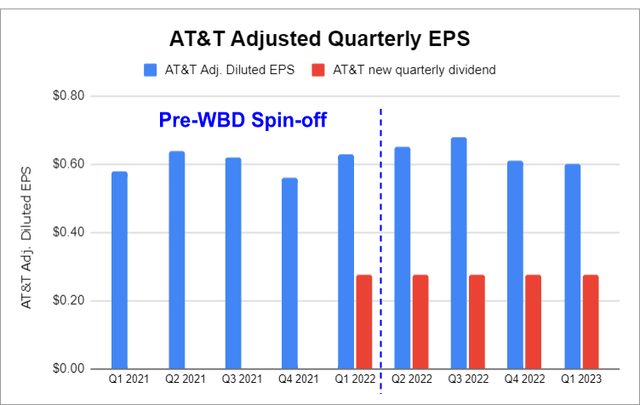
Investor disappointment is likely because, for Q1, Wall Street analysts had forecast a $3 billion FCF. Frankly speaking, we see no such number from any of the reports or interviews published by T or its leadership. How did the analysts come up with that number when management mentioned that Q1 FCF would be on the lower side?
The company’s FY 2023 FCF guidance of $16 billion adequately covers the $8 billion annual dividend spent and leaves a healthy amount behind for debt paydown. T trades at a 7.2x forward P/E ratio presenting a bargain at these levels, and WSJ analysts have a $22 median price target for the company (~21% upside from current levels).
Conclusion
AT&T’s Q1 results aligned with management guidance, and the 2023 outlook was reaffirmed. The company’s dividend remains adequately protected when looking at TTM performance numbers objectively. There is almost no fundamental reason for the steep selloff.
Wall Street analysts often have quarterly expectations and short-term price targets, which influence post-earnings stock movement. Remember, these analysts don’t work for you and aren’t as focused on the bigger picture as you think. Whether they are right or wrong with their expectations tells you more about the analysts than the company.
So while Wall Street races towards the exit, we are happy to step in and buy our income at a lower price. At HDO, we are buying more T which is part of our “model portfolio,” and carries an overall yield of +9%. AT&T Inc. is cheaply valued, and this panic-driven selloff is a gift to buy the dip. A qualified 6.3% yield for your prudence and patience through Mr. Market’s irrationality!
Analyst’s Disclosure: I/we have a beneficial long position in the shares of AT&T either through stock ownership, options, or other derivatives. I wrote this article myself, and it expresses my own opinions. I am not receiving compensation for it (other than from Seeking Alpha). I have no business relationship with any company whose stock is mentioned in this article.
Treading Softly, Beyond Saving, PendragonY, and Hidden Opportunities all are supporting contributors for High Dividend Opportunities.
Any recommendation posted in this article is not indefinite. We closely monitor all of our positions. We issue Buy and Sell alerts on our recommendations, which are exclusive to our members.
Seeking Alpha’s Disclosure: Past performance is no guarantee of future results. No recommendation or advice is being given as to whether any investment is suitable for a particular investor. Any views or opinions expressed above may not reflect those of Seeking Alpha as a whole. Seeking Alpha is not a licensed securities dealer, broker or US investment adviser or investment bank. Our analysts are third party authors that include both professional investors and individual investors who may not be licensed or certified by any institute or regulatory body.
