Summary:
- A mild recession is likely starting soon and the debt ceiling crisis threatens to turn that into a Great Recession-level “cataclysm” according to Moody’s, S&P, and Fitch.
- Stocks are modestly overvalued right now, including those of Microsoft Corporation, which soared 8% after blockbuster earnings.
- A 15% to 30% correction is likely what it will take for Congress to raise the debt ceiling. Moody’s estimates a default could result in a 33% to 38% market crash.
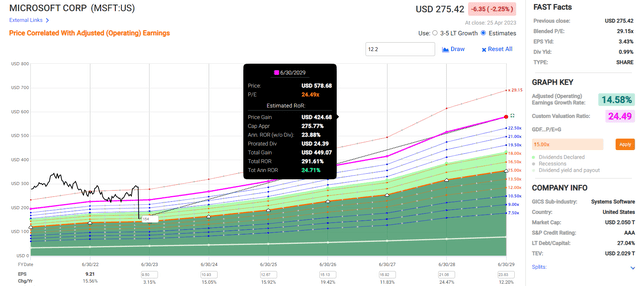
- Microsoft Corporation is as close to a perfect-quality company as exists, in the top 1% of the world’s best blue chips. It’s 13% overvalued, though it still offers about 100% return potential over the next six years (12% annually), twice the S&P consensus.
- This article shows you exactly at what prices Microsoft Corporation becomes a reasonable buy, good buy, strong buy, very strong buy, and Buffett-style “fat pitch” buy, boosting 6-year return potential as high as 250% (22% annually). In other words, I’ll show you exactly when it’s time to buy Microsoft with both hands in the coming market mayhem.
Mykola Sosiukin
This article was published on Dividend Kings on Wed, April 26th.
—————————————————————————————
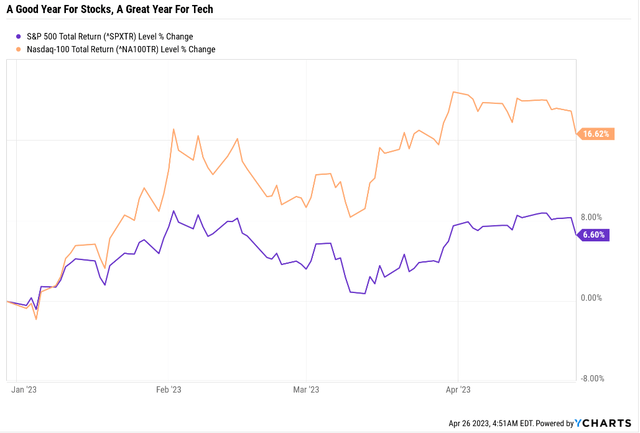
It’s been a very good year for stock investors so far, and a fantastic year for tech investors.
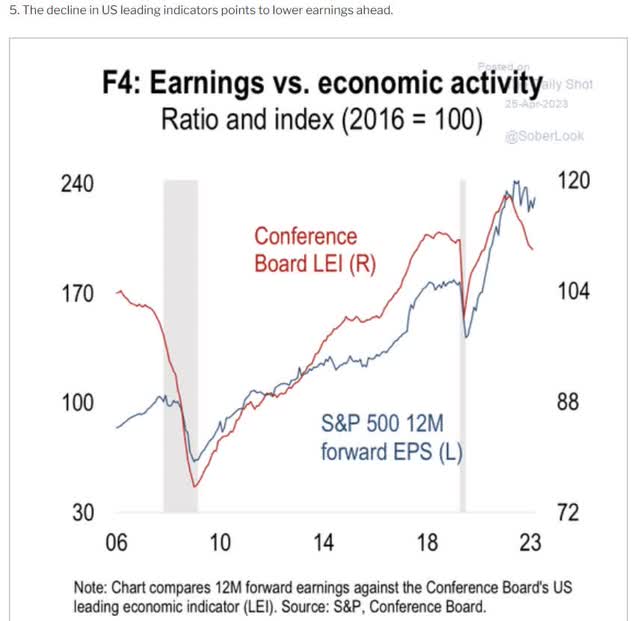
How is that possible when we’re likely headed for a mild recession starting as early as July?
How does this make sense when earnings likely fall significantly, to 200 to 215 on the S&P?
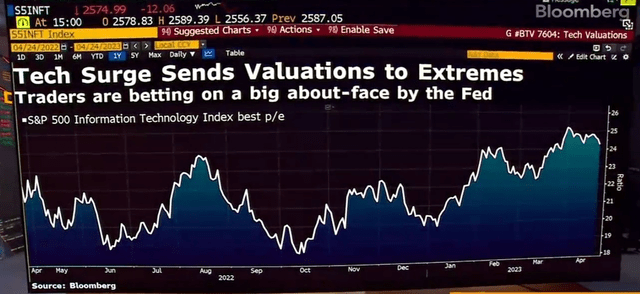
Fed “hopium” is the most likely explanation for the 16% tech rally so far.
According to Bloomberg, tech traders are now pricing in a 3% cut by the Fed.
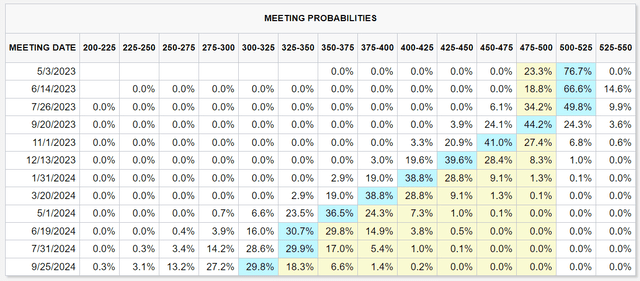
Bond market pricing in 3% long-term rates by Sept 2024.
So tech is priced for 2% rates. The bond market says 3% long-term. And rates are headed to 5% in May.
So does this mean that none of the tech rally is justified? Are we back to tech bubble 2.0 levels of silliness?
Nasdaq Historical P/E
| Year | P/E |
| 2008 | 13.69 |
| 2009 | 20.2 |
| 2010 | 18.11 |
| 2011 | 15.47 |
| 2012 | 14.58 |
| 2013 | 19.5 |
| 2014 | 21.24 |
| 2015 | 18.36 |
| 2016 | 21.96 |
| 2017 | 24.69 |
| 2018 | 21.06 |
| 2019 | 24.19 |
| 2020 | 33.78 |
| 2021 | 26.97 |
| 2022 | 25.54 |
| 2023 | 25.82 |
| 2024 | 21.61 |
| 2025 | 18.90 |
| 15-Year Average | 22.10 |
| 15-Year Median | 21.24 |
| 10-Year Average | 24.36 |
| 10-Year Median | 24.44 |
| 5-Year Average | 27.26 |
| 5-Year Median | 25.82 |
| 12-Month Forward | 25.63 |
| Historically Overvalued | 4.88% |
(Source: FactSet Research Terminal.)
Not really. Tech stocks are worth about 24X earnings based on their 10-year median P/E, and today the Nasdaq trades at a 5% historical premium.
So if bears tell you that tech stocks are once more set to crash 50%, similar to the tech crash of 2000 to 2002, they are full of hot air.
Ok, but what about the recession? Don’t earnings usually fall during those? So won’t that P/E look a lot higher if earnings decline?
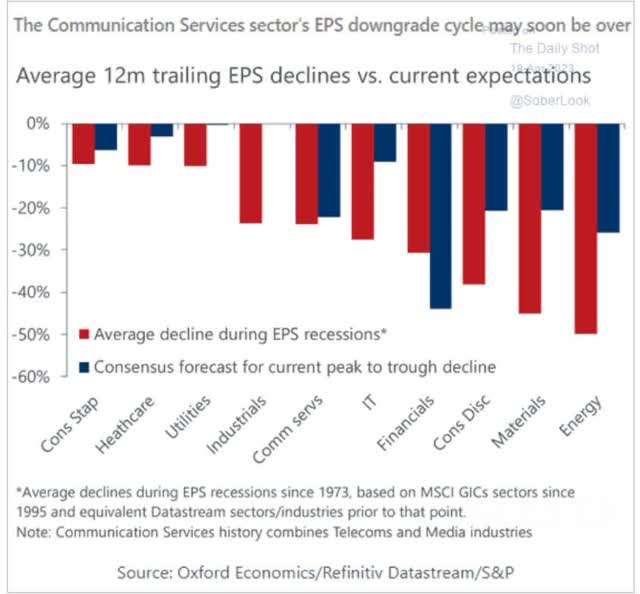
Indeed, tech earnings average around 25% EPS declines during recessions, which means that tech is likely a lot more overvalued than it seems.
The bad news for tech investors is that the recession is absolutely not priced in right now.
Nasdaq Annual Growth By Metric
(Source: FactSet Research Terminal)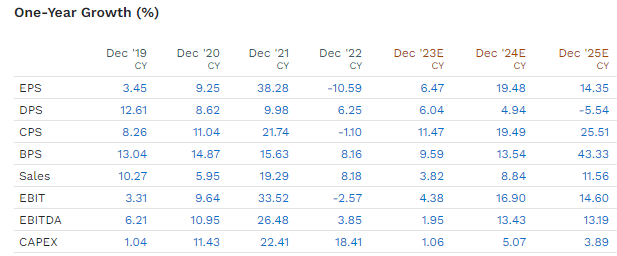
In 2022 tech earnings fell 11%, so about half of the historical -25%. But in 2023, analysts expect 6.5% EPS growth, a fantastic 19% earnings boom in 2024 and very solid 14% in 2025.
What if we avoid recession though? Might not earnings beat expectations? Might tech earnings not grow 10+% this year and thus close the valuation gap?
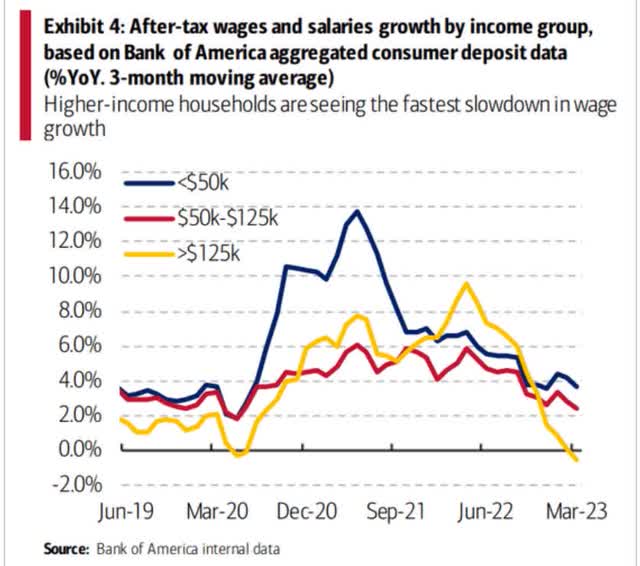
Given that discretionary wage growth is falling and is now negative for the richest Americans (who power 40% of US GDP with their spending) the odds of avoiding recession don’t look great right now.
All of this means that a 15% to 30% market correction remains the most likely outcome in the 2nd half of 2023.
- historically speaking, September or October is the likely market bottom.
This brings me to the topic of this article, why you shouldn’t necessarily be buying Microsoft Corporation (NASDAQ:MSFT) now but be ready to buy with both hands in the likely correction that’s coming in a few months.
Why a few months? Here’s one big reason.
Debt Ceiling Crisis Of 2023 Is Likely To Trigger The Final Phase Of The Bear Market
US Treasury
Goldman Sachs estimates that the US is currently on track to default on its debt in mid-July, and the Treasury Department’s own daily General Account statements confirm this.
The U.S. government has collected 35 percent less in tax revenue this year than at the same time in 2022, according to a recent analysis released by Moody’s Analytics economists Mark Zandi and Bernard Yaros. “They’re going to come to a point in early June when they don’t have enough cash to pay everyone on time,” Zandi said.
The Moody’s Analytics team previously estimated lawmakers had until sometime in mid-August to act on the debt ceiling.
Goldman Sachs economists also noted in a report last week that while they still believe the U.S. won’t run out of cash until July, the “odds of an early June deadline have edged up” when looking at non-withheld income tax receipts.
The Treasury could see another boost in non-withheld tax payments around a mid-June deadline, according to experts, which could buy lawmakers more time. Even so, they won’t know until they receive further data from the Treasury in the coming days.” – CNN (emphasis supplied).
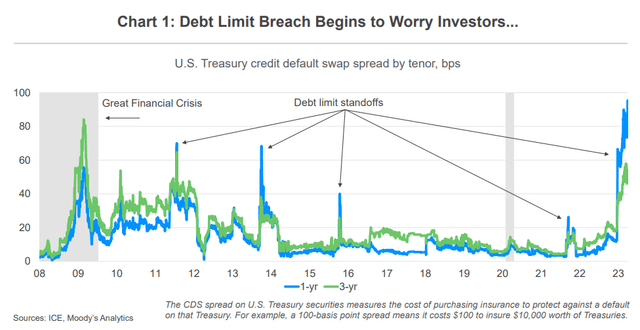
The bond market is currently pricing in the highest default risk in history, far worse than the 2011, 2013, or 2016 debt ceiling standoffs.
- since 1917, the U.S. has raised the debt ceiling 90 times every year or two.
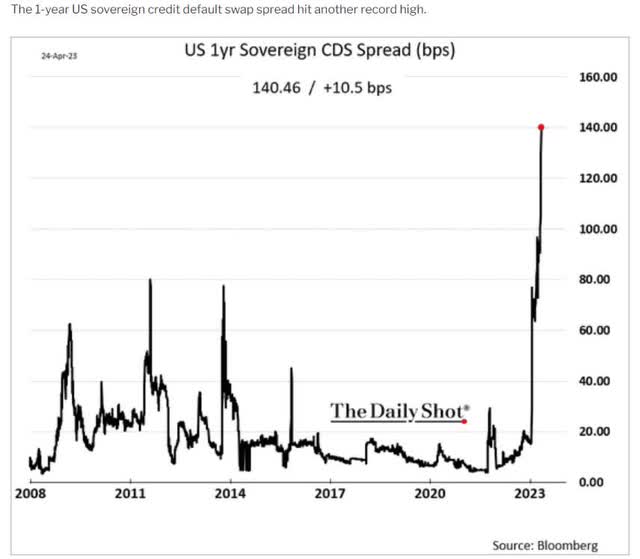
In fact, according to Bloomberg’s estimates, the risk of default is 1.4%.
Before you freak out over this chart, remember that the 1.4046% risk of default is about half that of the 2.5% risk of nuclear war with Russia (according to Goldman).
Speaker McCarthy has a plan he hopes to pass in the House this week to raise the debt ceiling by $1.5 trillion and push off potential default until March 31st, 2024.
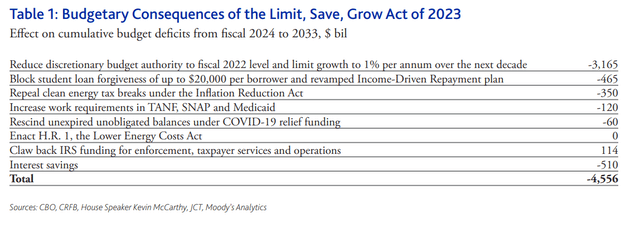
Moody’s estimates it would reduce the deficit by $4.5 trillion over the next decade, while the Congressional Budget Office estimates $4.8 trillion.
The White House has said it will veto this bill if it passes the Senate, which it has virtually no chance of doing.
- at the moment there is a good chance it doesn’t even pass in the House.
Why? For one thing, even Republicans are not thrilled at the prospect of having to go through debt ceiling theater in mid-2024.
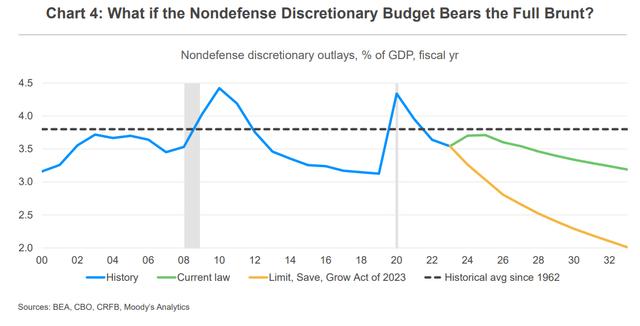
Second, the current proposal cuts discretionary spending significantly over the next decade, possibly much more if defense spending isn’t touched, which is what McCarthy is proposing.
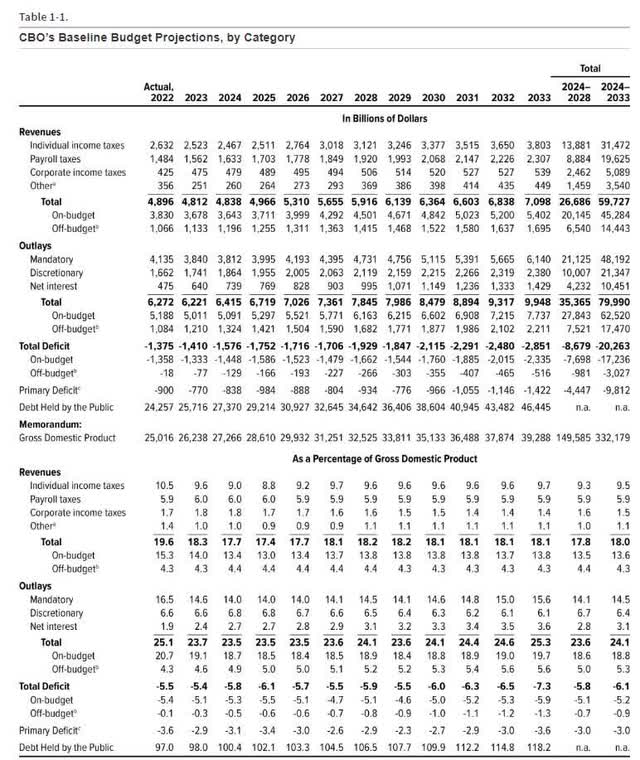
Under the Limit, Save, Grow Act or LSGA, annual discretionary spending would be 1.3% of GDP lower in 2033, or $2.6 trillion. For context, in 2022, the Federal government spent $6.27 trillion. And the CBO estimates that in 2033 the government’s spending will be just under $10 trillion.
In effect, what McCarthy proposes would cut the deficit by 25% by 2033 at the cost of 27% lower non-defense discretionary spending.
US Treasury Department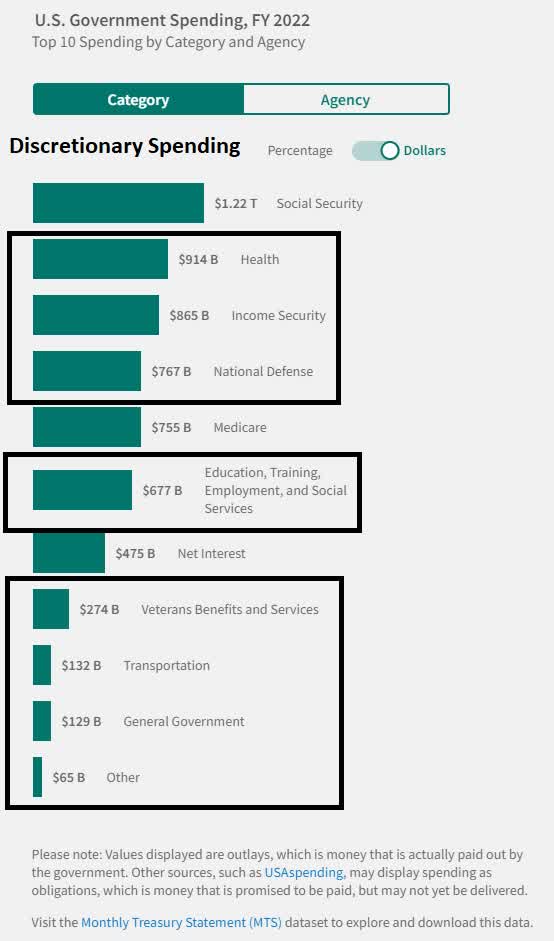
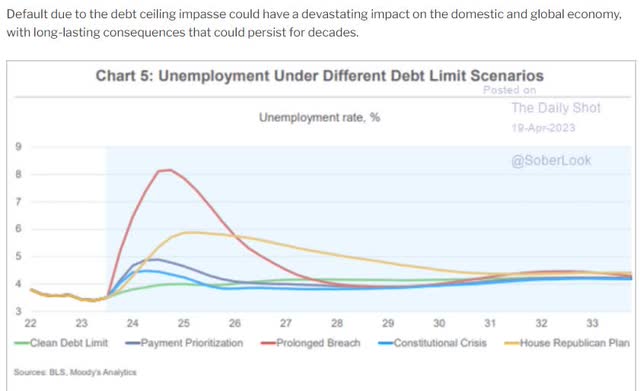
So the standoff continues for now, and what Moody’s, S&P, and Fitch call a potential “cataclysmic” financial crisis is inching closer by the day.
If we default for two months Moody’s estimates 7.5 million Americans will lose their jobs, the economy will contract 4% to 5% (the Great Recession was 4.6%), and the stock market will fall 33% to 38%.
- 2,550 to 2,750 for the S&P
- 43% to 48% peak decline from all-time-high.
How The Stock Market Will Save Us From Government Stupidity
Studies show that 80% of government policy is set by the top 20% of the wealthiest Americans.
Guess who owns the vast majority of the stock market?
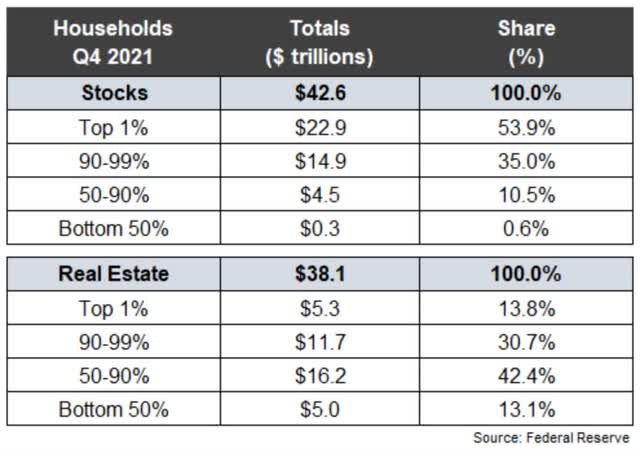
The 10% richest Americans own 90% of the stock market. The top 20% own about 95%.
- U.S. stocks worth $40.5 trillion at the end of 2022
- now worth $43 trillion.
So what would a 33% to 38% decline in stocks that Moody’s estimates are coming if the U.S. government bungles us into the 2nd Great Recession by defaulting on our debt?
- $14 to $16 trillion in stock market losses
- the top 20% would lose $14 trillion in a matter of months.
Do you think the rich are going to allow this to happen? Or are they going to call their lobbyists, who will call Congress and get them to avoid disaster, if only at the last minute?
So the good news is that if the stock market falls hard enough, Congress will act, and the debt ceiling financial crisis will be averted.
The bad news is that if the stock market doesn’t fall hard and fast, the rich won’t have any reason to force the government to raise the debt ceiling.
The good news is that if nothing is done, a “financial cataclysm” is 100% coming soon.
Further good news is that the stock market can’t ignore this obvious fact for long.
- Week of April 27th big tech earnings seasons
- Week of May 5th, Apple earnings, Fed decision, jobs report
- Week of May 12th, inflation data
- Week of May 15th Federal Republic $100 billion government loans are due (liquidation will begin on May 20th if it can’t repay or it isn’t rescued).
The next month has a lot of other news the market is going to focus on.
But by the end of May, there will be just one thing the market will be forced to focus on, the impending debt ceiling doomsday clock, relentlessly ticking down towards a $15 trillion stock market meltdown.
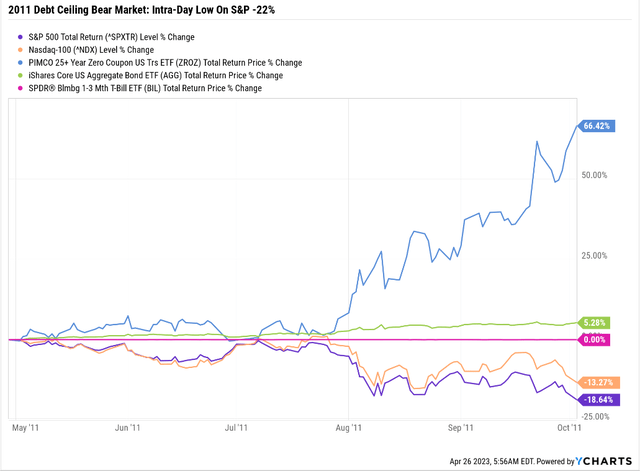
S&P and Goldman Sachs (GS) think the 2023 debt ceiling crisis could be a lot like 2011’s.
Specifically, we’ll come down to the wire on default.
- In 2011 we came within two days of defaulting.
So is it time to panic? Sell everything and go into bonds? No.
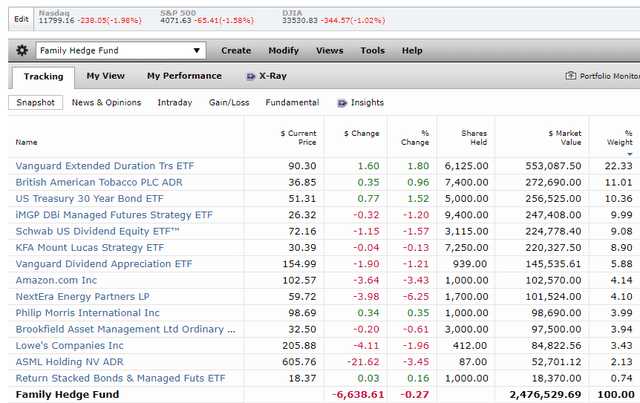
$1.25 Million In Stocks Protected By $750,000 In Long Bonds And $500,000 In Managed Futures
My family’s hedge fund isn’t selling our $1.25 million in stocks, even with a 10% chance of a potential $500,000 medical bill in the next few months.
If we get a replay of the 2011 debt ceiling crisis and long bonds soar about 60%, then the medical bills (which we hopefully won’t have to pay) would be covered 100% by bond gains.
- A side benefit is that the portfolio could withstand a 40% decline in stocks with virtually zero declines for the overall portfolio.
But guess what all smart investors who own bonds due when the market crashes and bonds soar?
Rebalancing Out Of Excess Bonds And Into Blue-Chip Bargains
My family’s target allocation for long bonds is 11.1%.
Dividend Kings ZEUS Income Growth Portfolio: What My Family Hedge Fund Is Working Towards
Dividend Kings ZEUS Portfolio Tracker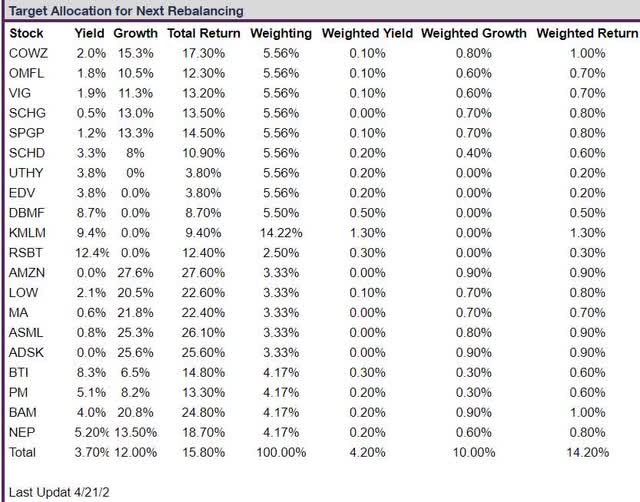
In the 90% chance that we don’t have to pay an extra $500,000 in medical expenses, we’ll be able to potentially rebalance about $700,000 worth of excess bonds into undervalued blue-chips.
- 3 years of DCA stock buying
- near the final market bottom.
Get Ready To Buy Microsoft With Both Hands
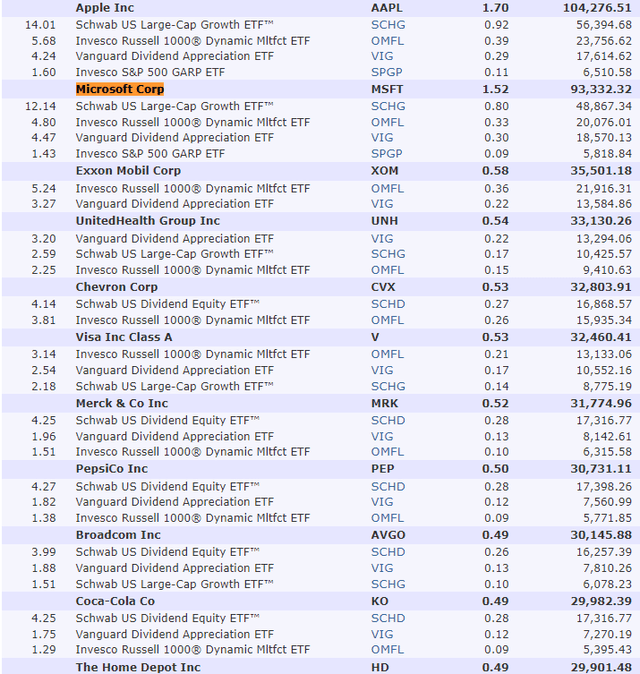
I’m not planning to buy Microsoft directly, but my family’s fund will own about $47,000 by the end of the year.
- currently, we own $6500 worth of MSFT via 4 ETFs.
Stock Allocations On $6 Million Portfolio (Cut These Numbers In Half For My Family’s Actual Portfolio By the End Of 2023)
But here’s why Microsoft fans should be ready to back up the truck on MSFT if it falls significantly in the coming debt ceiling crisis correction.
Microsoft Is The Ultimate Tech Utility
Just look at Microsoft’s latest earnings results to see why it’s as close to God’s dividend growth stock as exists.
- 100% quality, very low risk 13/13 Ultra SWAN future aristocrat
- 4th highest quality company on the Dividend Kings 500 Master List (99th percentile among the world’s best blue-chips).
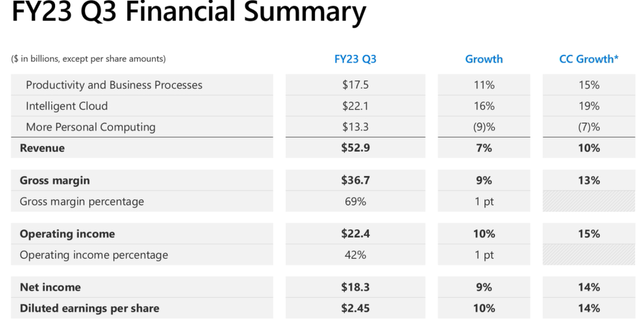
In a quarter when the S&P is reporting -6% EPS growth, MSFT grew its top line at 10% (in constant currency) and its bottom line at 14%.
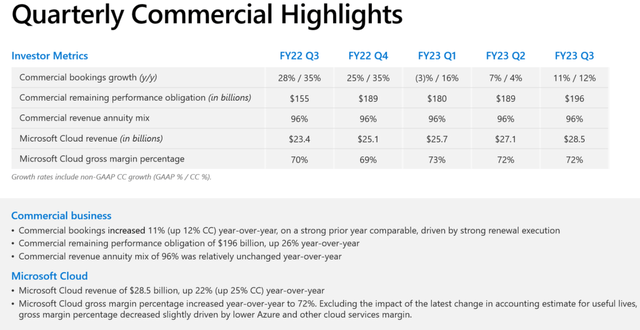
The commercial business is showing no signs of weakness in enterprise spending with bookings up 12% YOY and 96% of that revenue being recurring subscription revenue.
Cloud computing, a concern going into the quarter, saw sales rise 25% YOY, much better than many had feared.
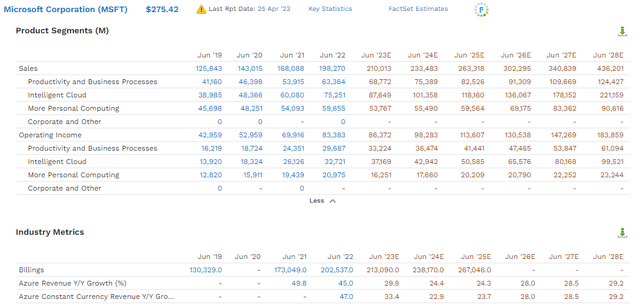
Azure revenue is expected to grow 33% this year and keep growing at solid 24% to 29% rate through 2028.
Cloud computing is expected to grow 21% annually through 2028 to $222 billion. For context, MSFT is expected to generate $210 billion in revenue for the entire company this year.
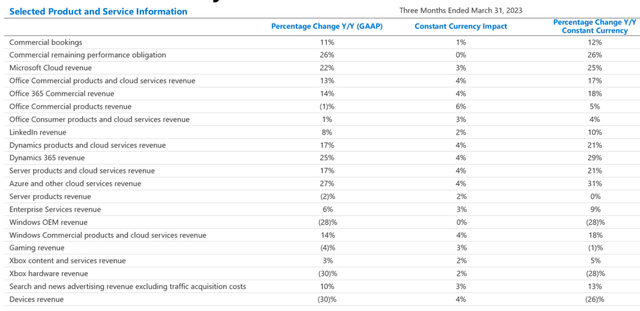
LinkedIn grew 10%, Office 365 grew 11%, and the consumer business grew 4%.
Computer sales were down 7%, but compared to Apple’s 40% decline, that was a triumph.
In a tough quarter for corporate America in this earnings recession, adjusted free cash flow fell 5%, and the company returned $9.7 billion to shareholders via dividends and buybacks.
Buybacks are expected to be $24 billion this year and grow to $34 billion by 2028.
- $183 billion in cumulative consensus buybacks by 2028.
MSFT is paying $20 billion per year dividend dividends, and that’s expected to grow to $35 billion by 2028.
- 11.5% consensus dividend growth
- $165 billion in cumulative consensus dividends by 2028.
That’s a consensus shareholder return of $348 billion by 2028.
Free cash flow is expected to be a record $90 billion this year and grow to $140 million by 2028.
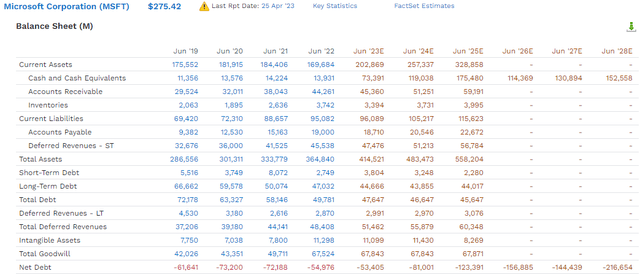
Despite $350 billion in buybacks and dividends, MSFT’s net cash position is expected to grow to $217 billion (including deferred subscription revenue) by 2028.
MSFT is showing little signs that the coming recession is hurting its business.
Seeking Alpha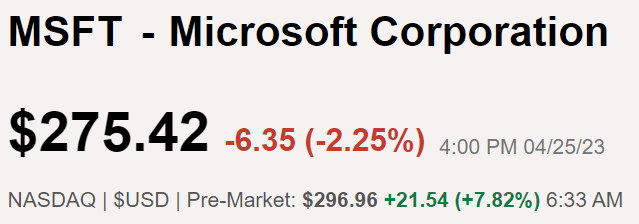
Which is probably why it popped 8% after earnings.
But its great quarter or recession-resistant business model doesn’t justify that rally.
Microsoft Is Modestly Overpriced
| Metric | Historical Fair Value Multiples (11-Years, Nadella Era, New Business Model) | 2022 | 2023 | 2024 | 2025 | 2026 |
12-Month Forward Fair Value |
| Earnings | 24.49 | $227.27 | $250.04 | $289.72 | $345.06 | $389.88 | |
| Average | $227.27 | $250.04 | $289.72 | $345.06 | $389.88 | $263.01 | |
| Current Price | $296.96 | ||||||
|
Discount To Fair Value |
-30.67% | -18.76% | -2.50% | 13.94% | 23.83% | -12.91% | |
| Upside To Fair Value | -23.47% | -15.80% | -2.44% | 16.20% | 31.29% | -10.52% | |
| 2023 EPS | 2024 EPS | 2023 Weighted EPS | 2024 Weighted EPS | 12-Month Forward EPS | 12-Month Average Fair Value Forward PE | Current Forward PE |
Current Forward Cash-Adjusted PE |
| $10.21 | $11.83 | $6.87 | $3.87 | $10.74 | 24.5 | 27.7 | 17.9 |
In the Nadella/cloud computing era, MSFT’s market-determined fair value is about 24.5X earnings or $263.
After the post-earnings spike, it’s trading at a 13% premium to fair value.
| Rating | Margin Of Safety For Very Low-Risk 13/13 Ultra SWAN | 2023 Fair Value Price | 2024 Fair Value Price | 12-Month Forward Fair Value |
| Potentially Reasonable Buy | 0% | $250.04 | $289.72 | $263.01 |
| Potentially Good Buy | 5% | $237.54 | $275.23 | $249.86 |
| Potentially Strong Buy | 15% | $212.54 | $246.26 | $223.56 |
| Potentially Very Strong Buy | 25% | $178.16 | $217.29 | $197.26 |
| Potentially Ultra-Value Buy | 35% | $162.53 | $188.32 | $170.96 |
| Currently | $296.96 | -18.76% | -2.50% | -12.91% |
| Upside To Fair Value (Including Dividends) | -14.88% | -1.52% | -10.52% |
MSFT is currently a hold.
Microsoft 2029 Consensus Total Return Potential
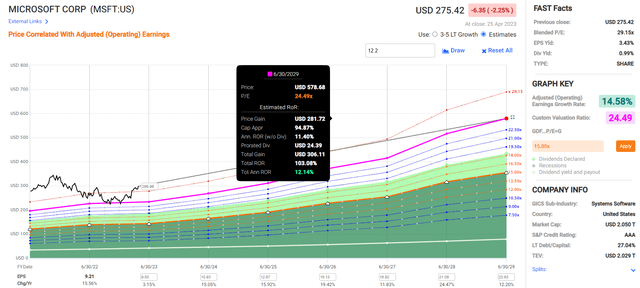
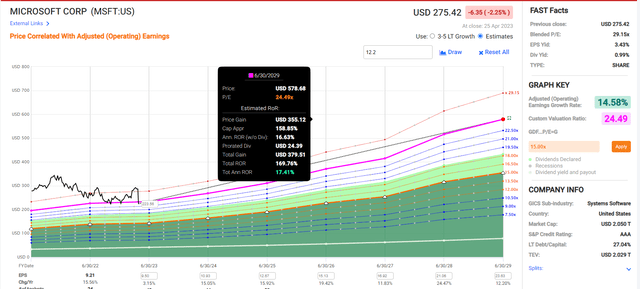
If MSFT grows as expected and returns to historical fair value, you can expect around 100% returns over the next six years, or about 2X the S&P consensus.
Here is the return potential from its fair value of $263.01.
Microsoft 2029 Consensus Total Return Potential (From Fair Value, $263.01) Reasonable Buy Price
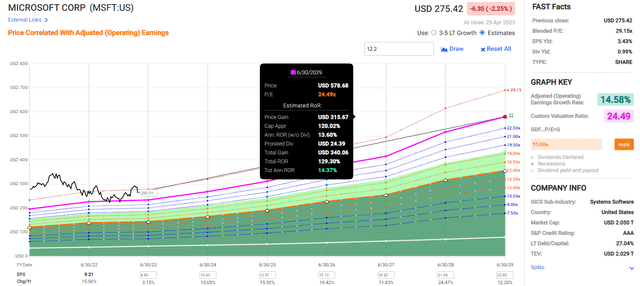
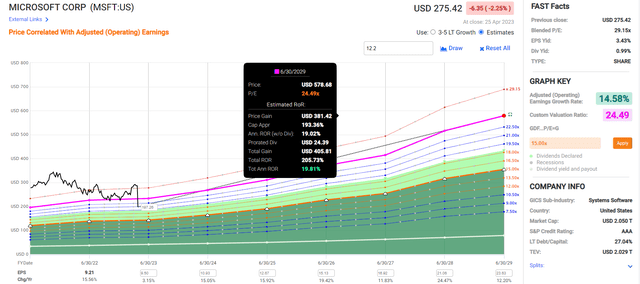
Microsoft 2029 Consensus Total Return Potential (From 5% Discount, $249.86) Good Buy Price
Microsoft 2029 Consensus Total Return Potential (From 15% Discount, $223.56) Strong Buy Price
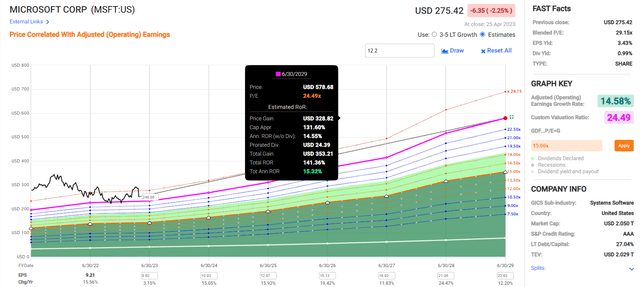
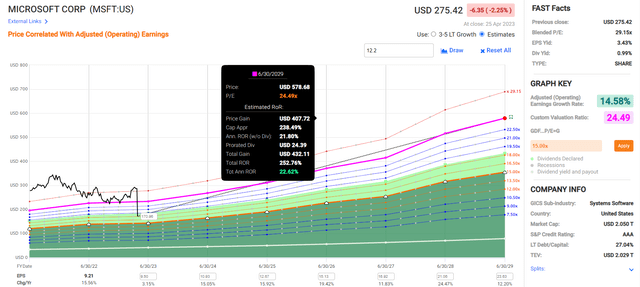
Microsoft 2029 Consensus Total Return Potential (From 25% Discount, $197.26) Very Strong Buy Price
Microsoft 2029 Consensus Total Return Potential (From 35% Discount, $170.96) Ultra Value, Buffett-Style “fat pitch,” table-pounding Strong Buy Price
Bottom Line: Get Ready To Buy Microsoft With Both Hands
Let me be very clear that the reasonable buy price, good buy price, strong buy price, and ultra value prices shown about are NOT PRICE TARGETS.
I’m not a market timer, and I’m NOT PREDICTING MSFT IS GOING TO FALL TO THOSE PRICES.
I’m saying that based on this world-beater’s fundamentals, those are the prices at which MSFT goes from an OK investment today to a wonderful or even life-changing investment.
I’m not saying that the debt ceiling crisis of 2023 is going to 100% guarantee MSFT falls to even its fair value price.
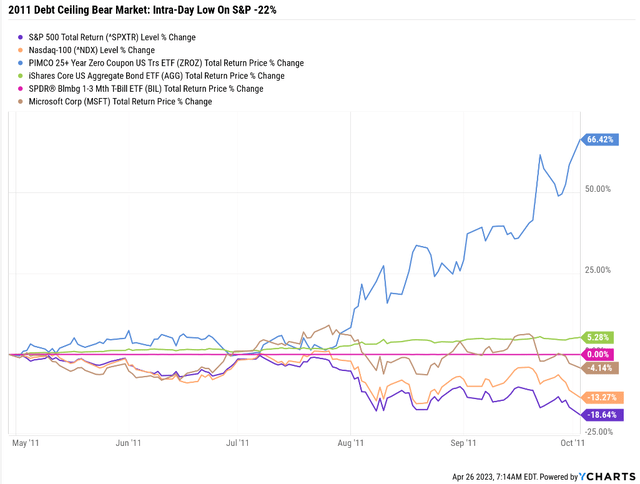
In the 2011 debt ceiling crisis, when the market fell 22% intraday, MSFT only fell 4% and spent much of its time positive.
- Though it was trading at 10X earnings at the start of that bear market.
MSFT has a historical beta of 1.25, meaning that it usually falls 1.25X as much as the S&P.
What does that mean for anyone looking to bargain hunt MSFT?
That if the S&P falls 15% to 30% in the coming weeks (what fundamentals justify) that MSFT COULD FALL 19% to 37%.
- about $186 to $240.
If Moody’s is correct, and in the 1.4% chance of a debt ceiling default, a 33% to 38% decline in the S&P COULD trigger a 41% to 48% decline in MSFT.
- about $154 to $175.
Are those best case scenario prices (from MSFT buyer perspectives) likely? Heck no.
Would even another financial crisis justify them? Heck no.
- $154 on MSFT would be 14.3X earnings and 9X cash-adjusted earnings
- MSFT would be 47% undervalued at this price.
Microsoft’s Total Return Potential In The Less Than 1.4% Chance A U.S. Debt Default Causes It To Get Cut In Half
Most likely, MSFT will end up a reasonable buy or good buy, because we’re not going to default on the debt.
The stock market correction will see to that when the richest Americans call Congress and tell them to get off their asses and do their jobs.
But for a company of this safety and quality, as close to a perfect quality company as exists, and in the top 1% of the world’s best blue-chips, a 5% to 15% discount is more than enough to warrant buying with both hands.
And if Microsoft Corporation becomes slightly more undervalued than that in a complete market panic? Well, I’ll make sure to point out that it’s a backup the truck, table-pounding buy in a future article.
Analyst’s Disclosure: I/we have no stock, option or similar derivative position in any of the companies mentioned, and no plans to initiate any such positions within the next 72 hours. I wrote this article myself, and it expresses my own opinions. I am not receiving compensation for it (other than from Seeking Alpha). I have no business relationship with any company whose stock is mentioned in this article.
I own $6500 worth of MSFT via four ETFs.
Seeking Alpha’s Disclosure: Past performance is no guarantee of future results. No recommendation or advice is being given as to whether any investment is suitable for a particular investor. Any views or opinions expressed above may not reflect those of Seeking Alpha as a whole. Seeking Alpha is not a licensed securities dealer, broker or US investment adviser or investment bank. Our analysts are third party authors that include both professional investors and individual investors who may not be licensed or certified by any institute or regulatory body.
—————————————————————————————-

Dividend Kings helps you determine the best safe dividend stocks to buy via our Automated Investment Decision Tool, Zen Research Terminal, Correction Planning Tool, and Daily Blue-Chip Deal Videos.
Membership also includes
-
Access to our 13 model portfolios (all of which are beating the market in this correction)
-
my correction watchlist
- my $3 million family hedge fund
-
50% discount to iREIT (our REIT-focused sister service)
-
real-time chatroom support
-
real-time email notifications of all my retirement portfolio buys
-
numerous valuable investing tools
Click here for a two-week free trial, so we can help you achieve better long-term total returns and your financial dreams.

