Summary:
- Cloud results across the big 3 public cloud providers saw Microsoft overtake Amazon in terms of cloud revenue.
- This has occurred against the backdrop of Microsoft becoming a more cloud-centric company, with a much larger proportion of its revenue tied to cloud services than the other 2.
- Nonetheless, looking at the relative valuations across these 3 indicate that a lot of this is already priced in for Microsoft – but that Google still looks cheap.

TU IS/iStock via Getty Images
Overview
The past week saw the 3 largest public cloud providers all release earnings for Q1 2023. The picture as a whole was admittedly mixed, although overall the results came in above consensus across the board. While growth rates may have moderated for these companies, cloud services are still growing in the double digits.
The market’s response to these earnings reports was distinct for each company’s shares.
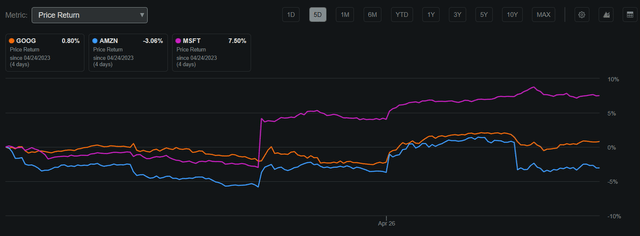
- Google (NASDAQ:GOOG) (NASDAQ:GOOGL) experienced some minor upticks but ended the week only up .80%, a statistically insignificant level of appreciation.
- Amazon (NASDAQ:AMZN) saw strong buying in the wake of its earnings but was sold off to actually end the week in the red by 3.06%.
- Microsoft (NASDAQ:MSFT) saw significant buying in the wake of its earnings and was able to carry this strength through to the end of the week.

Seeking Alpha
As per the price action that we saw in the market, we can conclude that Microsoft had the strongest earnings release of the 3.
In the wake of this busy week it is sensible to refresh our understanding of these 3 companies as well as their cloud offerings. This article will do so and evaluate relative performance and valuation across these firms.
Cloud Performance
Comparing cloud performance across these 3, there is an immediate standout metric: Microsoft’s cloud revenues have now exceeded that of Amazon’s.
|
Cloud |
Q1 ’23 Revenue (Billions) |
YoY Growth |
|
Amazon Web Services |
$21.4 |
16% |
|
Intelligent Cloud/Azure |
$22.1 |
17% |
|
Google Cloud Platform |
$7.5 |
28% |
Source: Author’s Excel Spreadsheet, Data from Seeking Alpha
Worth noting is the nuance here. Microsoft reports several cloud metrics, with an overall ‘Microsoft Cloud’ number that is significantly higher at $28.5B. Since that number includes services that are not readily comparable to the cloud offerings of AWS/Google, I am using here the more focused ‘Intelligent Cloud’ metric.

Seeking Alpha

Seeking Alpha
This is a major shift in the cloud business and the first time that Amazon is no longer the unequivocal market leader; Microsoft might just be the new ‘king of cloud’.
Cloud Composition
As mentioned, each of these companies is quite complex and has multiple streams of revenue. I believe it’s helpful to quickly see to what extent cloud composes the revenues of each of these firms; this can be useful for determining the nature of one’s exposure when owning these securities.
As we can see, Microsoft is the most cloud-centric company out of these 3, even considering the leaner Intelligent Cloud metric. It is well-known that Amazon is highly diversified, but it is interesting to see that AWS is not even 20% of its revenue base at this point. Google is undoubtedly still a search and advertising company.
|
Company |
Q1 ’23 Revenue (B) |
Q1 ’23 Cloud Revenue (B) |
Cloud Percentage |
|
Amazon |
$127.4 |
$21.4 |
16.77% |
|
Microsoft |
$52.9 |
$22.1 |
41.78% |
|
|
$69.8 |
$7.5 |
10.68% |
Source: Author’s Excel Spreadsheet, Data from Seeking Alpha
What this tells me is that owning Microsoft stock is a much more direct play on cloud services than the other 2. I will also note that it is good to see this level of focus from a managerial perspective. Furthermore, I continue to believe that all 3 of these have significant economies of scale around providing cloud services as they are all digital-first businesses with massive server farms.
Relative Financials
Given the excellent economies of providing cloud services, as well as the differing levels of cloud revenue contribution for each of these 3 firms, we should expect to see disparities as to certain financial metrics across the 3.
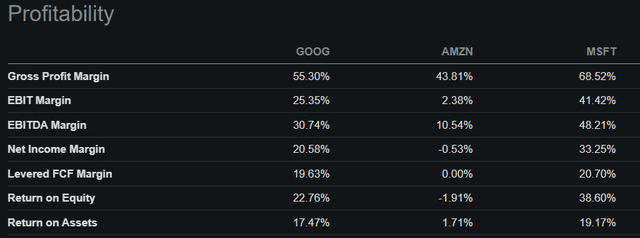
On a TTM basis, we can see yet again that Microsoft is a standout across several key financial metrics. Compared to Amazon and Google, it has a higher gross margin, EBITDA margin, and net income margin.
Amazon’s conglomerate nature comes to light when we look at these numbers relative to the other two. Nonetheless, we should note that Microsoft appears to be materially more capital efficient than Google as well – and Google is also a purely digital business.
What I garner from this is that Microsoft is a well-run company that is reaping the superior economics of providing cloud services; it has earned its multiple, if you will.

Seeking Alpha
Growth and Valuation
Prior to getting into valuation, I want to make clear that I believe each of these are still growth stocks. While their growth rates have come down from the blistering rates that each of these firms saw in their respective prime, I am of the opinion that things will pick back up for all of them.
This is because these companies are very well-positioned around secular growth trends within technology. They have made the investments to reap earnings from the ongoing growth of things such as cloud and artificial intelligence. As such, I prefer to look at them from a growth lens and focus on metrics that are particularly salient for growth stocks.
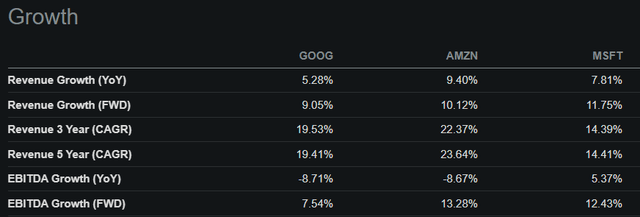
Here the picture becomes significantly more nuanced. Amazon may be a conglomerate, but it is definitely a growing one; both its 3 year and 5 year TTM compound annual growth rates are ahead of the pack. Microsoft appears to have only come into its own this year; it’s trailing metrics lag the other two significantly. On a pure YoY TTM basis, Amazon still takes the lead.

Seeking Alpha
This slate of comparisons serves to remind us how fast-changing the technology sector remains. While each of these has a different standing in the current news cycle, seeing things over the last 3-5 years shows us that Google has (contrary to pre-earnings consensus) continued growing well and Microsoft could be considered to be making a comeback.
Looking over to valuation metrics, we can see that there are significant disparities across the 3. Since these are growth stocks, however, we must keep in mind that trailing valuations are much less significant than those that are future-focused. The PEG ratio is particularly relevant for this, as it incorporates the price, earnings, and the growth rate. Here we see that Google is definitely looking like a buy and that Microsoft is still cheap compared to Amazon for the year ahead.

Seeking Alpha
Conclusion
Looking at all of these factors in conjunction, I am going to say that Microsoft appears to be fairly priced, Amazon looks relatively expensive, and Google looks cheap. Since I am bullish on all 3 for the long term, however, I would not rate any of them a sell. It appears that Google continues to be the cheapest on a relative basis and a buy on the merits of its financials and its growth rate.
Analyst’s Disclosure: I/we have a beneficial long position in the shares of GOOG, AMZN, MSFT either through stock ownership, options, or other derivatives. I wrote this article myself, and it expresses my own opinions. I am not receiving compensation for it (other than from Seeking Alpha). I have no business relationship with any company whose stock is mentioned in this article.
Seeking Alpha’s Disclosure: Past performance is no guarantee of future results. No recommendation or advice is being given as to whether any investment is suitable for a particular investor. Any views or opinions expressed above may not reflect those of Seeking Alpha as a whole. Seeking Alpha is not a licensed securities dealer, broker or US investment adviser or investment bank. Our analysts are third party authors that include both professional investors and individual investors who may not be licensed or certified by any institute or regulatory body.
