Summary:
- Google is displaying the classic signs of a star athlete trying to avoid the inevitability of old age and the associated decline in performance.
- In its most recent quarter, management has taken to making accounting policy adjustments in order to maintain headline profitability and improve the profitability of its key growth engine (Google Cloud).
- Google is primarily a digital advertising company but revenue growth is starting to become much harder for the advertising giants – Google and Meta Platforms.
- Unless the Other Bets division can develop a new growth winner, Google investors are placing all of their chips on the continued growth and newly found profitability of Google Cloud.
- My scenario indicates that Google is at the upper end of its intrinsic value. Any strength in the share price in the near term may offer an opportunity for investors to reposition their exposure to this stock.
Justin Sullivan
Business Description
Alphabet Inc (NASDAQ:GOOG) (GOOL) is essentially a holding company with its largest business being Google. It also includes a group of start-up companies in a division called Other Bets. Most of Alphabet’s revenues come from selling online advertising on one of its internet applications or platforms but increasingly revenues are also being generated from its internet cloud platform businesses.
Alphabet has grown its revenues over the years predominantly organically and through many relatively small acquisitions (it is fair to say that the company is a serial acquirer).
The company over the last 10 years has spent $19,265 M on acquisitions but it has invested $178,481 M in capex and $206,711 M in expensed research and development.
In its most recent 10-K, Alphabet reported the following information about its sources of revenues and operating margins for some divisions:
Author’s compilation using data from Alphabet’s 2022 10-K filing.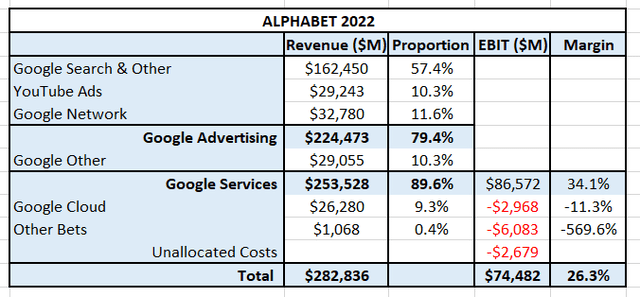
Business Overview
The previous table clearly shows how important the digital advertising market is to Alphabet – 79% of its revenues and almost all its profitability comes from this market.
Digital Advertising Market
Alphabet sells advertising on its own platforms and sells advertising to web-site owners allowing them to monetize their sites by displaying advertising. Typically, the advertising content is tailored to each individual user based on the individual’s use of the site’s content.
The global Advertising market is relatively mature and is growing at around 2% to 4% per year. This market is quite cyclical and it is significantly impacted by the health of the major developed country economies.
The global Advertising market can be split into 2 main components:
- traditional media (television, radio, newspapers, etc.)
- digital media.
The traditional media market is relatively stagnant and has been shrinking its share of the total advertising market.
There are various estimates for the size of the market but at the end of 2022 it was thought to be between $615 B to $723 B in size (source: imarc Group and Statista). By and large the advertising market is an amalgam of country or regional markets whose size is in direct proportion to the size of the local economy.
Given the relatively unique structure of the digital advertising market where a small number of companies (Meta Platforms (META), Google, Amazon (AMZN) and TikTok) dominate the market, it is relatively easy to generate a “ball-park” estimate for the market’s size and growth rate. With the exception of TikTok, the other companies are publicly listed therefore their advertising revenues are contained within their published financial statements.
The following table shows the reported advertising revenues generated by these companies in 2022 with the TikTok estimate coming from an industry source (Business of Apps, Jan 2023):
Author’s compilation using company 10-K filings and industry estimates.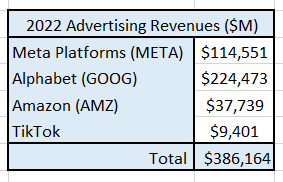
We can estimate the market share of these 4 companies by using the low industry estimate for the size of the market ($520 B). This suggests that they have a combined market share of around 75%. This appears to be in line with the estimates of many of the sector’s observers.
It should be noted that TikTok is a relative newcomer to the market with revenues really only becoming material to the other industry participants over the last 2 years.
I have constructed the following chart which shows the combined advertising revenues for these 4 companies on a rolling quarterly basis: updated at the end of each quarter since 2019:
Author’s compilation using company 10-Q filings and TikTok estimates from Business of Apps.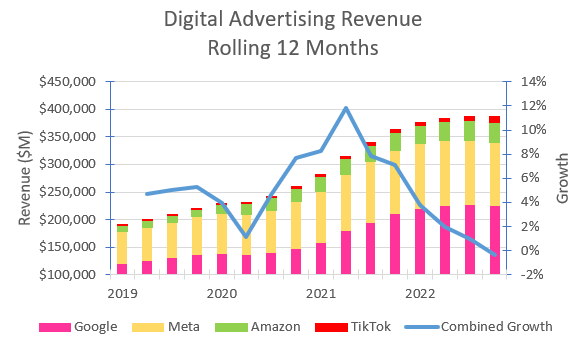
The data indicates that sector revenue growth began to decline after Q2 in 2021 and in Q4 of 2022 there was negative revenue growth. The data also suggests that Amazon and TikTok may be taking market share from Google and Meta.
Sector revenue growth has stalled as the global economy began to normalize following the COVID re-openings in late 2021. The recent Q1 2023 update showed mixed results for the major digital advertising platforms:
- Google was 0.2% lower than the prior year.
- Meta was 4.1% higher.
- Amazon was 20.7% higher.
Google’s performance can be isolated using the data from its published financial statements:
Author’s compilation using data from Alphabet’s 10-K filings.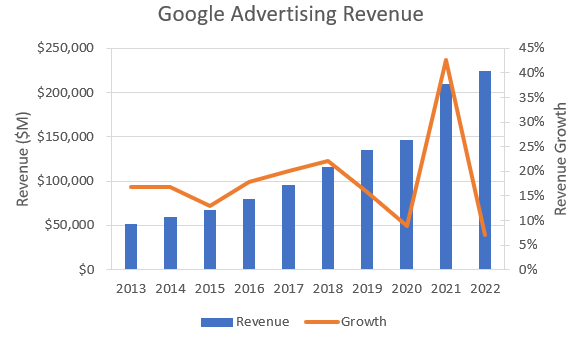
Although the annual growth rate in Google’s advertising revenues spiked higher in 2021 the growth trajectory has returned back to its declining trend. Since the 2nd quarter of 2022 Google’s advertising revenue growth on a rolling 12-month basis has been flat to declining and this situation has not changed in Q1 2023.
Fortunately for Google, its reported advertising margins have been reasonably steady over the last few years as shown in the following chart:
Author’s compilation using data from Alphabet’s 10-K filings.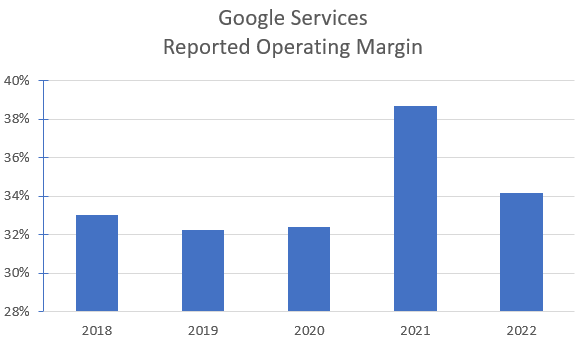
It should be noted that Google does not report its advertising operating earnings directly and the number is bundled within the Google Services result. Advertising revenues, in the most recent year, comprised 89% of the total Services’ revenues so it is reasonable to conclude that the advertising margin should be reasonably close to the reported Services’ margin.
Services’ earnings (particularly Advertising) underpin Google’s entire profitability as the remaining segments, Google Cloud and Other Bets are not currently profitable.
On Demand Cloud Computing Platforms
Google Cloud is Google’s fastest growing segment. This business offers cloud services to both individual consumers and businesses. Many companies have been lowering their information technology costs by moving to an on-demand sourcing model. Computing resources, via a cloud computing facility, are sourced from 3rd parties (such as Amazon Web Services, Google, Microsoft (MSFT), IBM (IBM) and others). The obvious key user benefit being the ability to scale its computing resources quickly but also only pay for the level of resources which are reserved.
There are at least 4 segments in the cloud computing space:
- Cloud Infrastructure Services – infrastructure as a service (IaaS), product as a service (PaaS) and hosted private clouds.
- Other Cloud Services – enterprise software as a service (SaaS) and unified communications as a service (UCaaS).
- Infrastructure Hardware and Software – public cloud, private and hybrid cloud.
- Cloud Data Centre – colocation and leasing of data centers.
Google Cloud’s product offerings are predominantly in the IaaS and PaaS markets.
In the IaaS market, the service provider supplies on-demand access to resources such as networking, storage, and servers on the service provider’s infrastructure. The client is responsible for the provision of the platforms and applications.
In the PaaS market, the service provider is responsible for the infrastructure, security, operating system, and backups. The client is provided with an environment to develop, manage, and host applications. The configuration of the software is done by the service provider.
There are many companies participating in this market, but the bulk of revenues are now captured by three companies as shown in the following table:
Author’s compilation using data from company 10-K filings.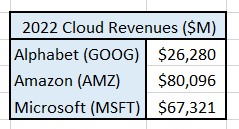
The data indicates that Google Cloud is a distant 3rd placed player in this market however its revenues are growing significantly faster than its competitors:
Author’s compilation using data from Alphabet’s 10-K filings.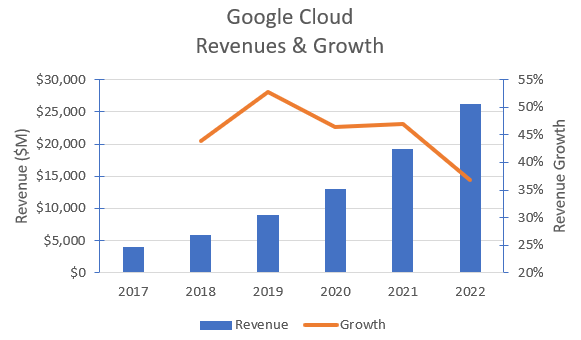
Unsurprisingly (law of large numbers), Google Cloud’s revenue growth is starting to decline but it is expected to remain between 10% to 20% for the next few years provided economic conditions do not become significantly worse.
The Google Cloud division is yet to achieve annual profitability, but losses are declining as revenues have increased. Google only began separately reporting the Google Cloud division’s financials in 2017. Its competitors, Amazon Web Services and Microsoft’s Azure, were established a year or two ahead of Google Cloud. It is noted that it took Amazon Web Services nearly 10 years to achieve profitability. I suspect that Google Cloud will achieve profitability within the next 2 years.
In the most recent Q1 2023 earnings report Google, Microsoft and Amazon all reported a continuing trend of slowing revenue growth rates. Google still maintains a significantly higher growth rate than its larger competitors but the concern remains that the sector’s growth is rapidly declining.
Interestingly, Google Cloud reported for the first time a positive profit contribution (albeit small). The concern is that this was achieved as a result of a significant change to Google’s server and network equipment depreciation policy. Google has decided to increase the expected lives of this hardware. This change in the depreciation policy resulted in a lower depreciation expense of $988 M in Q1.
Google Cloud maiden quarterly operating profit in Q1 2023 was $191 M. This would suggest that the majority of the depreciation benefit was directed to Google Cloud and it is the only reason that a positive contribution was achieved. Only time will tell as to how sustainable this change in accounting policy is and it would not be surprising if it was reversed at some time in the future.
Other Bets
Alphabet generates large amounts of excess cash from its advertising business. It has chosen to invest significant portions of its excess cash into a new idea “incubator” which it calls Other Bets. These are investments which are designed to lead the company away from its reliance on the search and advertising markets. All these investments are “start-ups”. Each has its own management team and often the investment involves an external financial partner (who may have owned the original idea).
According to Reuters, Other Bets comprises at least 7 entities:
- Project X – this is a research and development unit that often acts as the nursery for the initial concepts before the concept is given its own structure.
- Waymo – an advanced autonomous vehicle technology company.
- CapitalG – formerly known as Google Capital. It is a private-equity style fund for investing in technology start-ups.
- Verily – a life science technology unit working on machine learning and wearable technology for healthcare applications.
- Access – manages the Google Fiber business which offers super-high speed broadband access over fiber optic cables.
- Calico – is a research company focused on advanced technologies to increase the understanding of the biology that controls human lifespan.
- Google Ventures (GV) – is a venture capital company which invests in companies in the fields of life science, healthcare, artificial intelligence, robotics, transportation, cybersecurity, and agriculture.
The most commercially advanced of these entities is probably Waymo. In August 2018 I developed a valuation for Waymo based on it being a technology supplier to the vehicle industry. My valuation at the time was $US11,000 M. Assuming a current cost of capital of 10%, an updated valuation using the original inputs, generates a valuation of approximately $18,000 M.
There remains very little public information about the commercial prospects for Waymo. Over the years there have been numerous analyst assessments of Waymo’s market value. Although there are is a wide dispersion in the valuations produced by these analysts there is one common thread – all of the valuations have been declining over time.
My valuation might be lower than many other estimates but I don’t think that the difference is overly material to Alphabet’s valuation.
Alphabet has reported the following historical data for the Other Bets division:
Author’s compilation using data from Alphabet’s 10-K filings.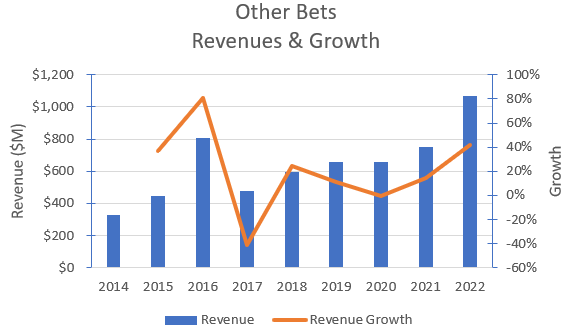
Not surprisingly, in 2022 Other Bets reported an operating loss of $6,053 M. The quantum of operating losses over time have been increasing but margins have been slowly improving as revenues have grown but there appears to be very little prospect of this division making a positive contribution to Alphabet’s profitability in the medium term.
Google has recently announced that all AI expenses which are currently incurred within Other Bets will be in the future allocated to corporate overhead. Although this will not change the overall Google corporate financial result it will improve the reported result for Other Bets.
Google’s Historical Financial Performance
Google is predominantly an advertising company (79% of current revenues) but this mix is slowly changing.
Author’s compilation using data from Alphabet’s 10-K filings.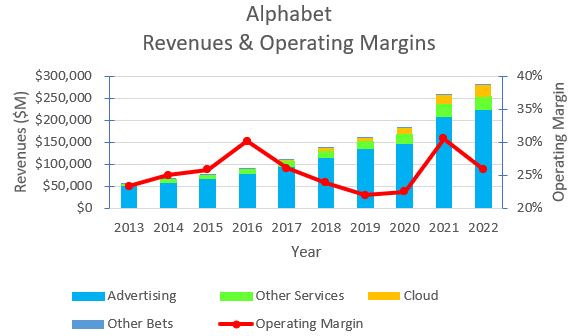
The only adjustments that I have made to the reported operating earnings are to eliminate any one-off costs such as fines, etc.
The chart shows that revenue growth and margins were distorted by COVID but now we are starting to see the impact caused by a slowing economy. The other key takeaway from the chart is that as the proportion of non-advertising revenues increases there is a noticeable decline in operating margins.
The strength of a company’s competitive position is generally reflected in its return on invested capital. I have made some adjustments to Alphabet’s published financial statements to more appropriately reflect where the company is investing its cash. For instance, I have removed the research and development costs from the reported operating income and similarly I have removed a portion of the marketing expenses. I think that these expenses have long-term benefits for the company and as a result I classify them as investments. I have added back into the modified Income Statement a notional amortization charge for these investments.
My adjusted return on invested capital history for Google is shown on the following chart:
Author’s compilation using data from Alphabet’s 10-K filings.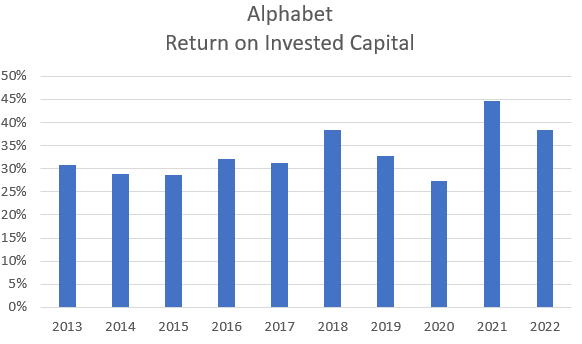
The chart shows that the company has been achieving a very consistently high return on capital for many years. This is even more remarkable given the level of investment that has taken place in Other Bets and Google Cloud which have generated very little in terms of returns.
This is an excellent result.
Google’s Capital Structure
Author’s compilation using data from Alphabet’s 10-K filings.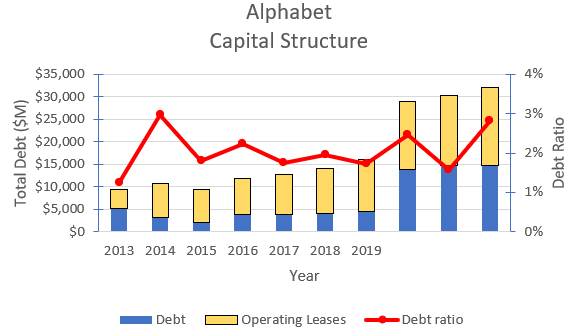
Like most technology companies, Google is a low user of debt (median sector debt ratio is 5.3%). Over time, as the company matures, this will probably change but the current capital structure generates a high cost of capital relative to the typical US company.
It should be noted that Google currently has nearly $114 B of liquid assets (cash and marketable securities). This is by far the largest level of all companies with Apple (NASDAQ: AAPL) being a distant second with nearly $49 B. This emphasizes the strength of Google’s balance sheet.
Google’s Cash Flows
A review of Google’s cash flows for the last 10 years reveals the following information:
Author’s compilation using data from Alphabet’s 10-K filings.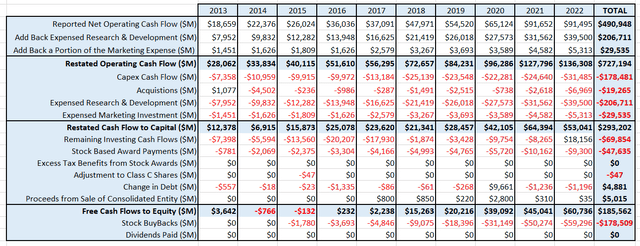
The data indicates that over the last 10 years Google has generated a 51% adjusted operating margin – which is particularly good.
Almost 31% of the sales revenues or 60% of the operating income is reinvested back into the business. I suspect that the advertising business is fast becoming mature and requires relatively small reinvestment therefore the bulk of this cash is being directed to Google Cloud and Other Bets.
The table indicates that Google has taken on a very small amount of new debt and that the share buybacks are being funded by the remaining operating cash flow after reinvestment. Google is giving almost 25% of its operating cash flow back to shareholders.
Key Risks Facing Google
There are several risks confronting the company which are significant and need to be considered by any investor in the company:
- Regulatory risk remains elevated and significant. Many regulators have expressed concerns about the market power of Google’s search application. I suspect that fines issued by regulators are going to be a feature of “business as usual” for Google. Although many critics are calling for the breakup of the company, I think that this is unlikely, but it may materially impact long-term margins.
- A competitor with superior technology is always a key risk for companies like Google. The most recent concern is Chat GPT. This application has the potential to seriously disrupt the search market which would prove devastating for Google.
- The reliance on advertising remains one of the key long-term weaknesses for the company. There is clear evidence that the advertising market is fast approaching maturity. This will impact Alphabet’s growth rate unless other sources of revenues are developed. As the growth in the company inevitably slows due to its sheer size, pressure will come on to those areas that are consuming investing cash but are not generating operating earnings (Google Cloud and Other Bets). I think that there is a pathway to profitability for Google Cloud, but management will need to start to aggressively monetize Other Bets or cut them off.
- A low-level threat is the growing level of activism within Google’s employees. There are vocal groups within the employee ranks who have an agenda which may be at odds with the company’s goals. This will require close attention from management.
- The company has used acquisitions to build capability (or to eliminate a competitor). The company’s record of success in this area has been mixed and a key risk is that it chases acquisitions more aggressively and overpays.
My Investment Thesis for Google
There are 3 key issues to the valuation:
- What is the future revenue growth and margins of the advertising business?
- When will Google Cloud achieve profitability, what is its future revenue growth and what are the mature margins?
- Will any substantial high revenue growth and moderately high margin businesses be developed by the Other Bets division?
My predictions are:
- Unless the US government regulates TikTok to change its business model then it will continue to capture most of the revenue growth in the digital advertising market. My current assumption is that no regulatory changes take place whilst the Democrats are in the White House.
- Google’s advertising business has become mature, and revenues will only grow at the same rate as US GDP. Operating matures will remain high.
- Google Cloud revenues will grow at around 20% per year for the next 5 years and it will achieve profitability in 2024. I think that the mature operating margin for this division will be around 30% (about the sector average).
- Other than Waymo I have not predicted any major new business to come out of Other Bets. I have significantly scaled back the operating costs for running Other Bets so that it no longer represents a material drain on the company’s cash flow.
In summary this represents a mature story for Google as the company gracefully becomes an older technology company which is a very profitable cash generating machine (not unlike Apple).
Key Inputs in Google’s Valuation
Readers should take note that I have removed the contribution made by Other Bets to the following financial inputs because I have valued its main contributor, Waymo, separately. The following table reflects my inputs to the valuation:
Author’s valuation model inputs.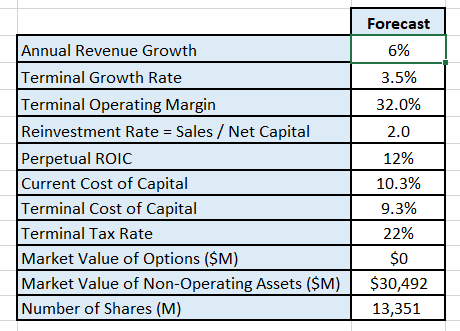
There are some adjustments to be made to the valuation:
- I have subtracted $9,106 M from the valuation for the provision that Google has made for a European Commission fine (currently under appeal).
- I have valued Other Bets at $18,000 M which represents my updated valuation for Waymo.
Discounted Cash Flow Valuation
A Free Cash Flow to the Firm approach is used with a 3-stage model (high growth, declining growth, and maturity). The model only seeks to value the cash flows of the Google operating assets. The valuation has been performed in $USD.
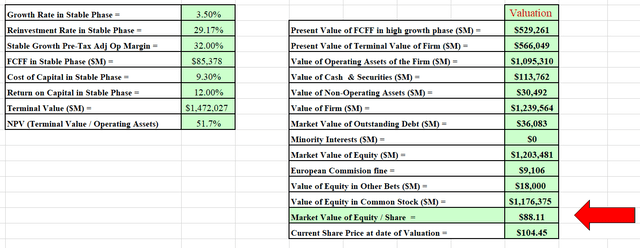
The output of the model is:
Author’s discounted cash flow model output. Author’s discounted cash flow model output.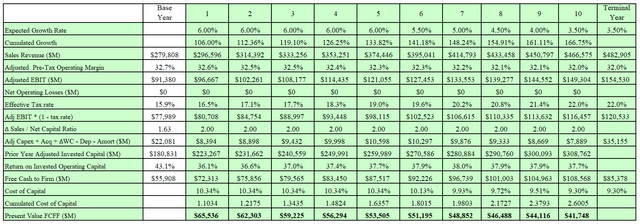
I also developed a Monte Carlo simulation for the valuation based on the range of inputs for the valuation. The output of the simulation was developed after 100,000 iterations.
The Monte Carlo simulation can be used to help us identify the boundaries of the valuation (high / low values) as well as to understand the major sources of sensitivity. This valuation is predominantly driven by the uncertainty in:
- the expected future sales growth forecast (52% of the variation).
Author’s Monte Carlo simulation output.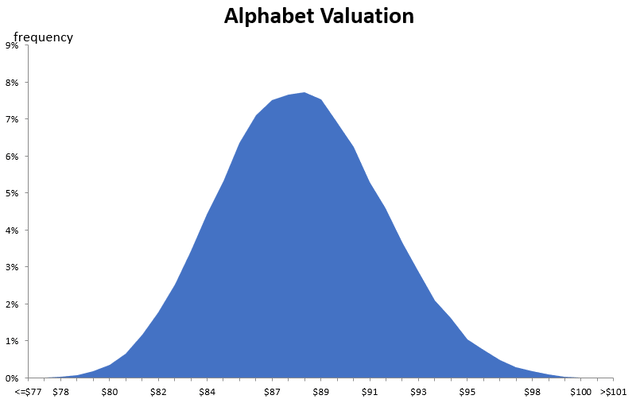
The simulation indicates that GOOG stock’s intrinsic value is between $77 and $101 per share with an expected value of $88.
Final Recommendation
Google has been a wonderful long-term investment. The valuation and the simulation confirm that the key question to be answered is whether Google is becoming a mature, low growth company or whether it can develop new large sources of revenue and profit growth.
I am concerned that management is using some accounting policy changes to improve the near term reported financial results. I think that the policy changes may in time be reversed so this becomes a timing issue (the benefits will also reverse). Great companies with bright futures do not need to play these games. This should be a warning to investors.
I think there is little argument that given the current structure of the digital advertising market Google is no longer capable of materially growing its market share. This would suggest that nearly 80% of Google’s current revenues will probably grow at GDP (or less) into the future. This proportion increases to almost 90% if the remaining Google Service revenues (Google Other) are concluded to have the same growth trajectory.
This implies that Google’s growth engine must become Google Cloud or a yet to be monetized business within Other Bets.
Although late to the game in the cloud services sector, Google has aggressively grown its cloud service offering. Google is a long way back as the 3rd largest player in this market (behind Amazon and Microsoft) but it is currently the fastest growing. Growth has come at a significant cost and the division has yet to achieve a positive annual profit contribution.
I have projected that Google Cloud’s revenues will grow at 20% per year for the next 5 years and that it will take another year for the division to break-even. For my valuation to be materially increased it requires Google Cloud’s revenues to grow faster for longer. It is not overly material if the profitability breakeven is achieved in 2023 or 2024 because I have projected operating margins for Google Cloud to be 30% by 2026.
The following table is my projected valuation for Google based on a range of 5 year revenue growth rates for Google Cloud:
Author’s Google Cloud scenario analysis.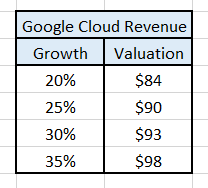
The model indicates that to justify the current Google share price, the market is pricing in a much higher expected revenue growth rate than I have used in my valuation scenario.
I think that it is entirely possible that the Google Cloud division could achieve higher revenue growth rates (essentially maintaining its historic growth rates for longer in a market where growth is slowing) – in which case Google’s current share price looks to be reasonably close to my estimate of its intrinsic value.
Do I think that Google is a good long-term investment?
I think that Google is a very good company. It has an excellent market position with stable cash flows and high returns on invested capital. I no longer consider it to be a fast-growing technology company but one that it is approaching middle age.
What should investors do now at the current share price?
Remember my valuation makes no attempt to price in any significant new business coming from the Other Bets’ investments except for a modest return from Waymo. So there is the possibility of further upside to my valuation.
I think that Google is within my margin of error to be categorized as being fairly priced.
I am a long-term investor in Google but I have been trimming my holdings over the last few months on any price strength. If the market price keeps moving significantly higher, I will take the opportunity to sell the remainder of my holdings and hope to buy the stock back when the market goes through a corrective phase and the price hopefully moves to the lower end of my valuation.
Analyst’s Disclosure: I/we have a beneficial long position in the shares of GOOG either through stock ownership, options, or other derivatives. I wrote this article myself, and it expresses my own opinions. I am not receiving compensation for it (other than from Seeking Alpha). I have no business relationship with any company whose stock is mentioned in this article.
Seeking Alpha’s Disclosure: Past performance is no guarantee of future results. No recommendation or advice is being given as to whether any investment is suitable for a particular investor. Any views or opinions expressed above may not reflect those of Seeking Alpha as a whole. Seeking Alpha is not a licensed securities dealer, broker or US investment adviser or investment bank. Our analysts are third party authors that include both professional investors and individual investors who may not be licensed or certified by any institute or regulatory body.
