Summary:
- Many investors do not consider Peter Lynch to be a dividend investor – an unfortunate misunderstanding in my view.
- He has so many valuable insights into dividend stocks. It is just these insights are overshadowed by his success with 10-baggers.
- Thus, this article applies his approach to evaluate AbbVie and Johnson & Johnson.
- You will see why the approach shows AbbVie to be the better dividend stock under current conditions and why his insights are of wide relevance.

sanfel
Thesis
Peter Lynch is celebrated by most investors for his talent to identify “10 baggers”. However, I think this is an unfortunate misunderstanding for several reasons. To start off, in his writings (e.g., “One Up on Wall Street” and “Beating the Street”), he described a framework to divide stocks into six buckets. And fast growers are just one of them (the other being stalwarts, turnarounds, et al). As investors, we will be simply missing out on opportunities if we simply focus on one category. Even though this category seems to be the most exciting one – this leads me to the next reason, a more crucial reason that will be the thesis of this article.
Lynch offered guidelines to individual investors for identifying each style throughout his writings. And of course, you can find profitable investments in each bucket. And here is my key point: the approaches for picking stalwarts are so much more tractable for ordinary investors than those for picking 10-baggers or turnarounds. These later categories simply require area-specific expertise, risk tolerance, and personnel evaluation skills that most investors do not have time to develop.
In contrast, stalwarts are a category in that individual investors can have an advantage over large money managers if they follow the Lynch system. Their dividends offer a reliable backdoor for understanding their finances even without industry-specific expertise. A stalwart by default should have the stability and scale to afford (and most of them do pay) stable dividends. As such, this article applies the Lynch approach to evaluate AbbVie (NYSE:ABBV) and Johnson & Johnson (NYSE:JNJ), both stalwarts in the healthcare sector and both are dividend champs.
And you will see why ABBV is a better dividend stock according to the Lynch system (a stock we own and had good success with). And the final scorecard is shown here for those who cannot wait. You will also see why Lynch’s insights on dividend stocks can be more practical and valuable for ordinary investors than those on fast growers and turnarounds.

Source: Author based on Seeking Alpha data
Lynch’s guidelines for dividend stocks
Among the many insights that Lynch has offered, I gleaned the following guidelines from his writing for two main reasons. First, they are simple to apply. Second, they offer a holistic view of the business ranging from valuation to dividend safety, to financial health, and also operational efficiency. These criteria are detailed in my earlier article. A brief recap is provided here for the ease of reference:
- Dividend Track Record: A long history of consistently increasing dividends is highly valued by Lynch. His guides are to look for companies with a track record of stable dividends for at least 20 years.
- Valuation: Lynch popularizes the concept of the PEG, price-to-earnings growth, ratio. It is less well-known that he introduced a modified version of the PEG ratio just for dividends stocks. The modified ratio is called the PEGY ratio and is computed as the P/E ratio divided by the sum of the earnings growth rate and dividend yield. The concept is simple yet effective. If the dividends are high enough, investors should not expect (and do not need either) a high growth rate anymore. Just like the PEG ratio, Lynch favors PEGY ratios below 1x.
- Payout Ratio: It is common knowledge that a lower payout ratio is safer. However, later on, you will see that Lynch offers a few good points for interpreting the payout ratio.
- Share Buybacks: This is an aspect where Lynch’s insights can be helpful. Share buybacks are just as valuable for total returns as cash dividends (even more so if you consider tax implications). Yet, it is overlooked by many dividend investors. Plus, share buybacks are a strong indicator of financial strength (that a company has excess cash flow beyond capital expenditures and dividend obligations) and also management’s confidence in their own business.
- Inventories: This is another area most investors overlook yet crucially important and simple to check. As we will see later, Lynch has good reasons and shows a practical approach to using inventories to monitor the health and efficiency of the target business.
1. Dividend record
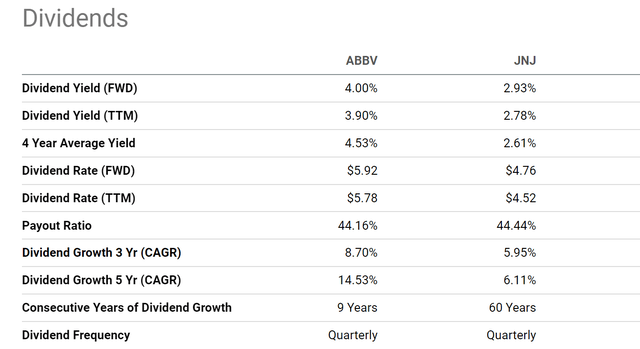
The first criterion is easy to check off for both ABBV and JNJ. As just mentioned, Lynch favors companies with at least 20 years of stable dividends. In this aspect, both ABBV and JNJ far exceed this requirement. Both are dividend champions that have consistently increased their dividend payout for at least 25 consecutive years (30 years for AbbVie and 60 for JNJ). Note that the chart below shows ABBV only has 9 years of consecutive dividend increases because the company was spun off from Abbott Laboratories in 2013. And the chart must have used 2013 as the beginning of AbbVie’s dividend history.
Therefore, both ABBV and JNJ have scored 1 point on this front.
Source: Seeking Alpha data
2. PEG and PEGY ratios
As mentioned, for stalwarts, I view dividends as the most reliable indicator of their true economic earnings. Hence, I will be using the growth rate of their dividends as a measure of their earnings growth rates here.
As seen in the chart above, JNJ’s dividend growth rate has been slower than ABBV’s over both a 3-year and 5-year period. And my valuation uses the more recent 3-year CAGR. Specifically, JNJ’s 3-year CAGR is 5.95%, while ABBV’s is 8.7%. For the P/E ratios, I will be using the FY1 ratios based on consensus estimates as shown in the 2nd chart below. ABBV has an FY1 P/E ratio of 13.49x, compared to JNJ’s 15.27x. As a result, ABBV’s PEG ratio turns out to be 1.55x and JNJ’s 2.57x, both higher than the preferred threshold of 1x that Lynch advocates.
This is Lynch’s PEGY can provide further insights. Both ABBV and JNJ pay a sizable cash dividend of 4.00% and 2.93%, respectively, as shown. And ignoring such substantial dividends can bias the growth valuation and the PEGY ratio corrects this bias. As seen, for ABBV, the PEGY ratio is 1.06x, quite close to the 1x threshold. While for JNJ, it is 1.72x, still substantially higher than the 1x threshold.
As such, I would assign another point to ABBV here, but not to JNJ.

Source: Author based on Seeking Alpha data

Source: Seeking Alpha data
3. Dividend payout ratios
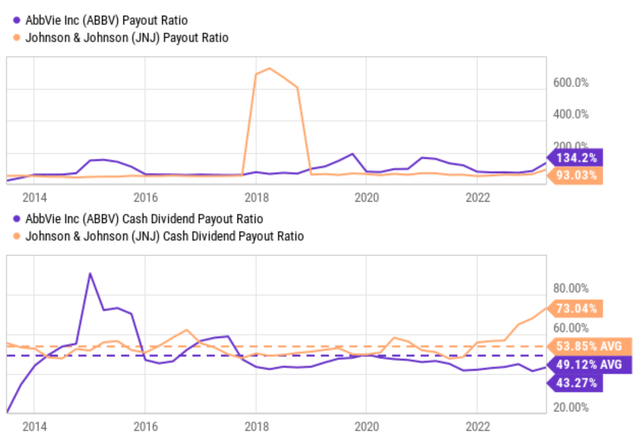
Earnings-based payout ratios can be volatile and meaningless for many stocks because the accounting EPS does not represent true economic earnings. And it is the case here for both ABBV and JNJ (as shown in the top panel). Cash payout ratios can overcome this limitation to some degree, as shown in the bottom panel. Historically, JNJ has paid out a higher percentage (averaging 53.85%) of its cash as dividends compared to ABBV (averaging 49.12%). But the cash payout ratio has limitations too. For example, it does not consider the debt, cash position, and interest obligations. A more holistic assessment involves the calculation of the dividend cushion ratio, as detailed in our earlier article. Our analysis shows that ABBV also has a better dividend cushion ratio than JNJ.
With these results, I think ABBV is the winner on this front too, earning it another point over JNJ.
Source: Seeking Alpha data
4. Share buying backs
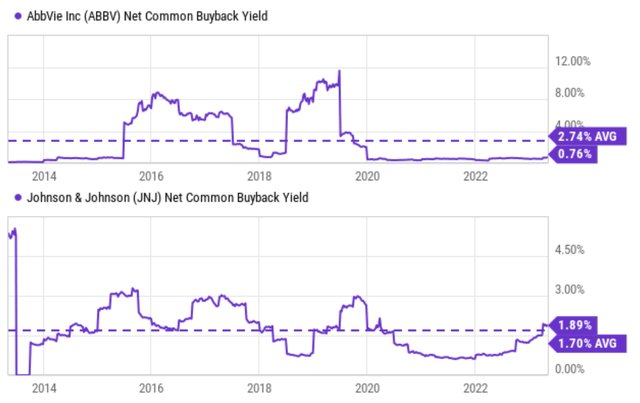
Both ABBV and JNJ are regular buyers of their own shares, as depicted in the next chart. To wit, JNJ has been maintaining an average buyback yield of 1.70% over the past 10 years. Its current buyback yield stands around 1.89%. In comparison, ABBV has maintained a higher average buyback yield of 2.74% historically. But its current buyback yield of 0.76% is lower than JNJ’s.
I would consider this criterion a tie and assign 1 point to each of them because of A) their consistent buying pattern, and B) the mixed comparison between the long-term average and current buyback yields.
Source: Seeking Alpha data
5. Inventory management
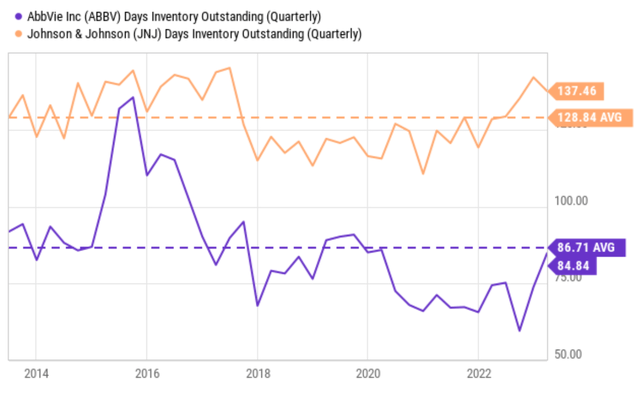
Finally, the chart shows how ABBV and JNJ are performing according to Lynch’s 5th criterion: inventory management. ABBV is a clear winner on this front. Its days of inventory outstanding currently hovers around 84 days, slightly below its historical average of 86.7 days. In contrast, JNJ needs to maintain a much higher inventory both historically (on average 129 days) and currently (137 days). It is also worth noting that ABBV has effectively improved its inventory efficiency in the past few years since 2016 from over 120 days to the current level of ~80 days.
Considering the consistent trend exhibited by both companies and the fact that their current levels are quite comparable, I would also consider this criterion a tie. It is evident that both ABBV and JNJ have demonstrated a commitment to improving their inventory management and achieving operational efficiency.
Part of the reason for JNJ’s higher inventory (i.e., besides efficiency) may be due to the nature of its business segments. For example, JNJ operates a Consumer Health unit too in addition to its drug unit. And these units may feature different product cycles. The intended spinoff of the consumer health unit may change/improve inventory efficiency. But to me, this represents an uncertainty (more on this next).
And since I am evaluating these stocks under current conditions, I view ABBV as a clear winner on this front and assign another point to it.
Source: Seeking Alpha data
Risks and final verdict
Risks. For JNJ, as just mentioned, it has a major restructuring plan in motion. It intends to spin off the Consumer Health unit, which is expected to allow management to better focus on the remaining segments. A simpler and more streamlined business could also help management to improve operational efficiencies as discussed. However, such a major restructuring effort carries its own risks and uncertainties. Specific for dividend investors, especially those who need the dividend as current income, the dividend payouts and policy could change after the spinoff. For ABBV, the brunt of the Humira impact is the main risk factor here. The popular rheumatoid arthritis treatment has been the backbone of AbbVie’s portfolio for the better part of the past decade. Earnings and sales are expected to fall markedly this year due to the patent expiration of Humira in domestic markets as cheaper generics begin entering the market.
However, I expect a smooth and stable transition for ABBV. I think it is ready for the patent cliff as its replacement drugs keep their momentum. For example, in its most recent earnings report, it reported a robust increase of 14% in its immunology portfolio (its cornerstone portfolio, accounting for 50% of the top line). In particular, the surging demand for Skyrizi (+76%) and Rinvoq (+53%) promise to be the replacement blockbusters after the Humira patent expiration. And to me, the lower valuation metrics that the market is assigning to ABBV have fully compensated for these risks already.
To conclude, both ABBV and JNJ are excellent dividend stocks. But a comprehensive assessment following the Lynch system shows that ABBV is the more attractive stock under current conditions. This brings me back to the following scorecard: ABBV scored a total of 5 points across five criteria including safety, valuation, capital allocation flexibility, and inventory management.

Source: Author based on Seeking Alpha data
Analyst’s Disclosure: I/we have a beneficial long position in the shares of ABBV either through stock ownership, options, or other derivatives. I wrote this article myself, and it expresses my own opinions. I am not receiving compensation for it (other than from Seeking Alpha). I have no business relationship with any company whose stock is mentioned in this article.
Seeking Alpha’s Disclosure: Past performance is no guarantee of future results. No recommendation or advice is being given as to whether any investment is suitable for a particular investor. Any views or opinions expressed above may not reflect those of Seeking Alpha as a whole. Seeking Alpha is not a licensed securities dealer, broker or US investment adviser or investment bank. Our analysts are third party authors that include both professional investors and individual investors who may not be licensed or certified by any institute or regulatory body.
As you can tell, our core style is to provide actionable and unambiguous ideas from our independent research. If your share this investment style, check out Envision Early Retirement. It provides at least 1x in-depth articles per week on such ideas.
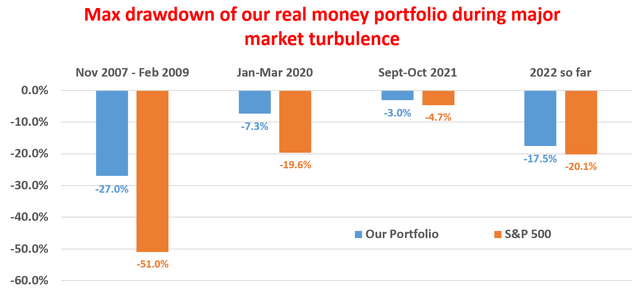
We have helped our members not only to beat S&P 500 but also avoid heavy drawdowns despite the extreme volatilities in BOTH the equity AND bond market.
Join for a 100% Risk-Free trial and see if our proven method can help you too.
