Summary:
- This is a technical analysis article. In our previous article, we identified Tesla as a stock with Sell Signals. Those signals have not changed, despite the Musk interview on CNBC.
- Following a classical technical pattern, price moved up to fill the gap down after earnings, as the bullish bargain hunters bought on weakness. The Musk interview created another bounce.
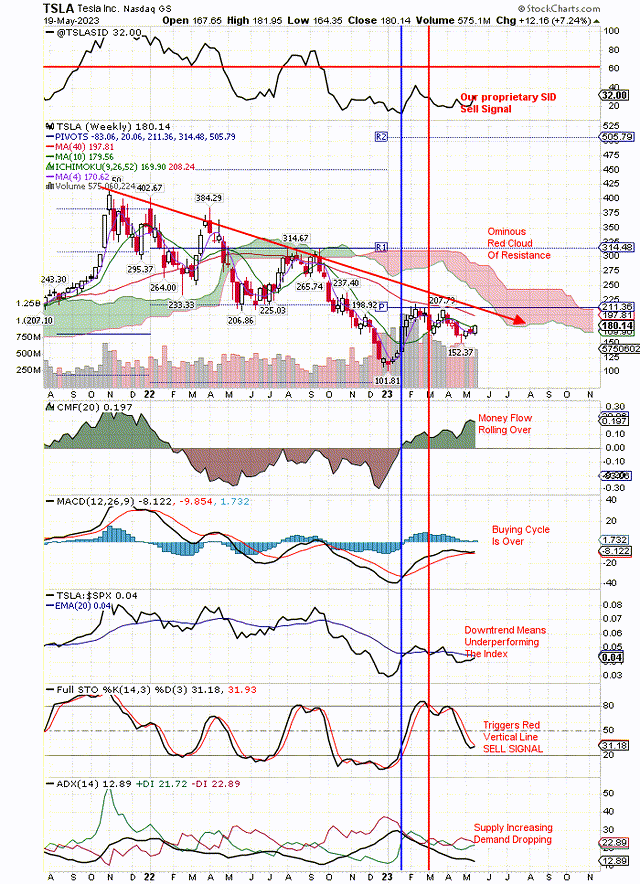
- We think Tesla will drop again, not only because of our proprietary SID sell signal, but the other sell signals shown on the chart below.
- Moving averages for the 200, 50 and 20 day trends show bearish downtrends. Price is putting lower highs and lower lows in place, typical for downtrend stocks.
- The fundamentals are driving these price trends. Tesla is a great company, but it is overvalued, growth is threatened, and it no longer owns the market.
AndreyPopov/iStock via Getty Images
As the electric vehicle (“EV”) battle heats up and the pawns take on the king, in this case the auto industry taking on Tesla, Inc. (NASDAQ:TSLA), we can expect TSLA’s growth and profitability to suffer. That means that TSLA’s P/E and PEG likely will come down. The way that is accomplished is by a falling price for TSLA stock. That is exactly what is happening, as you can see on the chart below.
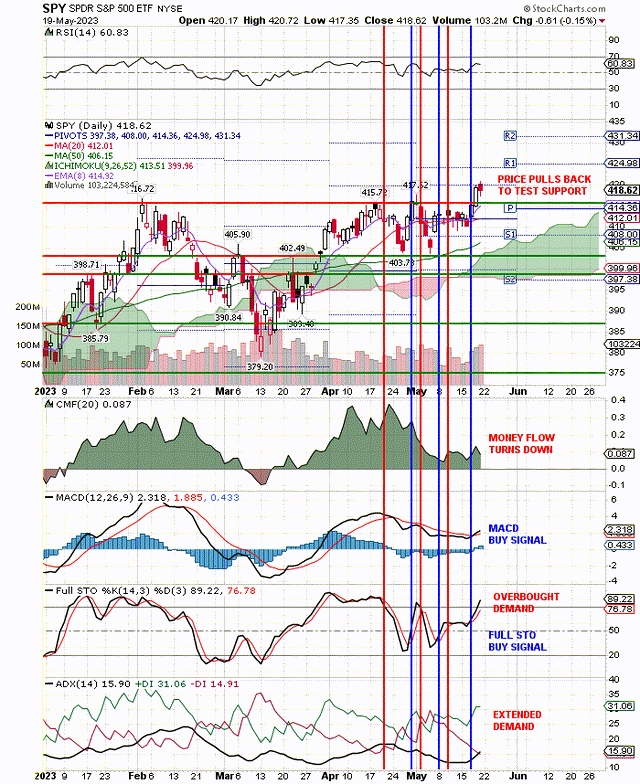
Tesla is in a bear market looking for a bottom, not unlike the overall market, as represented by SPDR® S&P 500 ETF Trust (SPY). The overvaluation of the mega-cap stocks that move the SPY higher continues. When the recession comes, these overvalued stocks should drop to the levels of last October, if not lower, especially TSLA with a Beta of 2. You can see the SPY breakout on the chart below, and we think this is the last hurrah for the October bounce. When the SPY turns down, it should take TSLA with it.
Everyone knows the growth cycle. The new company is growing like crazy and then the competition comes alive. The growth begins to slow, especially as the company becomes larger and larger. Finally it morphs from growth to value, a blue chip paying dividends. TSLA has moved from being aggressive growth to slower growth, but with a long runway still ahead of it. The only problem with that picture is that it is overvalued and price has to come down. Then there was the dumping of stock on the market so Elon could buy Twitter. Increased supply brings price down. Plus, institutional ownership of TSLA stock is a very low 44%.
All of this is well known by the market and can be seen in price trends. The short, intermediate, and long-term price trends are down and price is continuing a downward movement. You can see this on the chart below. The 200-day moving average, long-term trend is down. So is the intermediate 50-day trend and the short term 20-day trend moving average. TSLA is underperforming the market, and portfolio managers are dumping it because it is hurting their performance. You cannot beat the Index by holding underperforming stocks. However, bottom fishers do buy underperforming stocks like TSLA if the price is low enough.
Now, if TSLA could beat all the competition and maintain its aggressive growth in the future, that would change the downtrends. If its earnings revisions improved dramatically, that would change the downtrends. However, the market right now does not see that happening for TSLA and that is why price continues to drop. Great company, great profits, ahead of the competition, but how long will that last in such a competitive industry? TSLA is going to lose market share and the market is trying to compute how fast that is going to happen and how to value TSLA stock accordingly. Right now it thinks the price is too high. The charts show price dropping for that reason.
In our previous article, we showed the downtrends and the sell signal after earnings. When price gapped down after earnings, the bargain hunters came in and took the price back up, filling the gap down. This is classical technical movement of price. TSLA is in a downtrend, but it is not going to dive to the bottom. It is moving down in a very orderly manner to the next support level and then bouncing as the bargain hunters come in again. Then it goes down lower than before, forming the classical lower-high and lower-low in price until it finally hits bottom.
You can see the last bottom was $102 and you can see price moving in a slow, and orderly manner, back down to retest that price. As noted above, any improvement in growth, earnings revisions and profit margins would change the outcome. We don’t think that happens. We see the growing competition taking market share from TSLA. The competition has shown that they are willing to lose money to catch up with TSLA.
Technically, we look for bounces in prices to change our Sell Signals. In the case of TSLA, we can see that the current bounce has not changed our Sell Signal, which uses both technicals and fundamentals. When this happens on a bounce, that becomes a confirmation of the Sell Signal and we expect the stock to move lower. That is what you can see on this weekly chart below:
TSLA bounce fails to change sell signals. (stockcharts.com)
Meanwhile the market has recently helped the TSLA stock price, along with the Musk interview. As you can see on the SPY chart below, there is a positive breakout above $420. This was caused by positive, no-default talk, but on Friday negotiations broke down and the SPY dropped below $420 looking for support at $415. On Sunday, Biden was on TV about negotiations and in touch with McCarthy.
Here is the daily SPY chart, and it still is holding on to our vertical, blue line buy signal. That could change with further bad news on the debt ceiling negotiations.
SPY drops on debt ceiling news (stockcharts.com)
Analyst’s Disclosure: I/we have a beneficial short position in the shares of SPY either through stock ownership, options, or other derivatives. I wrote this article myself, and it expresses my own opinions. I am not receiving compensation for it (other than from Seeking Alpha). I have no business relationship with any company whose stock is mentioned in this article.
Disclaimer: We are not investment advisers and we never recommend stocks or securities. Nothing on this website, in our reports and emails or in our meetings is a recommendation to buy or sell any security. Options are especially risky and most options expire worthless. You need to do your own due diligence and consult with a professional financial advisor before acting on any information provided on this website or at our meetings. Our meetings and website are for educational purposes only. Any content sent to you is sent out as any newspaper or newsletter, is for educational purposes and never should be taken as a recommendation to buy or sell any security. The use of terms buy, sell or hold are not recommendations to buy sell or hold any security. They are used here strictly for educational purposes. Analysts price targets are educated guesses and can be wrong. Computer systems like ours, using analyst targets therefore can be wrong. Chart buy and sell signals can be wrong and are used by our system which can then be wrong. Therefore you must always do your own due diligence before buying or selling any stock discussed here. Past results may never be repeated again and are no indication of how well our SID score Buy signal will do in the future. We assume no liability for erroneous data or opinions you hear at our meetings and see on this website or its emails and reports. You use this website and our meetings at your own risk.
Seeking Alpha’s Disclosure: Past performance is no guarantee of future results. No recommendation or advice is being given as to whether any investment is suitable for a particular investor. Any views or opinions expressed above may not reflect those of Seeking Alpha as a whole. Seeking Alpha is not a licensed securities dealer, broker or US investment adviser or investment bank. Our analysts are third party authors that include both professional investors and individual investors who may not be licensed or certified by any institute or regulatory body.

Use our free, 30 day training program to become a succesful trader or investor. Join us on Zoom to discuss your questions.
