Summary:
- Pfizer has fallen through the $40 level and looks very enticing as its dividend yield sits at 4.5%.
- Pfizer has been a dividend gem, paying a dividend since 1980, and its current dividend has 12 years of annual growth, and a sub-50% payout ratio of projected 2023 EPS.
- Prior to the revenue boom from COVID vaccines, PFE had generated over $13 billion in FCF annually from 2013-2020, allowing it to invest in its future while returning capital to shareholders.
JHVEPhoto
The last time Pfizer (NYSE:PFE) was trading in the low $40 range, I considered adding it to my Dividend Harvesting Portfolio series on Seeking Alpha (can be read here), and possibly my main dividend account. I decided to wait because the downtrend looked strong, and I wanted to see if PFE crossed the $40 mark. Instead, shares appreciated from $41.75 to $54.93 from October to December. Shares never reached the entry point I was looking for, but it looks like another opportunity has appeared. PFE has fallen -33.06% (-$18.16 per share) from its 2022 highs and is now trading for $36.77 and yielding 4.5%. I just noticed that shares had fallen under $40, so I decided to take a closer look, and it’s time to start a position. I can’t predict the future, but when the biggest companies go on sale, I pay attention. The question is, will PFE rebound, or is the stock headed back to the pandemic lows in the high $20s? I think the valuation is very attractive, while the dividend yield and growth are an added bonus.
Tearing through the financials, and considering what occurs if the windfall of profits from vaccines declines
No matter what side of the fence you’re on about the pandemic or the vaccines, there is no question that PFE’s top and bottom lines benefited. In 2020, PFE generated $41.65 billion in revenue and $9.16 billion in net income. In 2022, this drastically increased to $66.23 billion in revenue, and $31.37 billion in net income. I don’t have a crystal ball, so I have no idea what the demand for future boosters will be, and I have to consider at least that there is a scenario where the revenue and net income from COVID-19 boosters and vaccines decline. I will not engage in a political or moral debate about the pandemic or vaccines in the comment section. As an investor looking to allocate capital toward PFE, I must at least consider that this could be a possibility, regardless of the probability. For this reason, I will be looking at the income and cash flow statements from 2 perspectives.
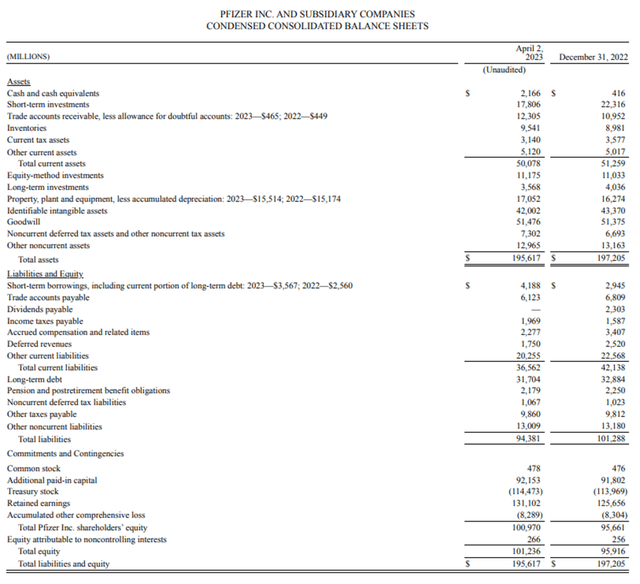
I am going to start with PFE’s balance sheet first, which is a fortress. PFE has $2.17 billion in cash and cash equivalents, with another $17.8 billion in short-term investments. PFE has $19.97 billion in short-term liquidity with another $3.57 billion in long-term investments. PFE has something you don’t often see on balance sheets and that’s equity method investments. Equity method investments are financial assets and are generally eligible for the fair value option. To read more about equity method investments, PWS put an accounting guide together. PFE only has $36.56 billion of debt on its balance sheet, with $4.19 billion due in the next year, which includes a portion of long-term debt. PFE has $195.62 billion in assets with $94.38 billion in liabilities, which puts the total equity on the books at $101.24 billion. Even if you strip away 100% of their goodwill, PFE would still have $49.76 billion in total equity on the books.
In the TTM, PFE has generated $92.95 billion in revenue, $63.96 billion in gross profit, $29.05 billion in net income, $40.51 billion in EBITDA, and $20.21 billion in free cash flow (FCF). PFE’s margins on a TTM basis are strong, as their gross profit margin is 68.81%. From a profitability standpoint, PFE delivered a 31.25% profit margin, a 43.59% EBITDA margin, and a 21.74% FCF yield.
I said I was going to look at PFE from 2 lenses, and I want to see what it looks like from a premise of less revenue being generated from vaccines and boosters pertaining to COVID-19. Looking at the income statement, revenue in Q1 declined by -28.76% YoY, while profitability declined considerably. There was almost no FCF in Q1, and when I looked at the cash flow statement, there was a $5.51 billion charge under change in other net operating assets, which impacted FCF.
Steven Fiorillo, Seeking Alpha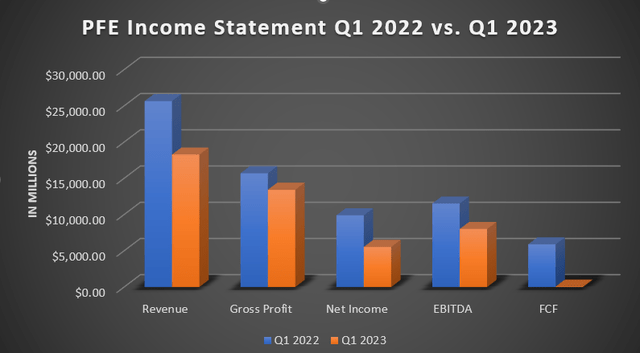
In PFE’s prepared remarks for Q1, they indicated that revenue saw a large decline primarily due to expected revenue declines in Comirnaty revenue declines in the COVID franchise, which was anticipated and previously disclosed. PFE looks to generate between $67-$71 billion in revenue and produce between $3.25 and $3.45 in EPS from its 2023 operations. At the mid-point of $3.35 in EPS, puts PFE at a 10.88 P/E ratio which still looks cheap, despite the lost financial power from the pandemic.
Now I need to factor this into my valuation methodology. Since I know PFE isn’t going to replicate or come close to the 2022 numbers, I am going to speculate based on previous numbers. From 2013 thru 2020, prior to benefiting from COIVID vaccines and boosters, PFE generated on average $13.93 billion in FCF.
Steven Fiorillo, Seeking Alpha
Based on how I establish a baseline of what I feel fair market value for a company is, PFE looks undervalued. I am using a revised FCF number of $13.93 billion to be more realistic of what PFE could generate in 2023, compared to the $20 billion of FCF generated in 2022. To establish my baseline, I establish a peer group and take the total equity on the books and combine it with a multiple of FCF to determine what I think the company is worth. Then I look at the current market cap and determine if it’s overvalued or not. I placed PFE into a peer group that consists of U.S. Pharma and took the average price to FCF that each company trades at, multiply each company’s current TTM FCF by that multiple, and add it to the total equity to determine a fair market value. If the market cap is under this number, I consider it to be undervalued. For anyone who is interested, this is why I use FCF rather than EBITDA or net income as my measure of profitability. FCF represents a company’s cash after accounting for cash outflows to support operations. I like to use this metric rather than net income because FCF is a measure of profitability that excludes the non-cash expenses and includes spending on equipment and assets. It’s also a harder number to distort or manipulate due to how companies account for taxes, and other interest expenses. This is also the pool of capital companies utilize to pay back debt, reinvest in the business, pay dividends, buy back shares, and make acquisitions.
I will compare PFE to the following companies as its peer group:
• Novartis (NVS)
• AstraZeneca (AZN)
• Bristol Myers Squibb (BMY)
• Merck & Co (MRK)
After using a reduced FCF number, PFE looks very attractive based on my valuation methodology. These companies trade at an average price to FCF of 19.26x. The group range is 12.48x, which is the price to FCF of BMY to 26.89x for AZN. PFE currently trades at 14.9x its FCF and has the 2nd lowest valuation. Starting out, PFE has 48.77% of its market cap in equity on its balance sheet. When I add the multiple of 19.26x on its FCF and add the equity, I get a fair market value of $369.58 billion. Based on my methodology, AZN and MRK trade at a premium, while BMY, NVS, and PFE trade at a discount. Even if I was to back out the equity, and value PFE at 19.26x its FCF, they would still trade at a discount of -22.62% to what I would consider their fair market value.
PFE makes sense to me here as I am using a more realistic FCF number based on the declining Comirnaty revenue PFE is facing. I have put many companies through this valuation model, and just a current price to FCF metric, 14.9x, is low. PFE could keep declining, but it has at least a decade’s worth of data which indicates PFE has no problem generating tens of billions in revenue and driving $10 billion-plus in FCF annually.
Pfizer is a dividend growth machine with a 4.5% yield
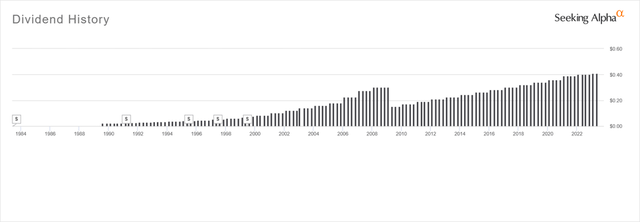
PFE has paid a dividend for more than 4 decades, with its first dividend being paid in September of 1980. During the 80s and 90s, PFE had split 5 times, and its split-adjusted dividend grew to $1.20 annually in 2008, prior to being cut in half in May of 2009. Since the dividend cut, PFE has provided investors with 12 years of consecutive dividend growth, increasing the quarterly dividend from $0.15 to $0.41. Today, PFE pays an annual dividend of $1.64, which is 48.96% of the midpoint of their projected 2023 EPS. Since implementing its dividend in 1980, PFE has returned, on a split-adjusted basis, $54.43 per share through its dividend capital allocation program.
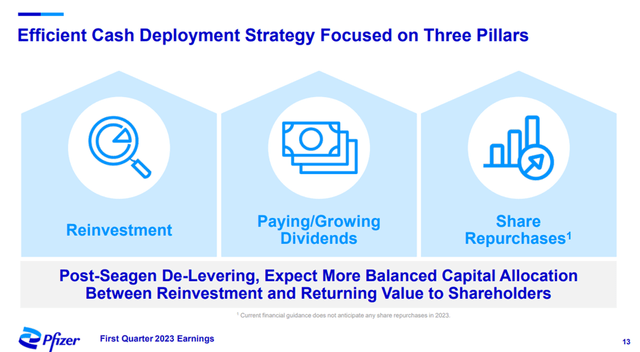
PFE has been on my radar for some time, as it’s been a dividend cash machine. Now that PFE is yielding 4.5%, it’s much more attractive to me. Today, you’re getting a company with an extensive track record of distributing cash to its shareholders, and the payout ratio is less than half of what the projected 2023 EPS is. To me, this means that PFE should have no problem continuing its annual dividend increases going forward. In the prepared remarks from Q1, PFE stated that its long-term strategy to unlock value for shareholders includes reinvesting in the business, growing and paying dividends, and repurchasing shares. PFE has a strong balance sheet with $19.97 billion in cash and short-term investments and a history of generating tens of billions in FCF. From a dividend perspective, PFE is very interesting as it has provided investors with an average annual dividend growth rate of 5.32% over the past 5 years and a yield of 4.5%.
Conclusion
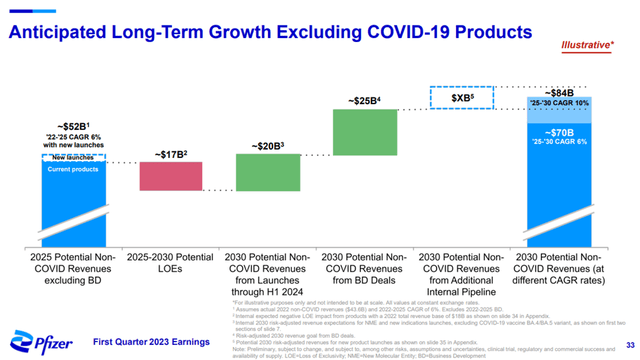
Humans will always face diseases and illnesses, and because of this, there will always be companies creating treatments and vaccines, regardless if it’s for the flu, or Alzheimer’s. PFE has a pipeline of products and is allocating $43 billion to acquire Seagen (SGEN) to increase its oncology line. PFE has a pipeline of products that are expected to launch through 2030, including launches for Type 2 Diabetes, Polymyositis, Influenza, Lyme Disease, and Shingles. PFE is expected to allocate $12.4 to $13.4 billion to R&D in 2023 and has projected that its potential revenue for non-COVID products could reach $84 billion in 2030. I am bullish on PFE’s future as it has a track record of delivering billion in profits to shareholders. Shares could continue to decline in price as revenues from COVID fall off, but I feel the mid $30s is a good place for me to start a position. This is a company with a solid balance sheet, strong margins, growth prospects, and the potential to continue its dividend increases. At a 4.5% yield, I am starting my position, and if shares continue to face downward pressure, I will dollar cost average into the position as long as my investment thesis hasn’t changed.
Analyst’s Disclosure: I/we have a beneficial long position in the shares of BMY either through stock ownership, options, or other derivatives. I wrote this article myself, and it expresses my own opinions. I am not receiving compensation for it (other than from Seeking Alpha). I have no business relationship with any company whose stock is mentioned in this article.
Disclaimer: I am not an investment advisor or professional. This article is my own personal opinion and is not meant to be a recommendation of the purchase or sale of stock. The investments and strategies discussed within this article are solely my personal opinions and commentary on the subject. This article has been written for research and educational purposes only. Anything written in this article does not take into account the reader’s particular investment objectives, financial situation, needs, or personal circumstances and is not intended to be specific to you. Investors should conduct their own research before investing to see if the companies discussed in this article fit into their portfolio parameters. Just because something may be an enticing investment for myself or someone else, it may not be the correct investment for you.
Seeking Alpha’s Disclosure: Past performance is no guarantee of future results. No recommendation or advice is being given as to whether any investment is suitable for a particular investor. Any views or opinions expressed above may not reflect those of Seeking Alpha as a whole. Seeking Alpha is not a licensed securities dealer, broker or US investment adviser or investment bank. Our analysts are third party authors that include both professional investors and individual investors who may not be licensed or certified by any institute or regulatory body.


