Summary:
- AT&T’s earnings from their continuing operations have been flat for 10 years.
- Although they pay a healthy dividend, the company isn’t growing.
- Growth in the Wireless and Fiber businesses is being offset by a terminal decline of their legacy wireline (copper) and video businesses.
- The purchase of DirecTV for $67B in 2015 and the subsequent separation of that business into a partnership was and is a slow-moving train-wreck.
teppakorn tongboonto/iStock via Getty Images
Although the recent sell-off in AT&T (NYSE:T) may have been unjustified, a long-term analysis of their continuing operations reveals a company that has done little else for the common equity owner other than pay a reasonable dividend. While they have managed to grow their wireless and fiber businesses, they are saddled with legacy wireline and video businesses that continue to disappoint. The stock’s earnings have lagged the S&P 500’s average earnings growth, and the consensus earnings expectations show little to cheer. We have a lot of data to unpack, so let’s get started.
Earnings From Continuing Operations
There is nothing better than finding that diamond in the rough, that undervalued stock whose equity value has been unduly punished by the market allowing us to swoop in and acquire it, but AT&T is not that stock. The stock is stuck in a trading range justified by its lack of earnings growth. Let’s start by looking at 10 years of earnings data from the perspective of the common shareholder. In the most recent annual earnings report, AT&T showed what the business has been earning over the past 3-years, sans WarnerMedia. Since AT&T acquired WarnerMedia in mid-2018, we can also grab the yearly returns prior to that date. Here’s the earnings data for 8 (non-consecutive earnings) years of continuing operations:
AT&T Earnings Per Share 2013-2022 (AT&T’s Annual Reports)
All figures are in millions of dollars except the earnings per share. The income figures include their video business which was separated into a partnership in 2021 but don’t include the impact of the WarnerMedia acquisition in 2018 and subsequent divestiture in 2022. From the numbers above, it appears the dividend is nearly the full return of the company (see yellow highlighted figures). They distributed essentially everything they earned over this 8-year period. If you bought AT&T on the close of Dec. 31st, 2012, you would have paid $25.46 per share and earned an average of $1.8675/share per year over those 8 years or 7.3% in dividends plus another 20 basis points in “retained” earnings. Let’s call it 7.5% per year on average. For comparison, the S&P 500 earned 8.4% per year on average for years 2013 through 2022 (excluding 2018 and 2019). If you are going to go through the trouble to find individual stocks to own, it makes sense not to invest in the ones that are underperforming the broader market and AT&T is an underperforming stock.
Making Sense of the Numbers
Sometimes a company’s earnings won’t reflect a company’s true cash flow. For example, if a company is depreciating their assets faster than their true decline, earnings can unfairly mask the progress the company is making. Conversely, a company can be hiding losses on the balance sheet. In AT&T’s case, their net income is a fair representation of the common equity’s return. It’s difficult to see in the grid above because the earnings are so choppy, but let’s go to work and try to make sense of the data. Let’s start by stripping away most of the non-cash items.
AT&T Earnings – Excluding Certain Non-Cash Items (AT&T’s annual reports)
Again, figures are in millions of dollars. The chart starts with income or (loss) from continuing operations (as seen in the previous chart). To this we add (subtract) certain non-cash items. The above chart hasn’t removed depreciation and amortization (we’ve kept those D&A non-cash charges for now), but we’ve essentially stripped away all the other major non-cash items.
It subtracts the following non-cash gains: $3,271MM in net gains on investments and $17,785MM in net reductions of future retirement expenses.
And it adds back the following non-cash losses: ($48,828MM) in asset impairments, abandonments and restructuring charges (yellow box at right) and ($11,846MM) in deferred taxes.
Summing all that up, we’ve added back a net of $39.6B worth of non-cash charges. You’ll note that in the “SUM” column (far right column) that some of the non-cash gains cancel some of the non-cash losses and we are left with roughly $40B in non-cash losses. If you look to the left of the chart, you will see two huge charges from asset impairments totaling $43,185MM (yellow highlights):
- $15,687MM – this is primarily a 2020 impairment charge in the video business (DirecTV and U-verse)
- $27,498MM – this is primarily a massive 2022 impairment of the wireline goodwill assets.
When we strip away these non-cash charges, we get a clear picture of AT&T’s earnings over these 8 years, and it’s flat as a board (see blue boxes above) at roughly $16.3B per year. There are some outliers, for example in 2021 when they earned $20.6B as impairment charges dipped dramatically, but even if you take an average of all 8 years, it sums to $16.3B per year. Again, we see flat earnings over the extended 10-year period.
Digging Deeper into the Numbers
Digging a bit deeper, the $67B purchase of DirecTV in mid-2015 isn’t measurable in these figures. We don’t see a large increase in earnings following the acquisition. Why? Because the depreciation and amortization of DirecTV’s assets consumed the earnings from that segment from mid-2015 to mid-2021 – roughly $3.6B per year for 6 years. In short, even with the DirecTV purchase (more on this below), the company hasn’t grown. Ten years of flat earnings. A rule of thumb says that if a company distributes all its earnings, the company won’t grow its earnings, and that’s exactly what we see. AT&T’s common stock is essentially a bond that paid a relatively high coupon rate of 7.5% over the previous 10 years.
Before we continue, let’s define a few accounting terms starting with Depreciation and Amortization (D&A). Amortization and depreciation are two methods of calculating the value for business assets over time. Amortization is the practice of spreading an intangible asset’s cost over that asset’s useful life. Depreciation is expensing a fixed asset as it is consumed. This reflects its anticipated deterioration over time. Although these are non-cash expenses, they are expenses. The company has paid for those assets in the form of equity issuance, debt or cash. The D&A expenses are the portion of those assets that are used up during the reported period. For every dollar of D&A that is expensed, in theory, the company must spend a dollar of investment in new equipment, buildings, spectrum licenses, and other assets to replace those declining assets and/or to generate replacement cash flow.
The next definition is Impairment. Goodwill and other indefinite-lived intangible assets are not amortized but tested at least annually to see if the value of those intangibles will be fully recovered. Often when a company buys another company, the value of that purchase exceeds the cost for the hard assets. That extra value paid goes on the balance sheet as Goodwill and other intangible assets. For example, AT&T purchased DirecTV for $67B in 2015 and $70.6B worth of intangible assets landed on their balance sheet including $34.4B in Goodwill assets. AT&T purchased DirecTV in 2015 and then from 2015 to 2021, they expensed the vast majority of that cost in the form of D&A and impairment charges.
Directv – Assets & Liabilities Acquired in 2015 (AT&T’s annual report)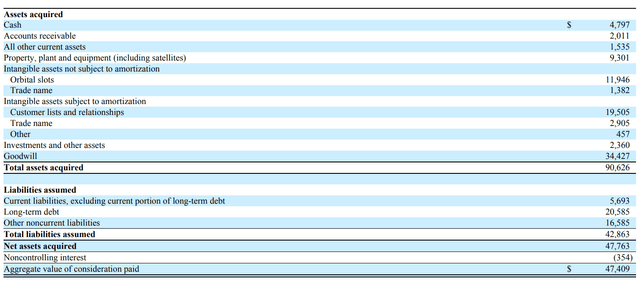
$290B Spent to Tread Water
Let’s keep going in our analysis by building onto the previous chart:
AT&T – Full Chart of Earnings Excluding Certain Non-Cash Items (AT&T Annual reports)
This is the same chart as above, but we’ve subtracted the cost of the dividend in the next row. Removing the dividend gets us to “retained” earnings. To that, we’ve added back depreciation and amortization (bottom full row on the chart). Note that D&A peaks in 2016 and 2017 at $25.8B and $24.4B respectively and then declines in 2021 and 2022 to $22.5B and $17.9B, respectively. (That additional D&A comes from the DirecTV acquisition as it was acquired and added to the balance sheet in 2015 and then separated as an independent partnership in 2021).
We then have the following formula: Retained Earnings + D&A + New Debt + New equity + gain on investments (net of impairments) roughly EQUALS the amount AT&T spent to keep earnings flat in their continuing operations: $280 billion (see magenta highlight in the chart above). That’s a big number. Here’s how that breaks out – these numbers are pulled from the Statements of Cash Flow from the corresponding years of AT&T’s annual reports:
AT&T’s Capital Expenditures and Acquisitions (2013-2022) (AT&T Annual Reports)
AT&T is a capital-intensive business. There’s no doubt about that. Add to this the disastrous DirecTV acquisition, whose $67 billion value nearly evaporated in 8 years, and the terminal decline in their copper-based wireline business, and you’ve got an entity that needed to spend $290 billion (net of dispositions), primarily on fiber and wireless expansions, to tread water for 10 years.
Making Sense of Dilution
If we use this method to assess the value of common equity in Q1 of 2023 and add the share count, we get the following grid:
AT&T Earnings Per Share Excluding Certain Non-Cash Items (Author with data from AT&T Annual Reports)
Although AT&T’s earnings overall were flat over the past 10 years, due to the ongoing dilution, the earnings per share fell from $3.01 per share per year in 2013 to $2.25 per share in 2022 as more shares were issued to pay for DirecTV, WarnerMedia, and other acquisitions. Focusing on the most recent quarter, Q1 2023’s earnings per share showed no improvement vs. Q1 2022, again, pointing to flat earnings.
Digging a bit deeper, we notice that a large portion of the dilution was due to the addition of the WarnerMedia acquisition in 2018 and the subsequent divestiture. For every share of AT&T, the equity owner received 0.24 shares of Warner Bros. Discovery (WBD), and we need to correct for this. We can do this by calculating the current value of those shares (as of May 19th closing price for WBD), converting them into an equivalent number of AT&T shares, and then subtracting those shares to undilute the total share count to see where the common equity holder stands as of mid-May 2023 versus earlier periods. Here’s the calculation:7200 shares x 0.24 x the share price of WBD of $12.20 = $21,082MM, the current value AT&T common shareholders received in the form of WBD shares.
$21,082MM divided by the share price of AT&T of $16.31 = 1,293MM of equivalent AT&T shares.
We can then subtract out this share quantity from 2020 through 2023 to produce the following chart:
AT&T Per Share Earnings 2013-2023 Net of WarnerMedia Dilution (AT&T Annual and Quarterly Reports)
When we do this, we can see the dilution is not nearly as bad. At $2.75 per share in 2022, the per share earnings aren’t declining as much and are even slightly higher than the per share earnings in 2015 through 2017 at roughly $2.60 to $2.64 per share. If we look at the earnings per share in Q1 2023 versus Q1 of 2022, we can also see that AT&T produced the same earnings at $0.65-0.66 per share on an undiluted basis (again, excluding certain non-cash items).
DirecTV – A Slow-Moving Train Wreck
Let’s try to add some context to what’s going on.
As painful as it is to go through the DirecTV acquisition, it is important to see how it unfolded. The deal closed on July 24, 2015. The headline was a cost of $67 billion dollars (954.4 million AT&T shares issued at $34.29/share or $32.7B of equity issued + $14.4B in cash + $20.6B in long-term debt assumed). Here’s a simplified accounting of what AT&T paid for DirecTV (for details see the chart above) plus the CAPEX spend:
Directv Acquisition & CAPEX Spend (AT&T Annual Reports)
Six years later, on July 31st, 2021, AT&T & TPG (a private equity company) formed a partnership called DirecTV, and AT&T contributed to the partnership AT&T TV, U-verse, and all the DirecTV assets (except Vrio – Latin America’s DirecTV), and TPG contributed $1.8B in cash to pay for a 30% equity stake in the partnership. Here’s the accounting of what was transferred from AT&T to the partnership:
AT&T Video Business – Assets & Liabilities Transferred to the Partnership (AT&T’s Annual Report)
The long-term debt associated with the video business wasn’t transferred. Instead, AT&T received a cash payment at closing and DirecTV acquired debt of $5.8B as an independent partnership which it used to pay AT&T cash at closing. Part of that cash that AT&T received was $1.8B for the sale to TPG of a 30% equity stake in the partnership. In addition, Vrio was retained and subsequently sold for $310MM (in the form of a note payable over 4 years) and another $300MM in working capital adjustments. To understand the rough return of cash in lieu of a larger debt transfer, consider the following chart:
AT&T’s Video Business (AT&T’s Annual Report)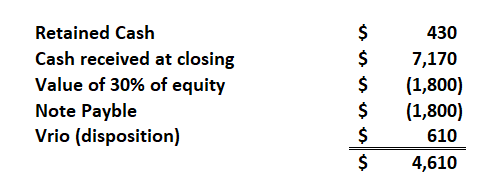
DirecTV – How This Investment Went So Wrong
That’s a lot of moving parts so let’s sum it up this way. AT&T purchased DirecTV in 2015 for $67B and then from 2015-2021 invested an additional $5.7B into the entire video business (which included DirecTV, AT&T TV, and U-verse). The total amount invested in the video business was $72.7B plus the unknown value for the much smaller video units, AT&T TV and U-verse. DirecTV had 25.5MM subscribers in 2015. Six years later, the entire video business was separated or sold and valued at $16.6B, and the subscriber base for DirecTV alone had dwindled to just 13.3MM. At this point, AT&T has essentially written off the entire video business. What they retained is a 70% stake in the DirecTV partnership and 70%+ of the cash flow associated with it. The cash flow has been significant due to distribution preferences written into the partnership agreement: $1,942MM in 2021, $4,457MM in 2022 and an estimated $3,400MM in 2023.
As the distribution preferences run-off in the coming years, we can expect that cash flow to step down and taper off in the vicinity of $2B – 3B/year range, but a lot will depend on how the asset progresses. On the positive side, separating the business could save a lot of money from restructuring. In January of this year, they announced a series of layoffs. They have also chosen not to continue the money-losing NFL Sunday Ticket deal which can have both positive and negative effects – positive because they will no longer pay $1.5B per year to the NFL for broadcasting rights and negative because they will lose some revenue and subscribers. Cord-cutting will no doubt continue to relentlessly chip away at this business. In Q4 2022, they lost an additional 500,000 customers according to rating agency Fitch.
The mistake that AT&T made in 2015 was not that they bought DirecTV (although you could argue that the video business was a distraction), it was paying $67B for an asset in terminal decline and as such spent at least $32B more than it was worth. They failed to realize the full extent of the blowback from consumers whose costs for TV entertainment had risen far too high and failed to realize how broadband, competitive choices and the emergence of high-quality streaming gave consumers the arsenal to rebel against those higher costs. A similar story is playing out in their legacy wireline business.
AT&T’s Segment Analysis
Digging into the segments of the business, we can see that the wireless side of the business which comprises 68% of AT&T’s revenue and 84% of their segment operating income is growing nicely. Operating income is up 2.5% in 2021 and 5% in 2022:
AT&T’s Wireless Business Segment (AT&T’s 2022 Annual Report)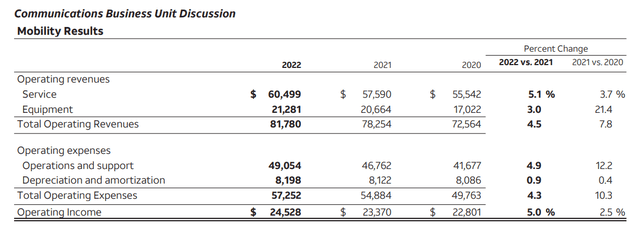
Growth in subscribers is driving this trend with 10.5% growth in 2021 and 7.7% growth in 2022:
AT&T’s Wireless Subscribers (AT&T’s 2022 Annual Report)
The business wireline segment is where the bleeding resides with revenue down by 5-6% and operating income down 16.1% in 2021 and down 19.2% in 2022:
AT&T’s Business Wireline Results (AT&T’s 2022 Annual Report)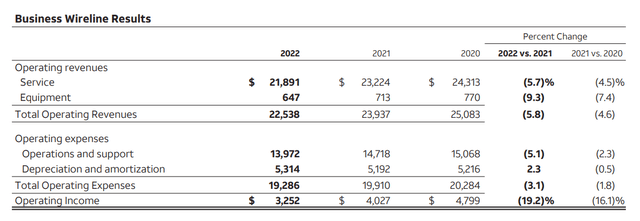
Consumer wireline results appear volatile but relatively stable. We see a balance of growth in residential fiber and a strong decline in the legacy voice and data services:
AT&T’s Consumer Wireline Results (AT&T’s 2022 Annual Report)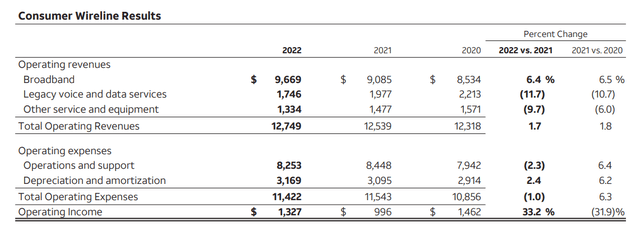
The subscriber numbers for this piece validate that assumption with strong fiber additions offsetting the loss from the copper side of the legacy voice connections:
AT&T Wireline Connections (AT&T’s 2022 Annual Report)
Summing up the segment analysis, we see exactly what we expect to see. A business that is growing in the areas of wireless and fiber and losing in the areas of both business and consumer wireline legacy services and equipment. As the growing segments get larger and the legacy segments get smaller, we should see less loss and more gain. However, the wireless business may reach a point of market saturation, limiting the upside growth of the business. The fiber business appears to have a lot of runway.
Conclusion:
AT&T generates an enormous amount of cash flow from their continuing operations, roughly $40B per year, but $29B per year (73%) was needed per year to keep their earnings flat. The majority of that $29B cash flow was plowed back into their growing segments: the wireless and fiber businesses. The rest, roughly $11B, was distributed to the common equity holder in the form of a generous dividend. Part of the reason AT&T’s earnings didn’t grow was the disastrous purchase of DirecTV for $67B in 2015. That asset turned out to be grossly overvalued by roughly $32B, and the common equity holder suffered the consequences of dilution and the loss of earnings.
Better days are ahead for AT&T as they complete their recent $35B worth of Spectrum License spend (in 2021 and 2022) and other CAPEX requirements, but their legacy businesses are still acting as an anchor on their earnings. Although their wireless and fiber businesses look promising, they still must contend with their declining wireline and video businesses. These declining segments will act as a continuing drag on earnings, and it’s possible we will see more goodwill write-downs in their wireline businesses. I recommend investors sell AT&T in the $19.50-$20 range (assuming we get a bounce back to that level) and use the proceeds to invest in better businesses.
Analyst’s Disclosure: I/we have a beneficial long position in the shares of T either through stock ownership, options, or other derivatives. I wrote this article myself, and it expresses my own opinions. I am not receiving compensation for it (other than from Seeking Alpha). I have no business relationship with any company whose stock is mentioned in this article.
Seeking Alpha’s Disclosure: Past performance is no guarantee of future results. No recommendation or advice is being given as to whether any investment is suitable for a particular investor. Any views or opinions expressed above may not reflect those of Seeking Alpha as a whole. Seeking Alpha is not a licensed securities dealer, broker or US investment adviser or investment bank. Our analysts are third party authors that include both professional investors and individual investors who may not be licensed or certified by any institute or regulatory body.
