Summary:
- Texas Instruments is a unique dividend growth stock in the technology sector, offering a 3.0% yield and consistent dividend hikes.
- The company’s efficient operations and investments position it well for the future, despite near-term headwinds in chip demand.
- While valuation is not exceptionally attractive, a potential buying opportunity may arise if the stock falls to the $140 to $150 range.
narvikk
Introduction
It’s time to discuss Texas Instruments (NASDAQ:TXN), a company I have included in a number of model portfolios in the past two years. However, I have never covered the stock in a single-stock article.
TXN is unique because of a few reasons. The company is a fantastic dividend growth stock that comes with both a relatively high yield and high and consistent dividend growth. Furthermore, its wide-moat business provides high growth rates that make aggressive dividend growth sustainable.
Furthermore, Texas Instruments is dependent on economic developments. Right now, chip demand is slowing a bit. While this is keeping a lid on TXN shares for the time being, it could offer attractive investment opportunities down the road.
So, let’s get to it!
TXN – High Tech Dividend Growth
Technically speaking, I own zero dividend growth stocks in the technology sector. While I would make the case that the definition of technology is somewhat vague, there is a reason why most dividend investors have limited technology exposure. Technology is driven by companies that are on top of the latest trends. It doesn’t happen very often that mature companies with decent yields and the ones with high growth rates.
While companies like Apple (AAPL) and Microsoft (MSFT) are certainly outliers, they do not come with high yields.
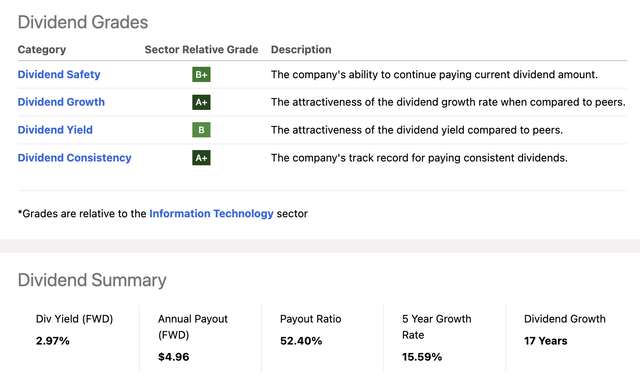
Looking at the overview below, we see that Texas Instruments has a truly unique dividend scorecard.
- The company has a 3.0% dividend yield, which is very juicy compared to the median 1.5% yield in the technology sector.
- The company has a 52% payout ratio.
- Over the past five years, its dividend has been hiked, on average, by 15.6% per year.
- Since 2004, the company has hiked its dividend every single year, resulting in 19 consecutive years of dividend growth with an average compounding growth rate of 25%!
- The most recent hike was announced in September when management hiked by 7.8%.
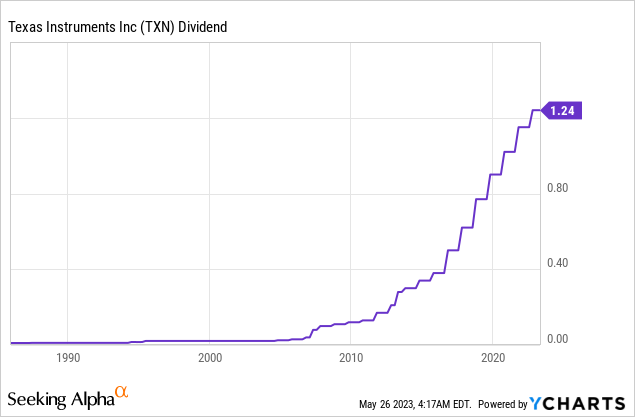
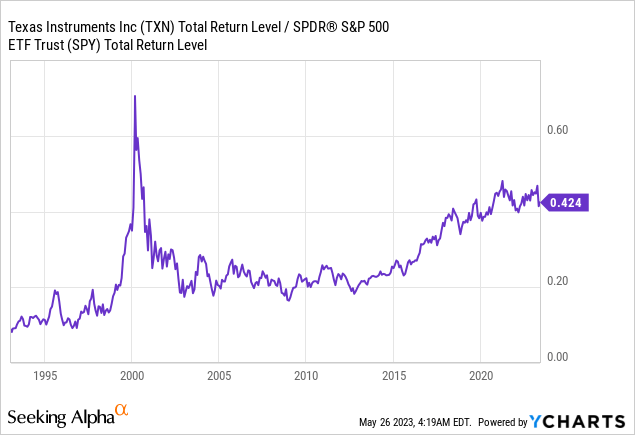
Thanks to these qualities, TXN has outperformed the S&P 500 without any major interruptions since the Great Financial Crisis, as shown by the chart below. Between the early 2000s (dot-com bubble) and the Great Recession, the performance was in line with the market.
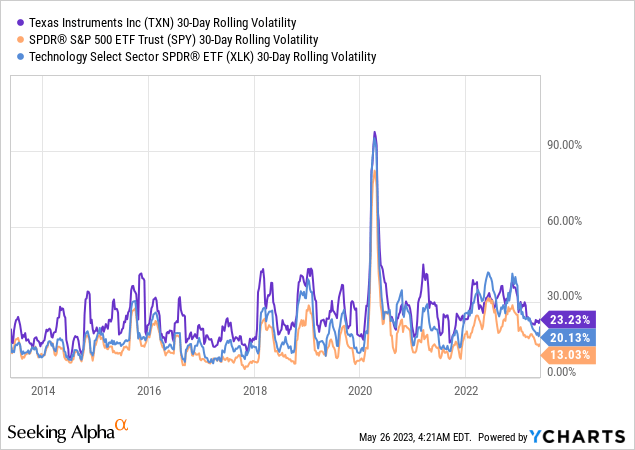
Furthermore, it needs to be said that TXN outperforms the market with subdued volatility. The current 30-day volatility is 23%, which is just 300 basis points above the volatility of the Technology Select ETF (XLK). That is impressive, as we’re comparing a single stock to a basket of stocks.
These numbers confirm the theory that high-quality dividend growth stocks can beat the market on a long-term basis with a highly favorable risk/reward, as explained by the overview below.
Nuveen (Author Annotations)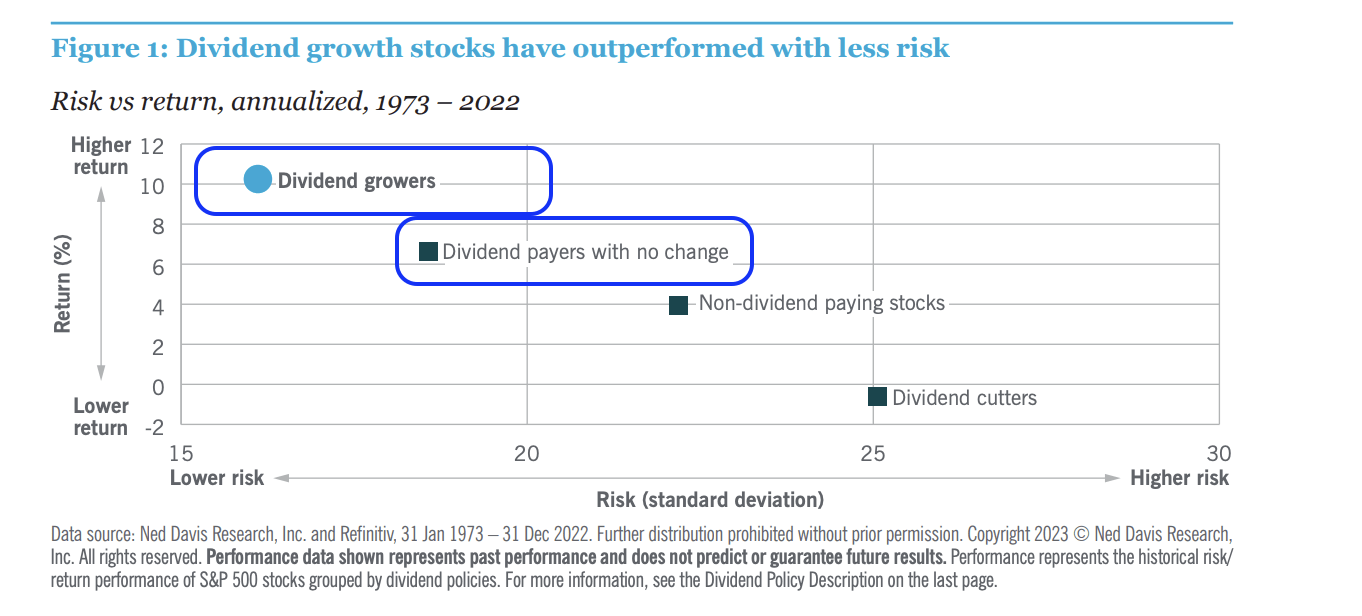
Additionally, the company has repurchased 18% of its shares over the past ten years. While there are companies with more aggressive buybacks, this helps the company to boost earnings per share and its stock price.
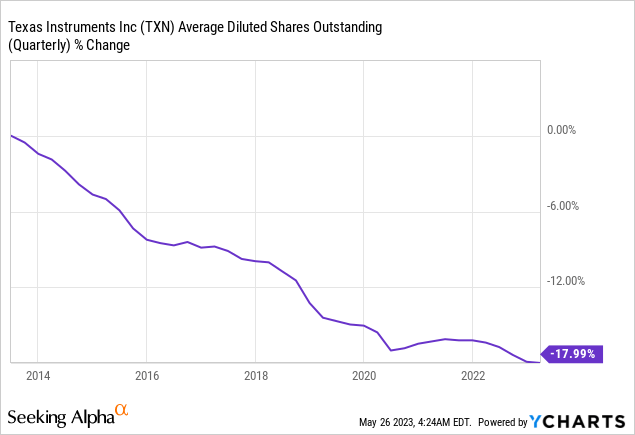
At this point, it also needs to be said that TXN’s stock-based compensation is very small compared to buybacks. It happens a lot that buybacks in the tech sector barely offset generous stock-based compensation, as some companies feel that SBC is an easy non-cash way to reward employees.
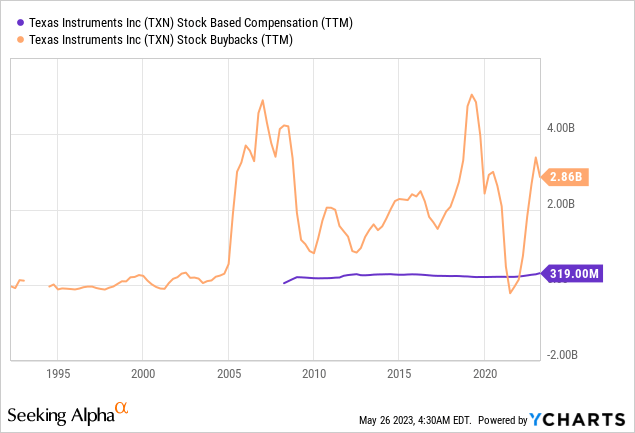
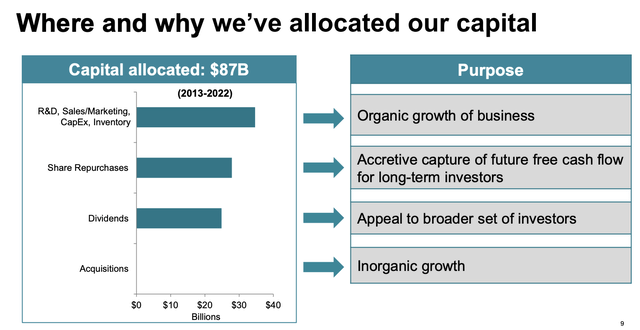
Both buybacks and dividends are part of the company’s long-term capital allocation plan. Between 2013 and 2022, the company spent a bit more on buybacks than on dividends.
R&D spending exceeded both buybacks and dividends, which makes sense, as organic growth is the only thing more important than shareholder distributions. After all, if TXN fails to innovate, its dividends become unattractive.
So far, so good.
Now, let’s dive a bit deeper into the numbers to assess why the company is able to offer high-quality dividends.
The Factors Making TXN So Special
With a market cap of $154 billion, Texas Instruments is a semiconductor company that designs and manufactures electronic components sold to global electronics designers and manufacturers.
Founded in 1930, the company has a presence in over 30 countries, with headquarters in Dallas, Texas.
TXN operates through two main segments: Analog and Embedded Processing.
According to the company, thanks to its longstanding commitment to making electronics more affordable through semiconductors, TXN has been a pioneer in transitioning from vacuum tubes to transistors and integrated circuits.
The Analog segment, which accounts for 77% of its sales, focuses on semiconductors that condition and amplify real-world signals and manage power in electronic devices.
These products are essential for powering devices and facilitating interfaces with humans, the real world, and other electronic devices. Analog products find applications in the industrial, automotive, and personal electronics markets.
The Embedded Processing segment includes digital processors that serve as the brains of various electronic equipment. These processors are designed for specific tasks, allowing optimization of performance, power, and cost based on application requirements.
These products are widely used in industrial and automotive markets.
What’s interesting is that customers often invest in their own R&D to develop software that operates on TXN’s products, leading to longer customer relationships. It also supports TXN’s margins.
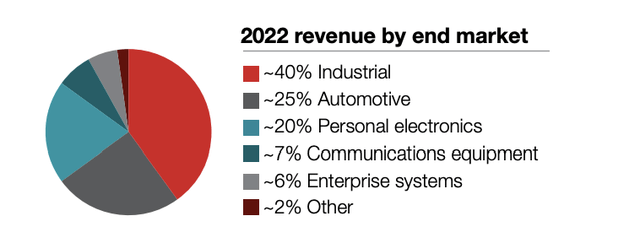
When combining both segments, the company generates 40% of its revenues in the industrial industry, 25% in the automotive industry, and 20% in the personal electronics industry.
With that said, I already briefly mentioned that this Texas-based company has an edge when it comes to efficient operations. It has great relationships with customers that allow it to leverage its capabilities.
Looking at the chart below, we see that since the year 2000, TXN has grown its revenue by 103%. Free cash flow, however, has grown by almost 360%, which includes a recent slump caused by higher CapEx. The company has more than doubled its CapEx. But more on that later.
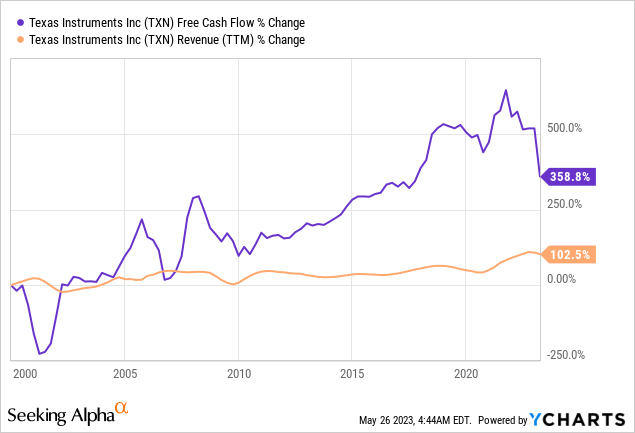
Essentially, the company has a strategy to maximize free cash flow, which is built on three pillars.
- First, TXN focuses on Analog and Embedded Processing products, leveraging four competitive advantages: a strong manufacturing and technology foundation, a diverse portfolio of products, extensive market reach, and the longevity and diversity of products, markets, and customer positions. This is basically maintaining a strong product portfolio.
- The second pillar is disciplined capital allocation, which includes careful selection of R&D projects, investments in new manufacturing capacity, development of online platforms like its website, acquisitions, and returning cash to shareholders through dividends and share repurchases. TXN has allocated $87 billion over ten years, with a significant portion invested in organic growth and capital expenditures expected to drive future free cash flow growth. This explains the aforementioned surge in CapEx, as the company is preparing for the future of semiconductors with massive investments in Texas and Utah.
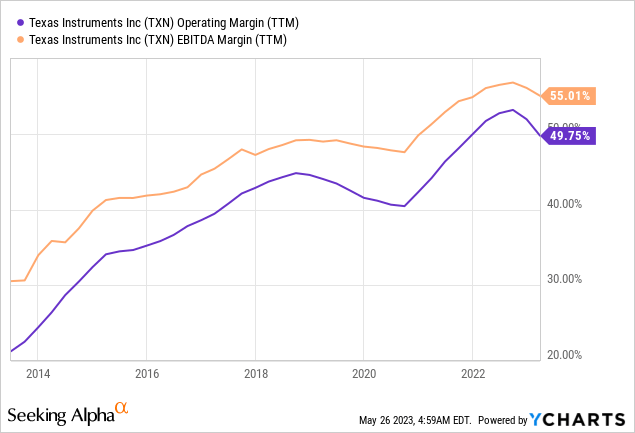
- The third pillar is efficiency, as the company is striving to maximize output for every dollar spent. This involves focusing on impactful areas rather than solely optimizing cost-cutting. Efficiency initiatives contribute to revenue growth, improved gross margins, disciplined R&D and SG&A expenses, free cash flow margins, and overall free cash flow per share growth. By solely looking at operating and EBITDA margins, it’s fair to say that the company has – so far- successfully managed to grow its operating efficiency.
With that said, TXN is currently trading 14% below its all-time high. The stock is just up 2.7% year-to-date. The S&P 500 is up 8.4%, driven by technology stocks (+28%).
Headwinds And Valuation
Last month, Bloomberg reported that TXN provided a disappointing sales forecast, indicating weak demand in the chip industry.
However, despite the lackluster outlook, the stock received support from broader optimism about a rebound in the tech sector. Bloomberg noted that investors and analysts remain confident that a recovery is imminent. Alphabet (GOOG) (GOOGL) and Microsoft’s positive quarterly reports also contributed to the positive sentiment, as it eased fears that chip demand may be falling off a cliff.
After all, TXN is somewhat of a bellwether for global chip demand.
In 1Q23, revenue came in at $4.4 billion, representing an 11% decrease compared to the previous year. The gross profit margin decreased by 480 basis points.
The company saw weakness across a number of end markets, except for automotive, which currently benefits from easing supply chain bottlenecks.
Customers are reducing orders to decrease their inventory levels. So far, the company has been able to control its inventory by reducing sales through distributors while its in-house stockpile has increased.
While the company does not comment on future demand, it is investing in in-house manufacturing capabilities and better customer relationships, which should bear fruit in a situation of accelerating supply chain re-shoring.
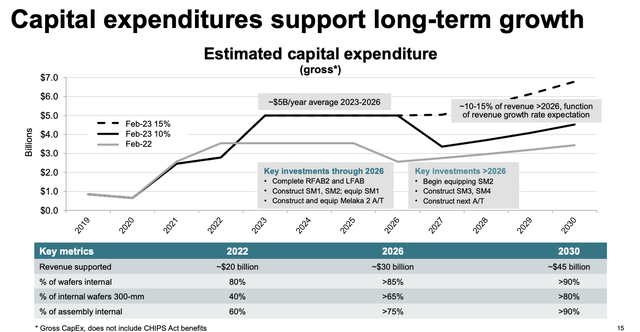
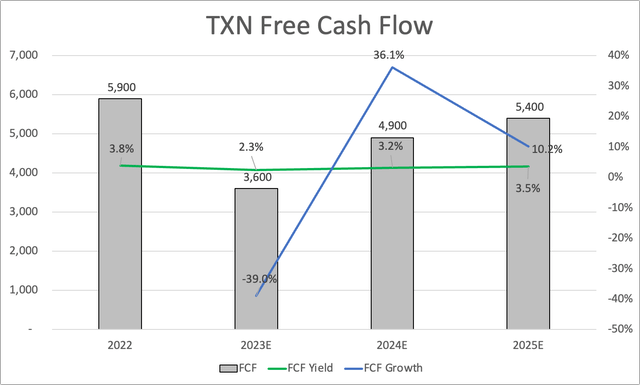
These investments are expected to cause CapEx to rise from $2.8 billion in 2022 to $4.8 billion in 2025. The result is a temporary decline in free cash flow, followed by a gradual improvement, as free cash flow growth is expected to offset higher CapEx requirements.
This means that dividend growth will likely slow, as the cash payout ratio is close between 90% and 100% using 2023 and 2024 estimates.
Net debt is expected to rise from negative $2 billion in 2021 to $4.2 billion in 2025. While that may seem like a lot, it would still not push the net leverage ratio above 0.4x EBITDA. This explains why TXN enjoys an A+ credit rating.
Furthermore, using free cash flow as a valuation, we’re dealing with a rather unattractive valuation, as the company is trading at 31x 2024E free cash flow.
However, using that valuation wouldn’t be very fair. After all, free cash flow is only down due to important investments in the company’s future. Using that as an argument to say that TXN shares aren’t attractive would be a mistake.
That said, EBITDA is slowing due to poor economic growth. This year, EBITDA is expected to fall to $9.1 billion from $11.1 billion in 2022. Next year could see a recovery to $10.1 billion.
Hence, the EBITDA multiple remains slightly above the longer-term median.
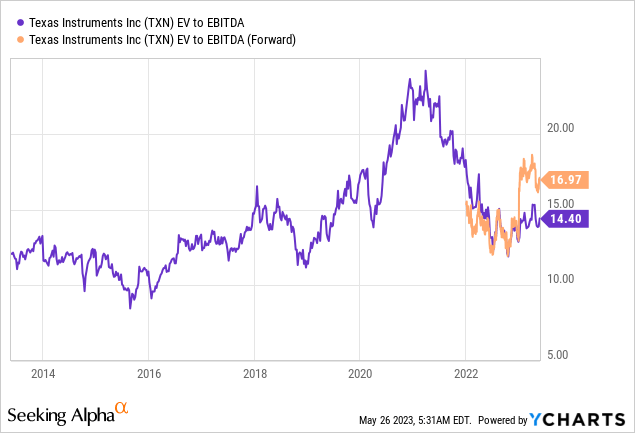
TXN shares are not overvalued. However, they are also not so attractive that I get a sudden fear of missing out.
Analyst estimates reflect this. The current consensus price target is $180, which is 5.8% above the current price.
If TXN shares fall to the $140 to $150 range, I would be interested in adding the stock to my portfolio.
I believe it’s a fantastic dividend growth stock in the tech sector with the potential for high, long-term sustainable dividend growth.
Takeaway
Texas Instruments is a unique dividend growth stock in the technology sector, with a 3.0% yield, consistent dividend hikes, and a 19-year streak of growth.
It has the ability to outperform the market with subdued volatility. Despite near-term headwinds in chip demand, TXN’s investments and efficient operations position it well for the future.
While valuation is not exceptionally attractive, a potential buying opportunity may arise if the stock falls to the $140 to $150 range.
Overall, TXN offers a compelling option for investors seeking sustainable dividend growth in the tech sector.
Analyst’s Disclosure: I/we have no stock, option or similar derivative position in any of the companies mentioned, and no plans to initiate any such positions within the next 72 hours. I wrote this article myself, and it expresses my own opinions. I am not receiving compensation for it (other than from Seeking Alpha). I have no business relationship with any company whose stock is mentioned in this article.
Seeking Alpha’s Disclosure: Past performance is no guarantee of future results. No recommendation or advice is being given as to whether any investment is suitable for a particular investor. Any views or opinions expressed above may not reflect those of Seeking Alpha as a whole. Seeking Alpha is not a licensed securities dealer, broker or US investment adviser or investment bank. Our analysts are third party authors that include both professional investors and individual investors who may not be licensed or certified by any institute or regulatory body.

