Summary:
- Apple has been a wonderful investment for long-term holders – easily outperforming the indexes.
- Apple’s investment outperformance has been underpinned by exceptional financial metrics (particularly returns on invested capital).
- Apple is not a high-growth technology company but its current market price has implied revenue growth rates which are improbable.
- Rising interest rates have increased company costs of capital. This results in higher discount rates and lower asset valuations.
- Apple’s consistent history of free cash generation justifies a lower-than-average cost of capital, but this does not protect the company from being over-priced in the current market. It’s time to take profits.
Scott Olson
Business Overview
The company currently has 5 end market-based reportable operating segments:
Author’s compilation using data from Apple’s 2022 10-K filing.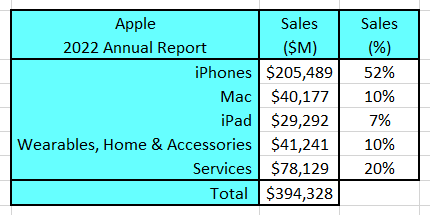
It is noted that the company does not provide a breakdown of each segment’s profitability.
Apple (NASDAQ:AAPL) operates over 525 retail stores throughout the world which exclusively sell their own products. The company also sells products online through its online App Store. The company generates 38% of its revenues by selling directly to consumers.
Increasingly, Apple’s revenues are coming from software and services and less from hardware. Currently, Services generate 20% of total revenues but these revenues are growing at close to 20% per year whilst hardware revenues are growing at about 8% (growth rates are heavily dependent upon the timing of product upgrades).
Apple has predominantly grown its revenues organically and has only spent $8,500 M on acquisitions over the last 10 years. This organic growth has been generated by a large investment in Research & Development (R&D). In the most recent year Apple spent over $26,251 M on R&D which represents 6.7% of sales. Apple has been gradually increasing this ratio over the last 10 years.
The country / regional splits for Apple’s revenues are shown in the following table:
Author’s compilation using data from Apple’s 2022 10-K filing.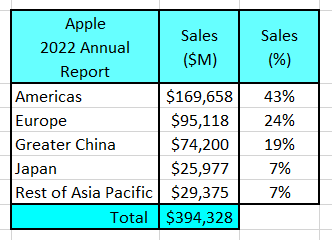
The key issue to note from this table are the revenues from China – they represent 19% of total net sales. China is extremely important to Apple.
Not only is China an important market for revenues but it is also an important sourcing market for manufactured product.
Apple relies on 3rd parties to manufacture all of its products and according to Forbes more than 95% of iPhones, AirPods, Macs and iPads are made in China.
The on-going US / China political tensions represent a significant risk for Apple.
Business Overview
Let us review each of Apple’s markets:
Smartphone Market Overview
According to Fortune Business the global smartphone market in 2021 had revenues of about $457 Billion. They project that the market will grow at around 7% per year through 2029. Statista estimates that Samsung and Apple are the market leaders with similar shares of around 23%.
The following chart shows Apple’s historical reported revenues for iPhones:
Author’s compilation using data from Apple’s 10-K filings.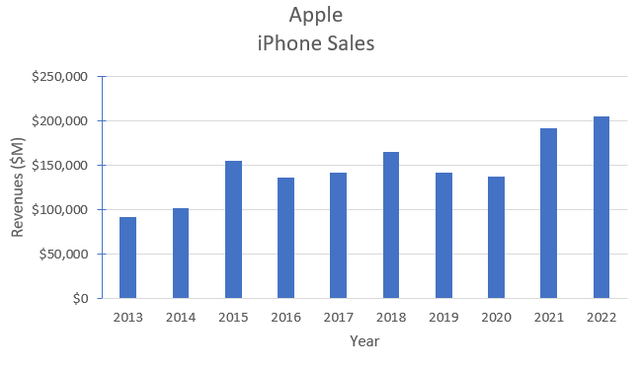
The chart shows the negative impact that the COVID community lock-downs had on revenues, but revenues have now quickly recovered to their pre-COVID levels. Over the last 10 years iPhone revenues have grown on average by almost 6% per year. Based on Fortune Business’ market growth prediction this indicates that Apple’s market share at the current average growth rate is expected to be reasonably constant.
iPhone sales for Q1 and Q2 of 2023 were around 4% lower than the corresponding period in 2022. This is perhaps linked to the slowing global economy.
Personal Computer Market – Apple Mac
The Mac was Apple’s original product, and it is the oldest segment within its product portfolio.
The personal computer market is mature and prior to the COVID pandemic, global sales had been flat to slowly declining for many years. The global pandemic response had a dramatic positive impact on the demand for desktop and notebook computers.
According to Canalys at the end of 2021 the global PC market was $250,000 M in size. They believe that Apple’s market share is around 9%.
Looking at Apple’s historical revenues for the Apple Mac division:
Author’s compilation using data from Apple’s 10-K filings.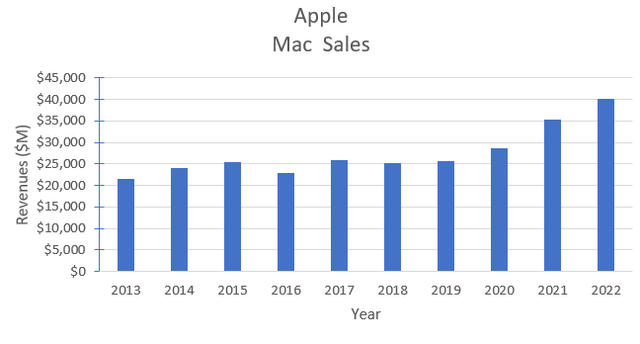
The chart shows how significant COVID was to the increase in sales of Macs. Overall, Apple seems to have done quite a good job in holding its revenues in a declining market and it may even be growing its market share.
Apple’s published filings for Q1 and Q2 of 2023 indicate that Mac sales peaked in 2022 and have started to decline back to their pre-COVID levels. This would suggest that there may be negligible Mac revenue growth in future years.
Tablet Market – Apple iPad
The tablet market has similar characteristics to the PC market. Prior to the COVID pandemic the tablet market was becoming mature and growth rates were slowing (particularly in the US and Europe). Sales increased significantly during COVID but growth rates are now returning back to their historical trend.
The market is dominated by Apple and Samsung. According to bankmycell, Apple has a market share of around 53% and this has been quite stable for several years. Statista is suggesting that the market will grow at around 1% per year over the next few years.
Looking at Apple’s historical iPad revenues:
Author’s compilation using data from Apple’s 10-K filings.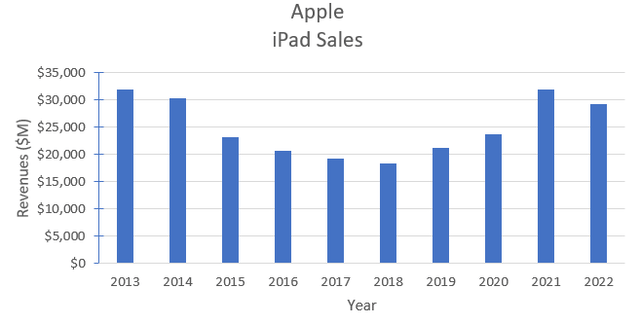
Apple’s published filings for 2023 indicate that at the end of Q2, year to date sales are currently running at almost 8% above the prior year. This was driven by a very strong Q1 but Q2 sales were much lower than the prior year.
Services
Apple’s Services’ segment comprises several revenue streams including the App Store (digital content products), Apple Music, iCloud, Apple Arcade, Apple Pay, Apple Care, advertising, etc. and 3rd party licensing royalties.
The Services segment is extremely attractive because of its “sticky” annuity style revenues (subscriptions) and the correspondingly high gross margins (Apple provides a gross margin split between hardware and services).
In 2022, gross margins for the Services segment were 71.7% versus 36.3% for hardware. Services’ gross margins have increased every year since they were first disclosed in 2017.
The following chart shows Apple’s historical Services revenues and growth rate:
Author’s compilation using data from Apple’s 10-K filings.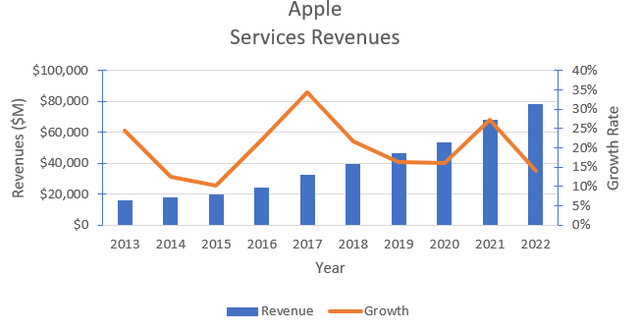
It is noted that Services represent Apple’s 2nd largest source of revenues and not surprisingly, given the size of the revenues, growth has started to moderate but still remains quite high.
Apple has reported that at the end of April 2022 they had 975 M paid subscribers across their Services’ platform (up by 125 M over the previous year). The growth rate in subscriber numbers has peaked (unsurprisingly given the large base) and in the current half year (Q2 2023) is running at an annualized 16%.
Apple Pay continues to expand the services offered through its payments network and recently launched a buy now / pay later product (BNPL). Although Apple does not provide specific information about the size of its payments network it could potentially be the 3rd largest payments business behind Mastercard and Visa.
Wearables, Home & Accessories
This group is a catch-all comprising Apple Watch, AirPods, Apple TV, HomePod and Beats with the core revenues coming from Apple Watch.
Although Apple only started reporting this segment in 2019 it has provided a further 2 years of history:
Author’s compilation using data from Apple’s 10-K filings.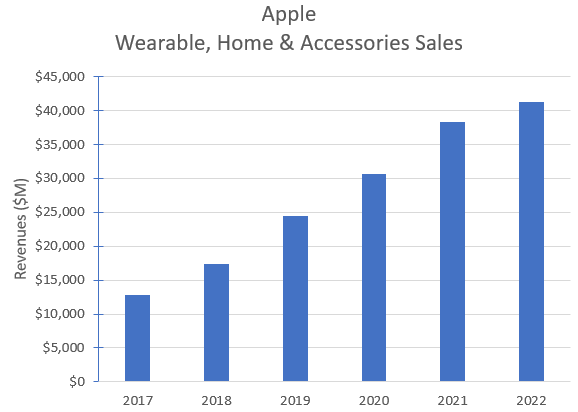
The revenue growth rates for this division also appear to have peaked and there are signs based on 2023 Q1 and Q2 data that there will be no growth this year.
Apple’s Strategy
Apple publishes very little information regarding its strategy. Most of Apple’s non-operating public statements relate to Apple’s core values. To develop a valuation for Apple I need to develop a guiding strategy which I can use to forecast future operating cash-flows.
My go-to strategic framework comes from the work of Dr Michael E Porter. In coping with competitive forces, Porter claims that companies can use one of three generic strategic approaches:
- Cost leadership
- Differentiation
- Focus
Apple is using a Differentiation strategy where its goal is to be the product leader in whatever category it decides to compete. Apple uses an operating system for its devices which makes it difficult for users to easily move to alternative products.
The company then seeks to increase its revenue per hardware user by developing and marketing a suite of value-adding services integrated with the hardware which tends to bind the user to the Apple ecosystem.
The key to Apple’s strategy is its Research and Development (R&D) process. Over the years Apple has invested heavily in product development as shown in the following chart:
Author’s compilation using data from Apple’s 10-K filings.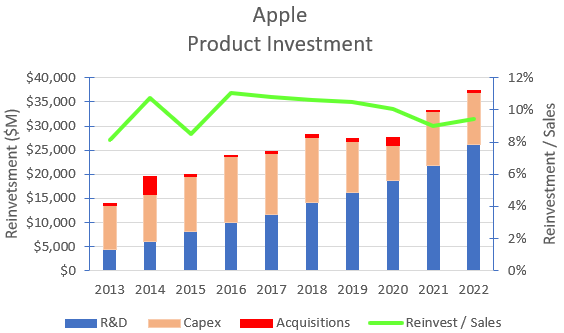
There has been almost a linear expansion in expensed R &D over the last 10 years whilst the level of capex has been restrained.
After a period of consolidation in reinvestment Apple has again started ramping up its total reinvestment. The ratio of total reinvestment to sales has been kept in a relatively tight range of 9% to 11%.
Apple’s Historical Financial Performance
The following chart shows Apple’s historical revenues and adjusted operating margin:
Author’s compilation using data from Apple’s 10-K filings.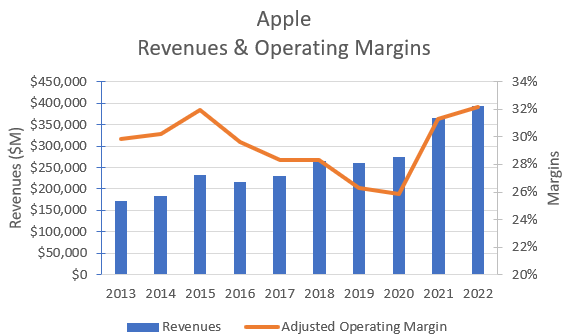
Note that I have made 2 adjustments to Apple’s reported financial statements:
- R&D spending has been eliminated from the reported Operating expenses (it should really be treated as a capital investment) and I have replaced it with a R&D Amortization charge. I have assumed that R&D has a 3-year life.
- Operating lease expenses have been eliminated and broken down into its components of debt financing and operating lease depreciation (this now happens automatically because of changes to the Accounting Standards).
The chart indicates that prior to COVID, revenue growth had been slowing but revenues have now jumped significantly as the pandemic lock-downs ended.
Prior to COVID, operating margins had been declining for many years but this situation has now been reversed. The higher margins appear to be due to the increasing proportion of higher margin Services in the sales mix but I suspect that a more dominant factor is that hardware margins have increased sharply.
I think that Apple has used the cover of tight supply and macro inflation to raise prices (this pricing tactic has been used by many companies in the post-COVID environment). Time will tell as to whether these higher margins can be sustained into the future.
The strength of a company’s competitive position is generally reflected in its return on invested capital (ROIC). It is very difficult to calculate a meaningful ROIC for Apple because of the structure of its Balance Sheet. Apple has shrunk the denominator of the ROIC calculation as a result of its large cash (and marketable securities) holdings and the level of stock buybacks (which has shrunk the book value of equity).
In 2016 and 2019 Apple had negative invested capital which arithmetically caused the ROIC to be negative. I have not shown those years in the data series as it leads to confusion with the interpretation of the information:
Author’s compilation using data from Apple’s 10-K filings.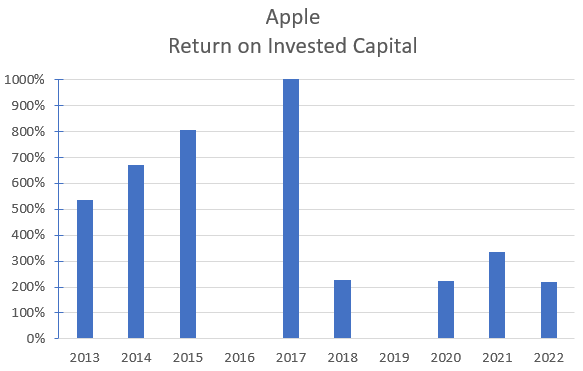
Apple’s ROIC is unbelievably good (the best that I have ever seen). It is a clear indication of the strength of Apple’s competitive position. Apple has created a market-leading consumer brand and a very loyal customer base.
Unsurprisingly Apple’s ROIC is now in decline. This is the fate of all maturing companies. Apple has been lowering its holdings of liquid assets (cash and marketable securities) and using the proceeds to buy back stock. This causes the level of invested capital to increase and arithmetically the ROIC declines (although it still remains at an unbelievably high level). These changes can be seen in the next section.
Apple’s Capital Structure
The following chart shows how Apple’s capital structure has changed over time:
Author’s compilation using data from Apple’s 10-K filings.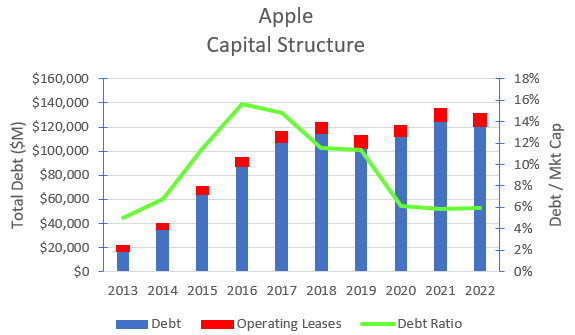
The chart indicates that Apple started strategically increasing its debt levels back in 2013. The debt was stepped up each year until 2017 when the company began a period of capital consolidation.
One of the key debt metrics is the debt ratio and this appears to have peaked some years ago because of the large increase in Apple’s market capitalization.
Apple’s balance sheet remains extremely strong and there is no doubt that the company could continue to support higher debt levels particularly whilst the stock market remains strong.
Apple’s Cash Flows
A review of Apple’s cash flows for the last 10 years reveals the following information:
Author’s compilation using data from Apple’s 10-K filings.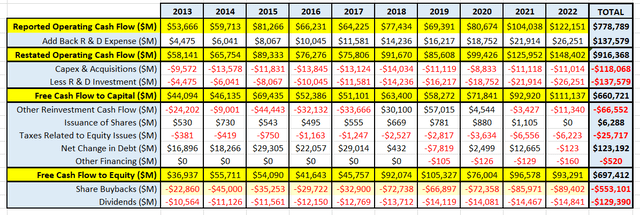
The key things to note from this table are:
- Apple only needs to reinvest about 10% of its sales turnover back into the business. This is extraordinarily low relative to other technology giants such as Google and Facebook (31% and 20% respectively).
- Apple generated almost $661 B in free cash flow. It then supplemented this free cash with its existing cash balance, added $123 B in new debt and used it to return $682 B to shareholders in a combination of share buybacks and dividends.
There are very few companies that I have evaluated that have the ability to generate these levels of returns (Mastercard and Booking Holdings have similar metrics).
Apple is a unique company in so far as its products comprise both hardware and software whilst Mastercard and Bookings are essentially software companies.
Key Risks Facing Apple
I think that there are some significant medium to long term risks for Apple investors to think about:
- China / US relationship – China is extremely important for Apple on both sides of its Profit & Loss Statement. The Chinese market is an important source of revenues but equally it is an important source of low-cost product supply. Apple is potentially a major loser if the relationship between the two countries deteriorates into a major trade war (or worse). In 2018 Apple committed to invest over $30 B in capital expenditures in the US over 5 years. There is anecdotal evidence that many of Apple’s manufacturing partners have made capability investments in the US since Apple’s announcement, but Apple has not provided any formal updates on its commitment.
- R & D success – as previously shown, many products in Apple’s portfolio are in the mature stage of their life cycle. It is imperative that Apple’s R&D continues to generate successful new products (or product enhancements) which will generate substantial sales revenues.
- Continued growth and contribution from Services portfolio – the Services’ revenues (combined with its high profit contribution) is especially important to sustain Apple’s profit growth. Apple needs to protect and grow this component of its franchise.
My Investment Thesis for Apple
Now keep in mind that this is my scenario for Apple. It is based on my best estimates of the future. I acknowledge that there will be many individuals who are better placed than I to forecast Apple’s future:
- I have made no adjustments to near term revenues which may be materially lower if there is a global recession during the 2nd half of 2023.
- I think that the mobile personal computer and the personal desk-top computing market are mature. I am not forecasting any revenue growth for the iPad and Mac divisions.
- I think that iPhones will be able to grow at the same rate that is projected for the global smartphone market (around 7%).
- Apple will continue to develop its Services’ product range therefore I expect that revenues will grow at 15% CAGR for the next 5 years before slowly declining to maturity.
- The Wearables segment will also continue to expand with revenues growing at 10% CAGR for the next 5 years before declining to maturity.
- I expect that over the next few years Apple will develop a new “blockbuster” consumer electronics product that will generate $US40 B of revenues per year at maturity.
- Apple’s hardware and services gross margins will decline over time as product categories mature but because Apple’s brand is strong, margins should remain well above the sector medians.
- I have made no significant margin adjustments for any supply chain changes which might be caused by further deterioration in US / China relationships
- Apple’s rate of R & D investment as a proportion of revenues will remain reasonably constant because of the link to strategy. I have not factored in any major acquisitions.
- Apple has a current effective tax rate of 16.2%. I suspect that this relatively low level will become politically unsustainable so I have projected that over the next 10 years the tax rate will move to the current global average tax rate of 25%.
Key inputs into Apple’s Valuation
The assumptions are then summarised into the following inputs into the valuation model:
Author’s valuation model inputs.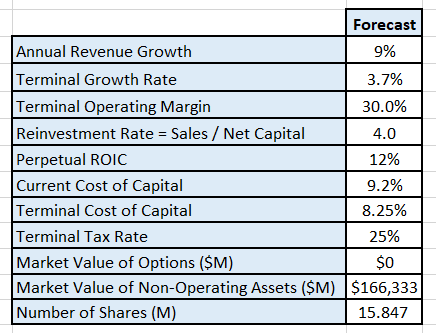
Discounted Cash Flow Valuation
A Free Cash Flow to the Firm approach is used with a 3-stage model (high growth, declining growth and maturity). The model only seeks to value the cash flows of the operating assets. The valuation has been performed in $USD.
The output from my DCF model is:
Author’s valuation model output. Author’s valuation model output.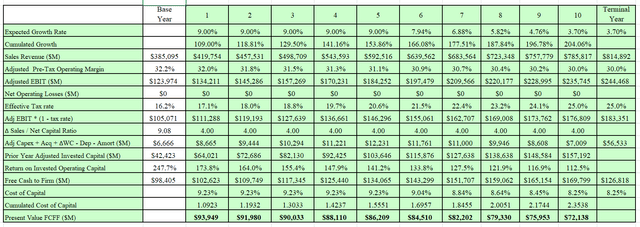
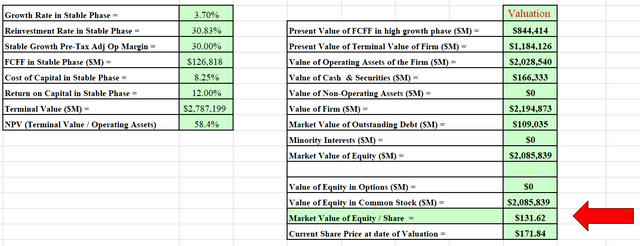
I also developed a Monte Carlo simulation for the valuation based on a range of inputs for the valuation. The output of the simulation was developed after 100,000 iterations.
The Monte Carlo simulation can be used to help understand the major value drivers in the valuation.
It turns out that the key value driver for Apple (based on my scenario) is the revenue growth estimate. This variable has the highest effect on the valuation and is the greatest source of risk in the valuation.
Author’s Monte Carlo simulation output.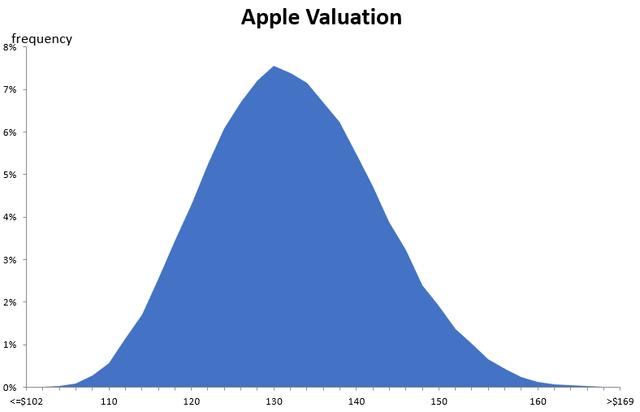
The simulation indicates that at a discount rate of 8.25%, Apple has an intrinsic value of between $102 and $169 per share with an expected value of $132.
Final Recommendation
Apple has been a wonderful investment for its long-term shareholders (I estimate that the 10-year return has been about 28.8% per year versus the SPY’s return of 11.7% per year).
There is no doubt that Apple is an extraordinary company.
My valuation indicates that Apple is currently over-priced relative to its intrinsic value. The key variable in the valuation is the forecast revenue growth. Holding all other input variables constant I have calculated the expected intrinsic value for a range of 5-year revenue growth estimates:
Author’s valuation model.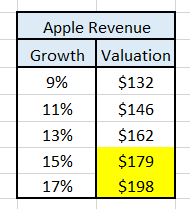
The table indicates that to justify the current share price Apple’s compound revenue growth for the next 5 years must exceed 15% at current margins.
I think that it is possible that revenues can grow above 15% but history suggests Apple has been unable to do this consistently over the last 10 years. In my opinion this supports my conclusion that Apple is currently over-priced.
Do I think that Apple is a good long-term investment?
Apple is an excellent company and at the right price it should be in your portfolio. It has a strong and enduring competitive position around its brand and the quality of its products. This is reflected in its extremely stable cash flows, low reinvestment needs and high returns on invested capital.
What should current holders of Apple be doing?
Let me acknowledge that I am a shareholder of Apple and I have held shares for many years. I have been trimming my holding as the price has increased above my assessment of its intrinsic value (particularly as market risks have also risen). I have currently taken my holding to a minimum position.
The current economic environment remains very uncertain. Although the US market has been rallying of late, the breadth of the rally has been quite shallow and restricted to a small number of mainly technology stocks (including Apple).
I think that existing shareholders should carefully review their current allocation to Apple based on their assessment of price to value, future growth expectations and the state of market risks.
Analyst’s Disclosure: I/we have a beneficial long position in the shares of AAPL either through stock ownership, options, or other derivatives. I wrote this article myself, and it expresses my own opinions. I am not receiving compensation for it (other than from Seeking Alpha). I have no business relationship with any company whose stock is mentioned in this article.
Seeking Alpha’s Disclosure: Past performance is no guarantee of future results. No recommendation or advice is being given as to whether any investment is suitable for a particular investor. Any views or opinions expressed above may not reflect those of Seeking Alpha as a whole. Seeking Alpha is not a licensed securities dealer, broker or US investment adviser or investment bank. Our analysts are third party authors that include both professional investors and individual investors who may not be licensed or certified by any institute or regulatory body.
