Summary:
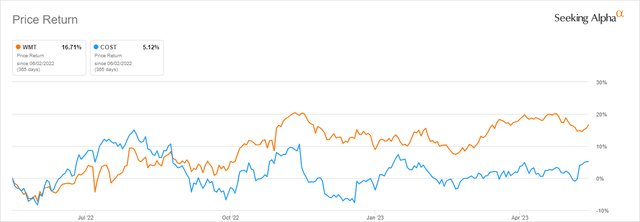
- Over the last year, Walmart has outperformed Costco.
- Walmart’s margins are much higher than Costco’s.
- Costco increases its dividend faster than Walmart.
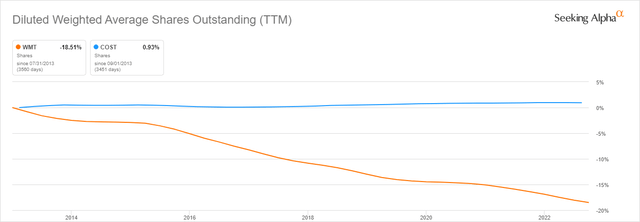
- Walmart’s share buyback plan has lowered its share count by 18%.
Ariel Skelley/DigitalVision via Getty Images
Walmart (NYSE:WMT) and Costco Wholesale Corporation (COST) have ruled the American supermarket world for many years. In fact, they are ranked number one and number two in the world in market cap.
companiesmarketcap.com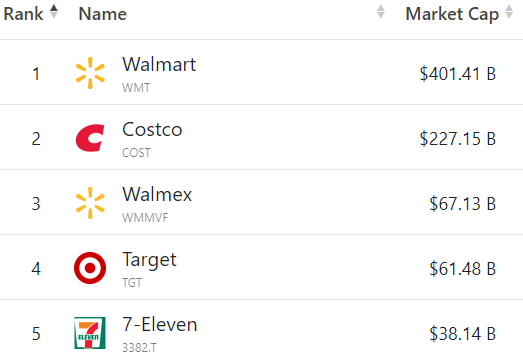
Walmart has 10,500 locations and Costco has only 589.
Over the last year, WMT has outperformed COST up 16% to COST’s 5%. But Costco has outperformed Walmart over the last 3, 5, and 10-year periods.
In this article, we will analyze both companies’ history and the potential advantages of each company as an investment for capital gains and dividends over the next year.
Financial metrics
When we look at the financial metrics comparing the two companies on a TTM (Trailing Twelve Month) basis, several metrics should be noted. The first one is the Price/Sales ratio (Line 3) which shows WMT with a ratio lower than COST’s ratio. This could imply that WMT is a better value than COST.
And note that WMT’s Revenue (Line 2) is more than double COST’s.
In the Gross Margin % (Line 5) you can see that Walmart’s GM is twice as high as Costco’s 24% to 12%. But based on GM to Market Value Percentage (Line 8) and GM to Enterprise Value (Line 9), WMT’s margins are much higher than COST’s 37% to 12% and 35% to 13% respectively. Again, this may indicate that Walmart is a better value based on market and enterprise value.
When it comes to EBITDA (Line 13), WMT looks much better with $37 billion vs $10 billion for COST.
On the Debt/EBITDA ratio (Line 14) Costco actually has more cash than long-term debt.
Seeking Alpha and author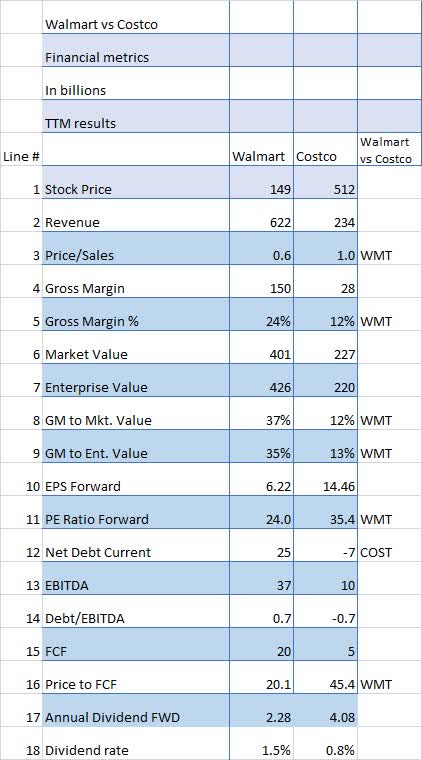
Free Cash Flow (Line 15) is also in Walmart’s favor as is the Price to FCF (Line 16). This implies Walmart generates much more cash per dollar of sales than Costco does. That would also be reflected in the margin analysis above.
And finally, the dividend rate (line 18) shows both companies about the same in the 2-3% range. We will look at the dividends in more detail later in this article.
One other issue of note is the comparison of revenue growth in the latest quarter compared to the same quarter last year. It shows WMT increased its revenue by 8% and COST only by 2%. That may imply Costco is struggling a bit with sales volumes.
author
When looking at the Financial Metrics in total, Walmart is a better cash flow generator, has recently increased revenue faster, and looks to be underpriced relative to Costco.
Based on financial metrics, Walmart is the winner by a rather large margin.
Analysts’ Ratings Show Walmart And Costco Are Both Rated Highly
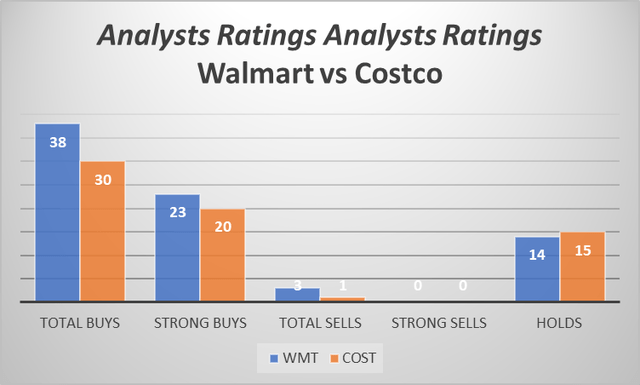
Wall Street analysts appear to have relatively strong ratings for both Walmart and Costco, with Wall Street plus Seeking Alpha analysts combined showing 38 Buys and only 3 Sells for WMT while COST has 30 Buys and only 1 Sell. So combined the two companies have 68 Buy recommendations and only 4 Sells an impressive showing for companies in the supermarket business.
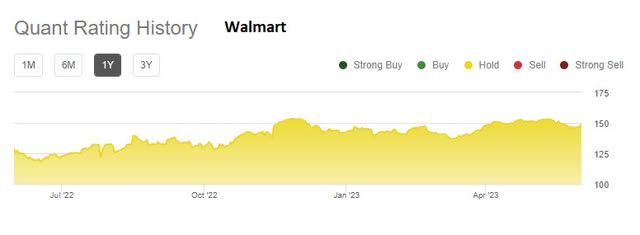
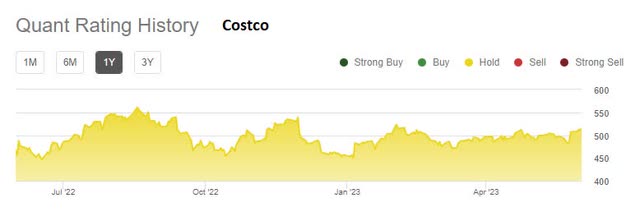
Quant ratings over the last year are very different from the analysts, showing nothing but Hold ratings for WMT and COST as opposed to 43 Strong Buys from SA and Wall Street Analysts.
So quants seem to be neutral on both Walmart and Costco, an interesting divergence from analysts’ ratings.
Dividends and share buybacks
WMT has raised its dividend for 49 years in a row and will be a member of the exclusive club, Dividend Kings.
Costco has raised its dividend 18 years in a row, an impressive number but nowhere near Walmart’s Dividend King status.
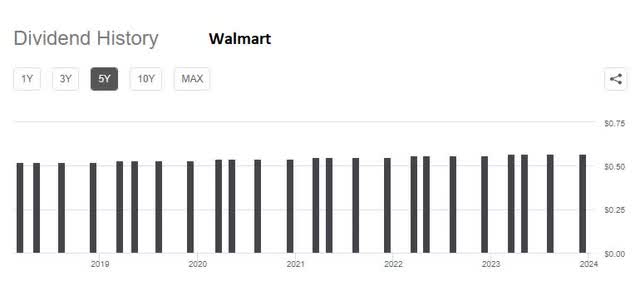
But looking at the 5-year dividend chart below we can see that WMT has raised its dividend from $.52 to $.57 per quarter over the last 5 years, an increase of 10%.
On the other hand, COST has raised its dividend by more than 100% over the last 5 years, going from $.50 to $1.02 per quarter.
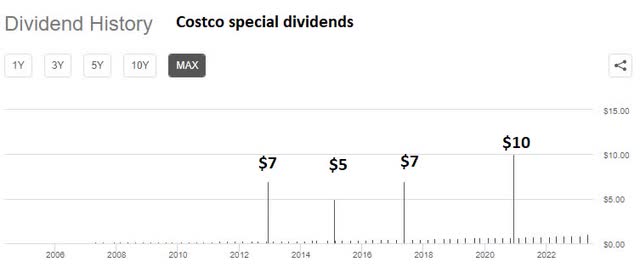
In addition, 4 times in the last 11 years, Costco has paid out enormous special dividends totaling $29 as can easily be seen on the following chart.
Ignoring the $10 special dividend in 2020, Costco has grown its annual dividend by 20% per year over the last 5 years, about 10 times Walmart’s dividend growth rate of 2%.
So, if you’re looking for a steady, consistently increasing dividend, Costco is the obvious pick, not to mention the possibility of large special dividends.
Share repurchases add to the stability of the dividend because fewer shares mean more dividends per share even if you pay out the same gross dollar amount.
When it comes to share repurchases, Walmart has decreased its share count by about 18% and Costco has increased its share count by 1% over the last 10 years. This means that Walmart has increased the value of each share held instead of increasing the dividend with those share repurchase dollars.
Therefore, I would rate the dividend versus share buybacks as even between Walmart and Costco.
Conclusion
When making decisions about dividend stocks, one of the main considerations has to be how long you plan on holding the stock. Obviously, we know from the dividend paragraph above that WMT has increased its dividend for 49 years in a row and that COST has increased its dividend for 18 years in a row.
However, the companies disagree on how to use excess cash: Walmart buys back shares, and Costco issues large, occasional special dividends.
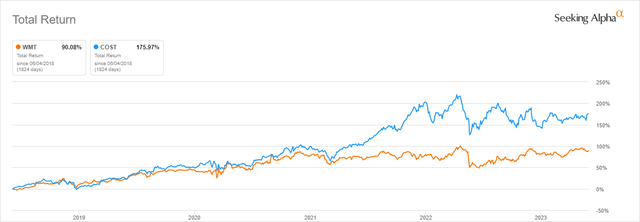
Comparing WMT and COST over the last five years on the basis of Total Return (including dividends) shows a significant difference in returns, with Costco’s up 175% while Walmart’s is up 90%, a significant advantage to Costco.
Based upon the better financial metrics over the last 12 months and share buybacks, I rate Walmart stock a Buy and Costco stock a Hold.
Analyst’s Disclosure: I/we have no stock, option or similar derivative position in any of the companies mentioned, and no plans to initiate any such positions within the next 72 hours. I wrote this article myself, and it expresses my own opinions. I am not receiving compensation for it (other than from Seeking Alpha). I have no business relationship with any company whose stock is mentioned in this article.
Seeking Alpha’s Disclosure: Past performance is no guarantee of future results. No recommendation or advice is being given as to whether any investment is suitable for a particular investor. Any views or opinions expressed above may not reflect those of Seeking Alpha as a whole. Seeking Alpha is not a licensed securities dealer, broker or US investment adviser or investment bank. Our analysts are third party authors that include both professional investors and individual investors who may not be licensed or certified by any institute or regulatory body.
If you found this article to be of value, please scroll up and click the “Follow” button next to my name.
Note: members of my Turnaround Stock Advisory service receive my articles prior to publication, plus real-time updates.

