Summary:
- Peter Lynch is often not considered a dividend investor, which is unfortunate.
- He has so many valuable insights into dividend stocks that can benefit us. It’s just his success with 10-baggers has dominated the spotlights.
- This article employs Lynch’s approach to evaluate Pfizer and Gilead Sciences.
- My results show why Pfizer is the better dividend stock undercurrent conditions.
- The article will also demonstrate the simplicity of Lynch’s method and the powerful insights they offer.

gustavofrazao/iStock via Getty Images
Thesis
Many investors have benefited from Peter Lynch’s insights on growth stocks (the so-called 10-baggers). In contrast, his insights on dividend stocks are less known, which is an unfortunate waste in my view. In his writings, Lynch described his framework of dividing stocks into six categories. And growth stocks are only one of them. While being the most exciting and lucrative category, catching these rapid growers at an earlier stage always involves a certain degree of luck. Other categories, such as stalwarts, offer a more reliable source of candidate stocks for retail investors.
Hence, this article applies Lynch’s dividends stocks to evaluate two stalwarts in the healthcare sector: Pfizer (NYSE:PFE) and Gilead Sciences (NASDAQ:GILD). This comparison will be made following the 5 insights I’ve gathered from his writing, as listed below. As you can already see, my results show that PFE is a better dividend stock based on this Lynch framework. I will go over the details to show why PFE scored higher in this system. At the same time, this elaboration will also showcase the power and simplicity of Lynch’s method, which are of timeless relevance.

Source: Author
The 5-point checklist
Out of the many insights that Lynch has offered on dividend stocks, I extracted the 5 points above for two key reasons. Firstly, their simplicity makes them easily applicable to most investors. Secondly, despite their simplicity, they provide a rather comprehensive picture of the overall health of a business, encompassing aspects such as valuation, growth potential, dividend security, financial well-being, and also operational effectiveness. More details of this checklist are provided in my earlier article. A brief recap is provided here for ease of reference:
- Dividend Track Record: A long history of consistently increasing dividends is highly valued by Lynch. His guides are to look for companies with a track record of stable dividends for at least 20 years.
- Valuation: Lynch popularizes the concept of the PEG, price-to-earnings growth, ratio. It is less well-known that he introduced a modified version of the PEG ratio just for dividends stocks. The modified ratio is called the PEGY ratio and is computed as the P/E ratio divided by the sum of the earnings growth rate and dividend yield.
- Payout Ratio: It is common knowledge that a lower payout ratio is safer. However, later on, you will see that Lynch offers a few good points for interpreting the payout ratio.
- Share Buybacks: This is an aspect where Lynch’s insights can be helpful. Share buybacks are just as valuable for total returns as cash dividends (even more so if you consider tax implications). Yet, it is overlooked by many dividend investors.
- Inventories: This is another area most investors overlook yet crucially important and simple to check. As we will see later, Lynch has good reasons and shows a practical approach to using inventories to monitor the health and efficiency of the target business.
1. Dividend record
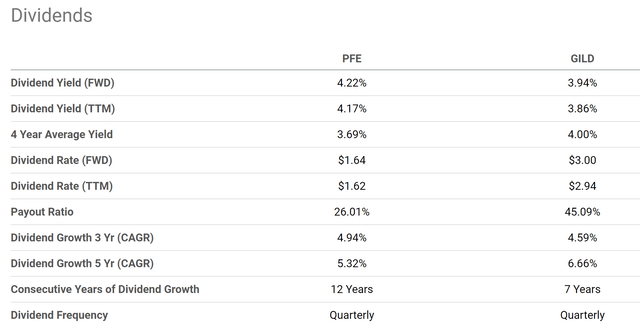
As previously stated, Lynch prefers companies that have maintained stable dividends for a minimum of 20 years. In this regard, PFE meets this requirement, but GILD does not. Pfizer has been paying dividends consecutively for more than 30 years. The company had to reduce its payout during the 2008 financial crisis. However, overall, it has a long history of dividend growth and has been growing its dividends since the 2008 cut continuously. Its dividend payments have been increasing by an average of 7% CAGR over the past 10 years. GILD only started paying dividends in 2015. Although the company has been steadily growing its payouts since it started (at a CAGR of 6.6% for the past 5 years).
Therefore, PFE scored 1 point ahead of GILD here.
Source: Seeking Alpha data
2. PEG and PEGY ratios
For ordinary investors, the methods for picking stalwart companies are much more tractable (compared to, say, picking growth stocks or turnaround stocks) because dividends provide the most reliable indicator of the company’s true economic earnings. And as such, dividend growth provides a reliable estimate of the true earnings growth (rather than accounting earnings growth, which can be misleading).
Therefore, my following analyses are based on the growth rate of their dividends as a representation of their true earnings growth. By this metric, GILD has been growing at a slightly slower rate (4.59% in the past 3 years) than PFE (4.94%). Regarding the Price-to-Earnings (P/E) ratios, I utilized the FWD FY1 ratios as provided in the second chart below. As seen, PFE has an FY1 P/E ratio of 11.57x, slightly above GILD’s 11.22x. All told, PFE’s Price/Earnings to Growth ratio (“PEG”) ended up being a bit lower than GILD’s (2.34x vs. 2.44x).
And this is where Lynch’s PEGY ratio can really provide valuable insights. The PEGY ratio is computed as the P/E ratio divided by the summation of the growth rate and dividend yield. The insight is that if you are getting substantial dividends already, then you do not need high growth to enjoy a healthy total return anymore. PFE and GILD currently provide a cash dividend yield of 4.22% and 3.94%, respectively. Thus, the PEGY ratio turns out to be 1.26x for PFE and 1.32x for GILD. Now you can see that the PEG ratios are far above the 1x threshold Lynch promoted. But this is misleading because the PEG ratio ignored the role of the dividends. Once the dividends are considered, their PEGY ratios are actually quite close to the 1x threshold.
All told, I would give another point to PFE because of its lower PEGY ratio.

Source: Author based on Seeking Alpha data

Source: Seeking Alpha data
3. Dividend payout ratios
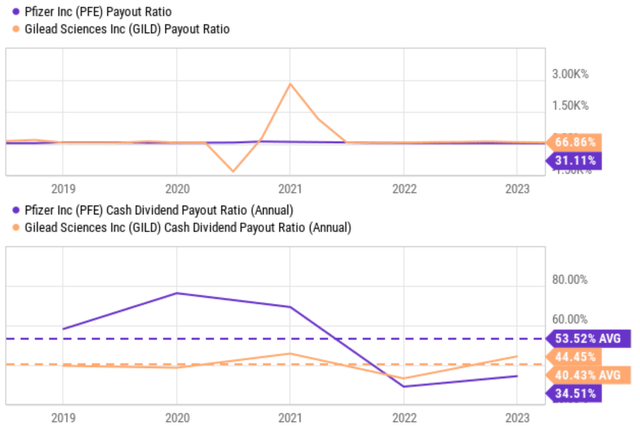
The first chart below compares their earnings-based payout ratios. The chart was difficult to read because the accounting EPS caused large fluctuations. However, ignoring these irregularities, both companies have been maintaining similar earnings payout ratios in recent years. And currently, PFE has a lower ratio of 31% compared to GILD’s 67%.
Cash payout ratios mitigate the fluctuations in accounting EPS and paint a more consistent picture, as depicted in the bottom panel of the chart. Historically, GILD has maintained a lower average cash payout ratio of 40.4% compared to PFE’s average of 53.5%. Yet, PFE’s current cash payout ratio stands at 34.5%, far below its historical average and also below GILD’s 44.4%.
Given the mixed comparison here (current vs. historical average), I consider it a tie on this checkpoint.
Source: Seeking Alpha data
4. Share buybacks
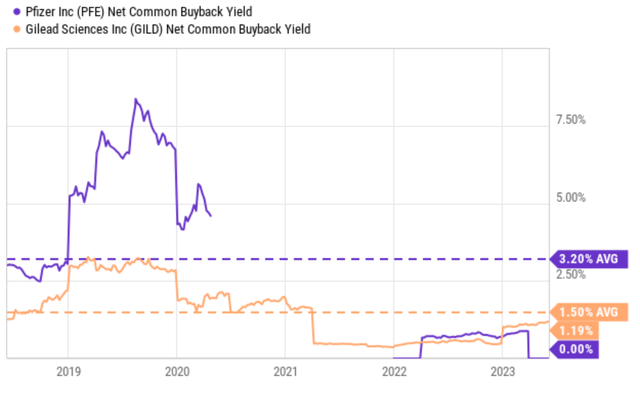
Both PFE and GILD have been buying back their own shares regularly, as evidenced by the data shown below. To be more specific, GILD has maintained an average common buyback yield of 1.50% since 2018 and its current common buyback yield stands at 1.19%, slightly below its historical average. PFE’s historical buyback yield is much higher (3.2% on average since 2018). However, its current common buyback yield is lower than the current level of GILD.
As such, this is another area I would call a tie.
Source: Seeking Alpha data
5. Inventory management
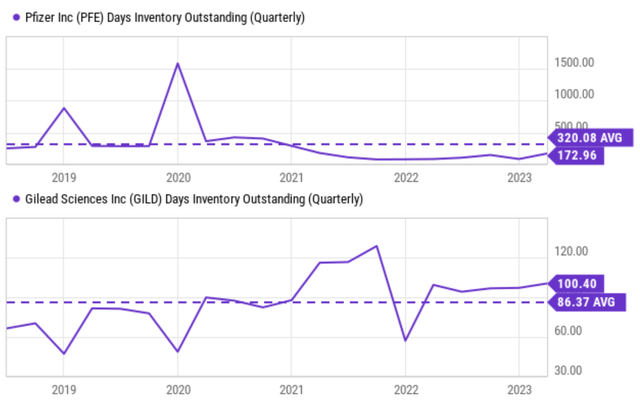
After two rounds of ties, the last point, inventory management, has a clear winner (i.e., GILD) as seen in the chart below. GILD maintains a significantly lower inventory level, both historically (averaging ~100 days) and presently (86 days). It is noteworthy that PFE has enhanced its inventory efficiency over the past few years, reducing it from over 300 days to the current level of approximately 172 days.
Of course, the higher inventory level of PFE can be explained by the nature of its business segments, its products in general also have a longer manufacturing lead time (which requires it to keep more inventory to ensure production), and it also has a more global reach (which requires it to maintain a more expansive logical network). Nonetheless, higher inventory does represent a disadvantage ultimately. It ties up capital, poses balance sheet risks, and also increases operational costs.
Source: Seeking Alpha data
Risks and final verdict
Risks
To keep the article focused, my analyses so far have focused on their dividends, instead of their drugs and pipelines. As pharmaceutical companies, both GILD and PFE face continuous uncertainties in their existing drug sales and pipeline developments. For GILD, I expect the revenue from its COVID-19 treatment (mainly Veklury) to decrease substantially as coronavirus-related hospitalizations decline. More people are getting vaccinated and receiving annual booster shots. Meanwhile, its core HIV franchise has also been facing growth pressure for years. The company has been actively seeking a new blockbuster drug. However, the success of its main new entrants (Lenacapavir and Trodelvy, both for breast cancer) remains to be seen. PFE faces a decline in its COVID-related products too due to the same headwinds facing GILD. And it has also been aggressively developing new pipeline drugs. Notably, it recently agreed to acquire cancer specialist Seagen (SGEN) in a deal valued at $43 billion. The acquisition poses several immediate uncertainties, including the price tag ($43B represents about 1/3 premium to SGEN’S preannouncement closing price), Federal Trade Commission scrutiny, and also the subsequent integration if the deal is approved.
To conclude, investors can benefit as much from Peter Lynch’s insights on dividend stocks as on growth stocks. And I would argue his system for dividend stocks is even more valuable for most retail investors because the data involved are simpler and more objective. As a demonstration, this article applied the method to compare PFE and GILD. After a holistic comparison of safety, growth, valuation, and inventory management, the results show that PFE is the more attractive dividend stock under current conditions.

Source: Author
Analyst’s Disclosure: I/we have no stock, option or similar derivative position in any of the companies mentioned, and no plans to initiate any such positions within the next 72 hours. I wrote this article myself, and it expresses my own opinions. I am not receiving compensation for it (other than from Seeking Alpha). I have no business relationship with any company whose stock is mentioned in this article.
Seeking Alpha’s Disclosure: Past performance is no guarantee of future results. No recommendation or advice is being given as to whether any investment is suitable for a particular investor. Any views or opinions expressed above may not reflect those of Seeking Alpha as a whole. Seeking Alpha is not a licensed securities dealer, broker or US investment adviser or investment bank. Our analysts are third party authors that include both professional investors and individual investors who may not be licensed or certified by any institute or regulatory body.
As you can tell, our core style is to provide actionable and unambiguous ideas from our independent research. If your share this investment style, check out Envision Early Retirement. It provides at least 1x in-depth articles per week on such ideas.
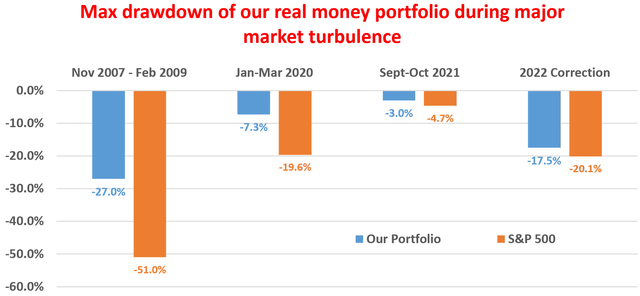
We have helped our members not only to beat S&P 500 but also avoid heavy drawdowns despite the extreme volatilities in BOTH the equity AND bond market.
Join for a 100% Risk-Free trial and see if our proven method can help you too.
