Summary:
- Amazon has taken advantage of the shift from physical to online retail sales and the shift in IT spending from on-premise to the cloud.
- Despite being an early mover in both sectors, management has found it difficult to transform the high growth into profits for investors.
- Amazon Web Services is profitable on its own. The rest of Amazon’s product and services categories are breakeven or unprofitable.
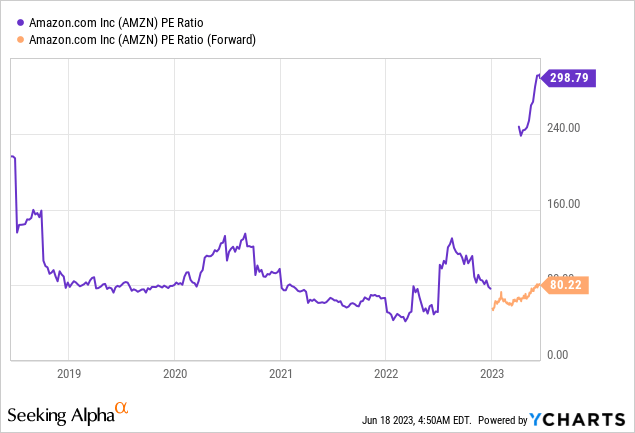
- For the company to be investable at 80 times 2023 earnings, one needs high conviction that the company will be able to produce significant sustainable profits in the mid term.
Ilija Erceg
Investment Thesis
Amazon (NASDAQ:AMZN) has been one of the most successful enterprises in America’s history, generating over $2.8 trillion in net sales over the company’s existence. Over the same period, the company has generated about $85 billion in net profits for investors i.e. roughly 3% of sales. Investors who participated in the company’s IPO in May 1995 have earned an extraordinary return on that capital, about 32% p.a. Investors who got in 10 years ago have earned almost 25% p.a. while investors who got in 5 years ago have earned only about 8% p.a. 8% is not bad, but probably below what most of us expect from our single stock investments.
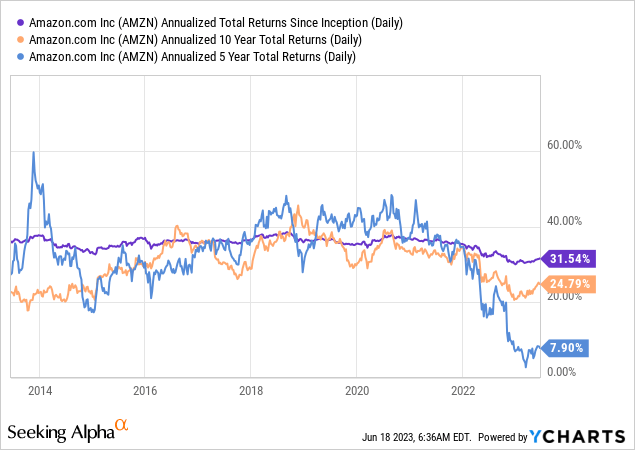
The point with the graph above: When evaluating an investment opportunity, an intelligent investor strives to look forward and not in the rearview mirror. Amazon has benefitted from megatrends such as the shift from physical to online retail and IT spending shifting from on-premises to the cloud. Although these trends have been ongoing for a while, they still present a massive growth opportunity for Amazon. According to Amazon’s CEO Andy Jassy, about 80% of retail sales still take place in physical stores and about 90% of global IT spending still happens on-premises.
Despite these tailwinds and Amazon’s ability to innovate, I still view it as a lousy investment at its current price. The main reason is the valuation, which is about 80x P/E using estimated earnings for 2023. Another reason is the cash flow profile. I don’t doubt the company’s ability to grow topline at healthy rates in the future nor its ability to grow earnings. However, the capital expenditures needed to achieve this growth is massive. The economics of Amazon’s business model means the returns on invested capital (ROIC) are mediocre at best, averaging about 10% over the last decade. The final reason is the megatrends. Although I believe that these megatrends will continue and grow Amazon’s markets, there is substantially more competition than there was 5 to 10 years ago, especially in e-commerce as most physical retailers have become omnichannel retailers which in the end squeeze margins.
Unpacking Amazon’s product mix change
A large chunk of Amazon’s business, although not the most profitable part, is the sale of retail products through their online and physical stores which the company categorizes as product sales. Practically the rest of Amazon’s sales are classified as service sales. The largest part of this section is third-party seller services i.e. Amazon’s share of sales (commissions etc.) that have occurred on its online platform by independent vendors. The other major categories in this segment are Amazon Web Services (AWS), subscription services and advertising services. AWS sells cloud computing services, subscription services sell memberships such as Amazon Prime while advertising services sell e.g. sponsored ads.
Mar-2023 TTM sales split by products and services (Amazon financial statements, compiled by analyst)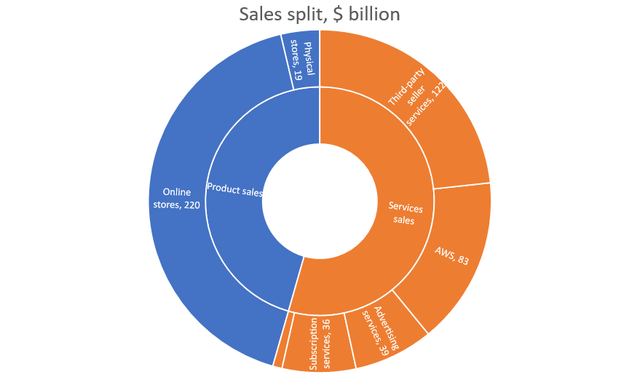
Note that although Amazon started as an online retail store and its legacy has been in the products category, services have grown at a more rapid pace and now account for the majority of total sales.
Sales development by category (Amazon financial statements, compiled by analyst)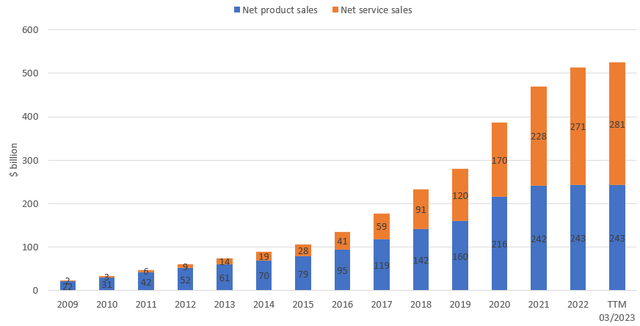
Although it would be very interesting to see operating margins, capital expenditures and total assets per product and service category, the company doesn’t provide this information so we’re left to guess whether the online store business is more profitable than for example advertising services. What Amazon does report, is sales and operating income geographically and for AWS globally. I don’t find the geographical split too informative for other than macro purposes as there’s a hodgepodge of different businesses included in a certain region. The AWS reporting is of high value, however. Below is the development of AWS net sales and operating income.
Amazon Web Services topline and operating income (Amazon’s financial statements, compiled by analyst)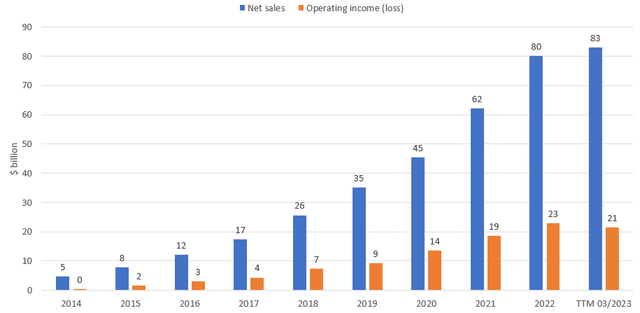
What’s interesting in these figures is that AWS has driven most of Amazon’s profitability. Although we can’t conclude that all other segments are unprofitable from the graph below, it’s highly likely that most of the other businesses are – unprofitable that is. The other categories were around breakeven for years 2013 to 2017 and profitable from 2018 to 2021. In 2022 the other segments made an operating loss of $11 billion. What happened?
AWS drives Amazon’s profitability (Amazon financial statements, compiled by analyst)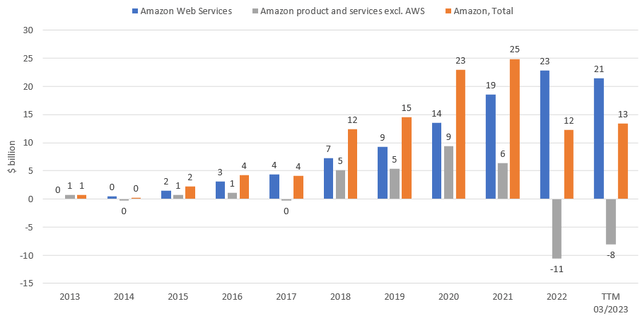
To answer that question, we have to step back and look at the bigger picture. During the last decade, Amazon has gone through a significant change in its business model as it has added service offerings such as cloud computing and video streaming to its portfolio. This can be seen from the gross margin development during the last decade. Cost of sales as a percentage of revenues has decreased as Amazon’s business consists less of e-commerce i.e. purchasing products for resale in its online stores.
Cost of sales has decreased due to product mix change (Amazon financial statements, compiled by analyst)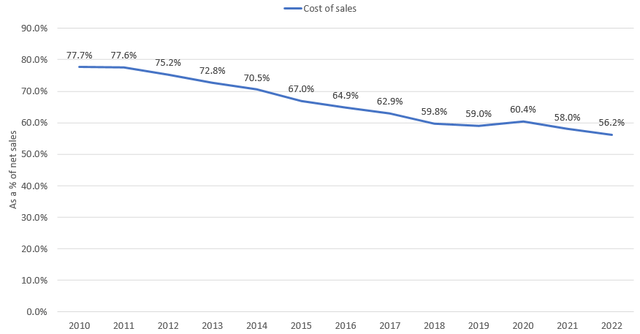
Meanwhile, the other operating expense categories have increased due to the change in product mix. For example, technology and content expenses have increased due to large investments in cloud computing (AWS) and video streaming. In addition, according to my understanding, fulfillment costs have increased as a percentage of net sales as commissions (third-party seller services) and physical store sales have increased compared to products Amazon purchases for resale online (classified as online sales). The margins of physical stores are obviously lower than the margins of online stores. Third-party seller services i.e. independent vendors also take their share of the profits making it less profitable than Amazon’s own online stores. In addition, payment processing costs are also higher when selling third-party products as the processing costs are charged on the gross purchase price.
Increase in operating expenses due to product mix change (Amazon financial statements, compiled by analyst)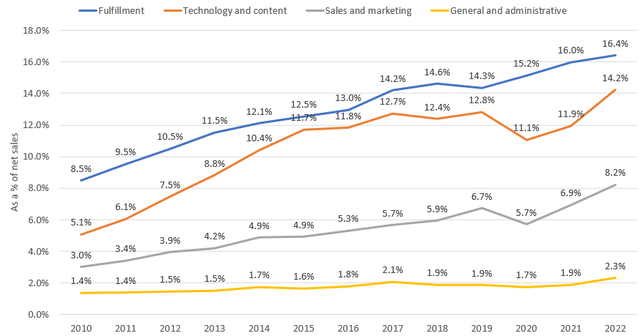
The big picture is that the product mix change has led to a decrease in the cost of sales but an increase in the rest of the operating expenses. That doesn’t answer the question of why Amazon (excluding AWS) became unprofitable in 2022. We can get a better understanding of the reasons for this (although incomplete understanding due to the limited reporting of the company) by looking at the change in margins for the different expense categories for the period 2021-2022. Amazon’s total operating income margin decreased by 2.9% in 2022 (from 5.3% in 2021 to 2.4% in 2022). Gross profit margins increased by 1.8% in 2022 as we would expect it to do as services are becoming a larger part of the product mix. The graph below shows that the rest of the operating expense categories contributed to the decline in the operating income margin. The most significant increases are technology and content in addition to sales and marketing expenses.
Operating cost increase drives decreased profitability (Amazon financial statements, compiled by analyst)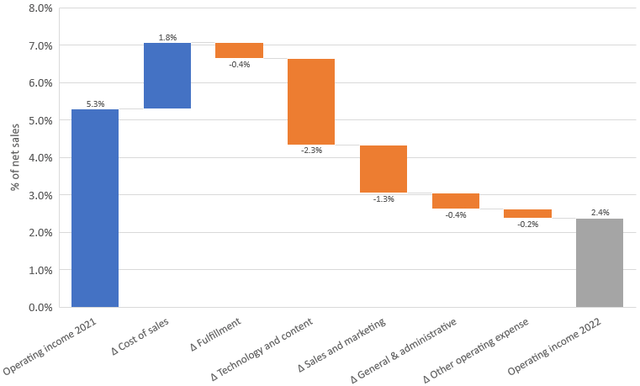
I would argue that the large increase in technology and content costs is due to the heavy investment program of Amazon during the years 2020-2022 in addition to increased personnel expenses. The investments are expensed on the income statement in the following years as depreciation and amortization costs and are to a large part included in technology and content costs. In 2019, net capex was $12.7 billion and increased to $35.0 billion, $55.4 billion and $58.3 billion in 2020, 2021 and 2022, respectively.
Sales and marketing expenses increased due to increased personnel expenses and marketing expenses. It’s understandable that these expenses increase in absolute terms as the business grows and the product mix changes. At some point, sales and marketing expenses should be expected to stay relatively stable as a percentage of net sales or even decrease assuming the business has some scale benefits. This is not the case at the moment and the significant relative increase is a bit worrying.
To answer the question “What drove the unprofitability (excluding AWS) in 2022”, it’s simply Amazon’s growth investments and increased personnel expenses. Expenses derived from growth and maintenance investments will increase for the foreseeable future as depreciation charges will increase due to continued larger growth and maintenance investments than in the past (pre-2020). With the increased scale of operations, personnel expenses will increase in absolute dollars as well. It’s now up to Amazon to drive efficiencies in the operations i.e. keeping personnel expenses in line with net sales.
There are concrete indications that the most unprofitable projects are abandoned, as Amazon’s CEO Andy Jassy commented on in his 2022 shareholder’s letter:
In some cases, it led to us shuttering certain businesses. For instance, we stopped pursuing physical store concepts like our Bookstores and 4 Star stores, closed our Amazon Fabric and Amazon Care efforts, and moved on from some newer devices where we didn’t see a path to meaningful returns.
The valuation is rich
Just looking at the P/E ratio we see that it doesn’t really provide any analytical value to us as the company is barely breakeven i.e. the latest TTM metric is distorted. The forward P/E ratio is a bit better but here we can also conclude that the market is expecting significant growth not only in 2023 but also over the mid-term in order to bring the P/E multiple down to acceptable levels.
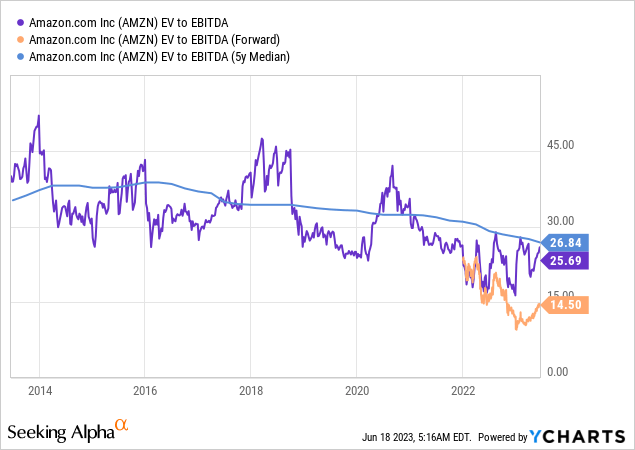
As Amazon is barely breakeven it makes sense to value the business on other metrics such as EV/EBITDA, EV/EBIT or EV/Revenues. I’d like to use EV/EBIT as that takes into account the company’s depreciation and amortization charges which are very real expenses. However, due to the breakeven nature of the company, the EV/EBIT measure is neither of much analytical value here. The EV/Revenue multiple is usually informative when valuing unprofitable growth businesses i.e. businesses that are “early stage” in their maturity curve and therefore invest significantly in the business to support topline growth. It doesn’t quite fit Amazon either due to its already mature business profile.
The EV/EBITDA multiple, which doesn’t take into account the company’s maintenance capex (as a rule of thumb it can be estimated to be roughly equal to depreciation although it depends on the sector the company operates in) nor its growth capex, looks quite low for the untrained eye. It doesn’t sound that rich to pay 14.5 times on the company’s next year’s EBITDA. As I’ve alluded to in this article, in Amazon’s case, EBITDA does not give a good picture of the company’s earnings power due to its heavy capex program. EV/EBITDA is therefore not either a good metric for this company.
To conclude, it’s hard to value Amazon on any traditional metric due to the breakeven nature of the business. I, for one, lack the conviction that Amazon will be able to grow its earnings in the mid-term to justify its current price. Another investor may have the conviction that earnings will grow enough to make the current price a compelling investment case and implicitly provide a fair return on deployed capital. This investor could value the business on a future P/E multiple or based on discounted cash flows. The best thing about investing is that you don’t have to swing (invest) if you’re not comfortable with the value you get at the current price which is why I rate Amazon a sell.
Analyst’s Disclosure: I/we have no stock, option or similar derivative position in any of the companies mentioned, and no plans to initiate any such positions within the next 72 hours. I wrote this article myself, and it expresses my own opinions. I am not receiving compensation for it (other than from Seeking Alpha). I have no business relationship with any company whose stock is mentioned in this article.
Seeking Alpha’s Disclosure: Past performance is no guarantee of future results. No recommendation or advice is being given as to whether any investment is suitable for a particular investor. Any views or opinions expressed above may not reflect those of Seeking Alpha as a whole. Seeking Alpha is not a licensed securities dealer, broker or US investment adviser or investment bank. Our analysts are third party authors that include both professional investors and individual investors who may not be licensed or certified by any institute or regulatory body.
