Summary:
- With AI hype starting to turn into real demand, the recent rally in semiconductor stocks is heating up.
- In this note, we shall compare Nvidia Corporation and Intel Corporation to find the better buy among these semiconductor heavyweights.
- To do so, we will use a mix of fundamental, quantitative, technical, and valuation analysis. Let’s jump straight in!
Randy Shropshire
Introduction
Since the ground-breaking launch of OpenAI’s ChatGPT in late 2022, the public, corporate, and governmental interest in generative AI technology has absolutely skyrocketed. Due to their pivotal role in a potential AI revolution, semiconductor stocks have surged higher in 2023, with the VanEck Semiconductor ETF (SMH) up ~51.4% YTD.
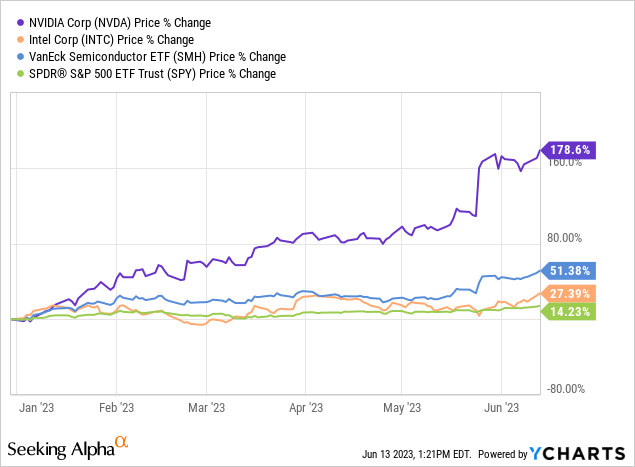
Both Nvidia Corporation (NASDAQ:NVDA) [up ~180% YTD] and Intel Corporation (NASDAQ:INTC) [up ~28% YTD] have delivered significant outperformance over the S&P 500 Index (SP500) this year. And while Nvidia appears to be the greatest thing since sliced bread, Intel looks like a sinking ship in the early phases of the generative AI wave.
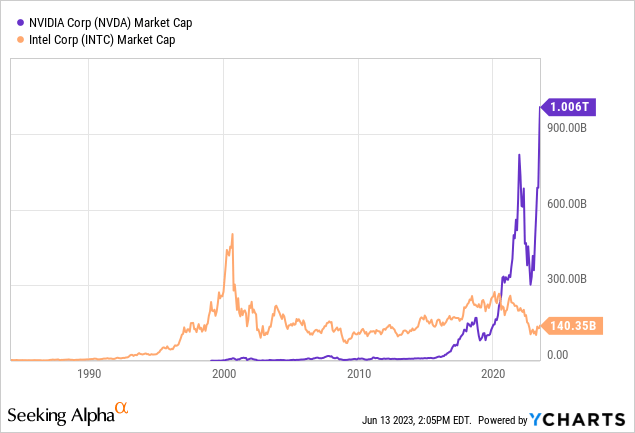
Recently, Nvidia became the first semiconductor company to hit the $1T market capitalization milestone, and as of today, Nvidia is valued at roughly ~7x Intel’s market cap. Amid intense fervor around AI, the gulf between these semiconductor stocks has gotten to unprecedented levels, with Mr. Market clearly betting big on Nvidia, bidding the stock up to ~40x P/S.
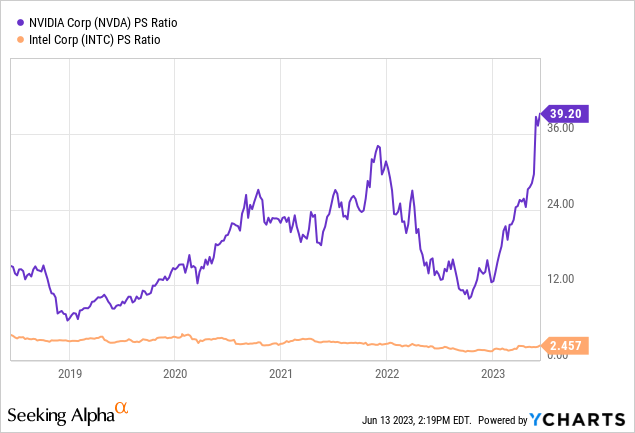
The murmurs of an AI bubble are growing louder by the day, as lopsided price momentum in Semis and Big Tech is giving investors flashbacks of the Dot-com boom and bust of 2000-2002. Much like the Internet, generative AI has a lot of unknowns, and only time will separate the wheat from the chaff. In this article, we will try to figure out the better buy between NVDA and INTC using a mix of fundamental, quantitative, technical, and valuation analysis.
Before we look at any financial numbers, let’s see if comparing Nvidia and Intel makes any sense.
Are Nvidia and Intel Comparable Businesses?
As you may know, Intel is a leading manufacturer of central processing units (CPUs) and other semiconductor products that power a wide range of devices, including personal computers and data center servers. Traditionally, Intel has dominated the CPU market; however, losing process node leadership to Taiwan Semiconductor Manufacturing Company Limited (TSM) has allowed competitors like AMD to win market share in recent years.
On the other hand, Nvidia is primarily known for its graphics processing units (GPUs) and artificial intelligence technologies that currently deliver best-in-class parallel processing and accelerated computing performance in the semiconductor industry. In addition to being a major player in the gaming industry, Nvidia is making significant inroads into the data center market with its Ampere and Hopper architecture-based AI chips. Nvidia’s GPUs are widely used in data centers and supercomputers for tasks like AI training and inferencing. As of Q1 2023, Nvidia held a monopolistic 84% share of the discrete GPU market [which looks set for explosive growth in coming years as large language models and generative AI go mainstream].
While Nvidia and Intel have historically focused on different areas, their paths have started to converge. In recent years, the competition between Nvidia and Intel has intensified as they both aim to encroach on each other’s turf and capture a larger share of the rapidly-growing data center market, which is driven by the increasing demand for AI [artificial intelligence] and HPC [high-performance computing] workloads.
For instance, Nvidia has been developing its data center business, targeting AI and high-performance computing applications traditionally served by Intel’s CPUs [servers]. Furthermore, Nvidia has been expanding its data center networking solutions since acquiring Mellanox in 2019. Also, Nvidia looks all set to encroach on Intel’s territory with its Grace CPU Superchips.
And it’s not just Nvidia firing all the shots; Intel is also making an aggressive push into the discrete GPU market (Nvidia’s turf) with its Arc GPUs [manufactured by TSMC]. In late 2019, Intel acquired AI chipmaker Habana Labs to accelerate its ongoing development of advanced AI technologies in an attempt to better compete with Nvidia in the AI space.
Additionally, both companies are building autonomous driving technologies. Nvidia has been developing its Drive platform, which includes hardware and software solutions for autonomous vehicles, while Intel remains the majority shareholder in Mobileye (MBLY) post its recent IPO. If you don’t know, Mobileye is a computer vision company that provides advanced driver assist (ADAS) and autonomous vehicle solutions to 50+ OEM partners.
Therefore, I think it is fair to say that Nvidia and Intel are direct competitors. While Nvidia and Intel have different strengths and focus on different market segments, both companies compete in areas such as data center computing, high-performance computing (HPC), and the emerging field of AI. Hence, in my view, a financial comparison between Nvidia and Intel makes sense.
NVDA and INTC Stock Key Metrics
Over the last twelve months, Intel and Nvidia have delivered revenues of $56.4B and $25.9B, respectively. While both of these semiconductor giants have been undergoing a painful revenue and earnings contraction over recent quarters, Nvidia is all set for a stunning recovery in 2023, whereas Intel is only expected to show a modest recovery in the back half of this year.
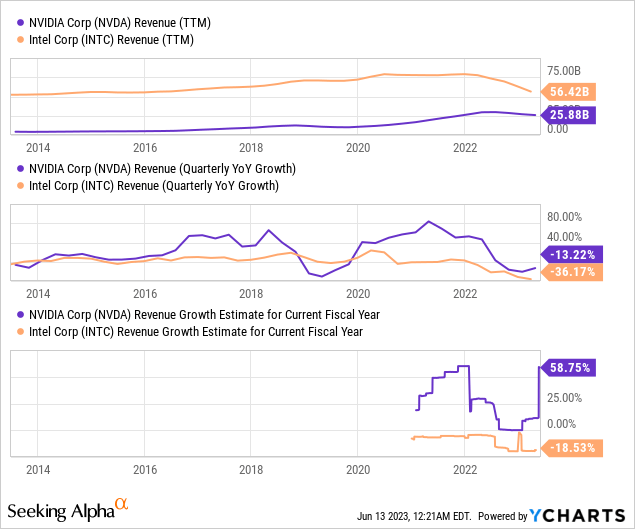
On the back of robust demand for its AI-centric GPU chips, Nvidia recently guided for Q2 revenues of $11B (64% y/y growth), obliterating street estimates of $7.2B! Clearly, Nvidia is benefiting from the generative AI wave. While Intel is also projected to see a modest recovery in the back half of 2023 and then resume positive growth next year, Nvidia’s future growth trajectory looks far superior as of now.
Author (Data from Seeking Alpha)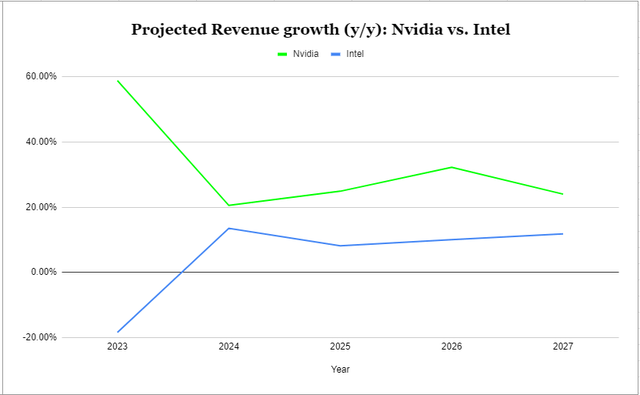
With Nvidia’s dominant position in accelerated computing, I believe Nvidia is likely to win a lot more than Intel in the era of generative AI. That said, Intel’s CPUs and Nvidia’s GPUs are often used together in systems that require both high single-thread performance and massive parallel processing capabilities. Also, by the look of things, Nvidia could soon become an Intel Foundry Services customer as it attempts to diversify its supply chain:
You know that we also manufacture with Samsung, and we’re open to manufacturing with Intel. Pat [Gelsinger] has said in the past that we’re evaluating the process, and we recently received the test chip results of their next-generation process, and the results look good.
– Jensen Huang, Nvidia’s CEO [Source: Toms Hardware].
Nvidia’s estimated TAM –> $1T (Nvidia Investor Day 2022) Intel’s estimated SAM –> $500B (IDC Report May 2023)
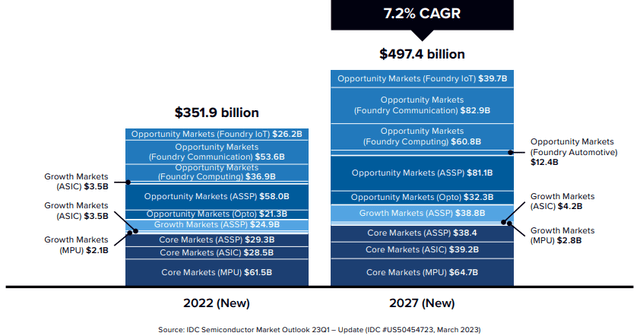
And with a humongous total addressable market, or TAM, on offer, I think both Nvidia and Intel could thrive side-by-side as businesses. According to consensus analyst estimates from Seeking Alpha, both Nvidia and Intel are set to grow at a healthy clip over the next five years. Now, as I said earlier, Nvidia is set to grow much faster than Intel, and it will likely eclipse Intel by revenue in 2025.
Author (Data from Seeking Alpha)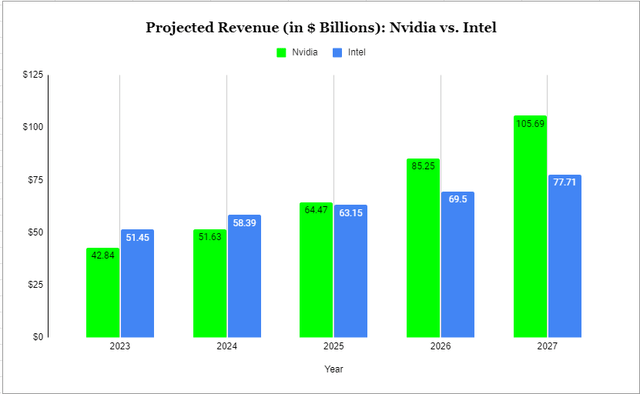
In addition to its superior growth trajectory, Nvidia commands far greater margins than Intel due to its dominance in the high-end GPU market. As you can see below, the gap between Nvidia’s and Intel’s margin profile has been growing wider in recent quarters. With Nvidia guiding for non-GAAP gross margin of 70% for Q2 2023, I think the gulf here is only going to widen in upcoming months. As Intel’s primary markets recover from the ongoing supply glut, I do see a gradual recovery in margins there.
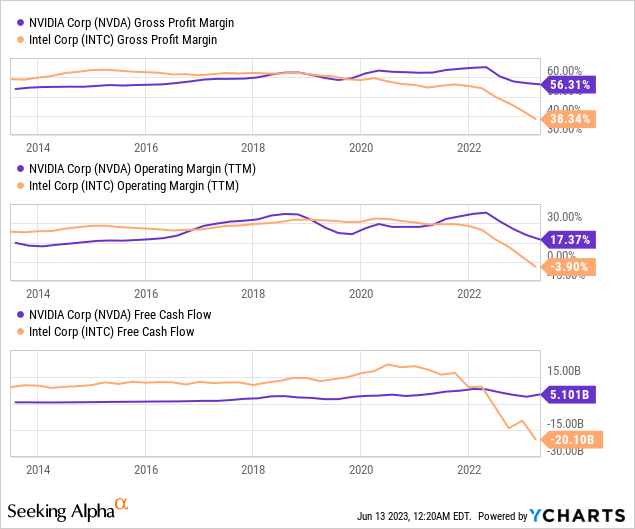
However, for now, Nvidia looks like a well-oiled free cash flow printing machine, whereas Intel appears to be a money-burning furnace due to its aggressive fab investments under the IDM 2.0 strategy. While Intel is still aiming for manufacturing process node leadership by 2025, I haven’t seen enough progress to believe in Pat’s lofty targets. Under his leadership, Intel’s financial performance has been poor, but if Intel can regain its technological leadership, the company could yet rebound to its former glory.
On paper, Nvidia’s stock looks extremely bubbly at ~40x P/S, especially in comparison to Intel’s stock, which is trading at ~2.5x P/S. However, if we consider forward earnings, Nvidia is currently cheaper than Intel (due to temporary earnings dislocation).
Author (Data from Seeking Alpha)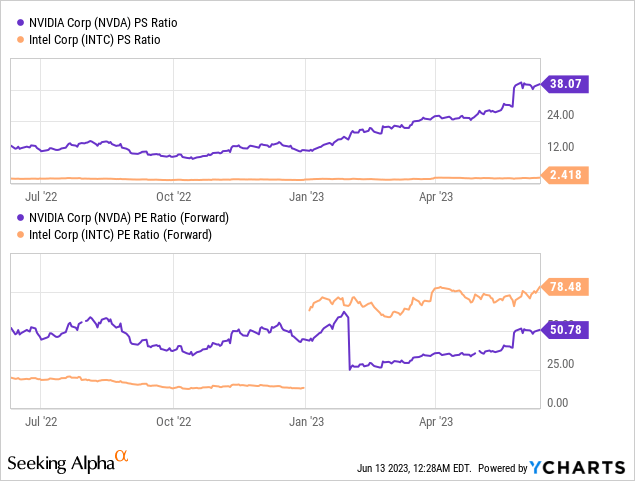
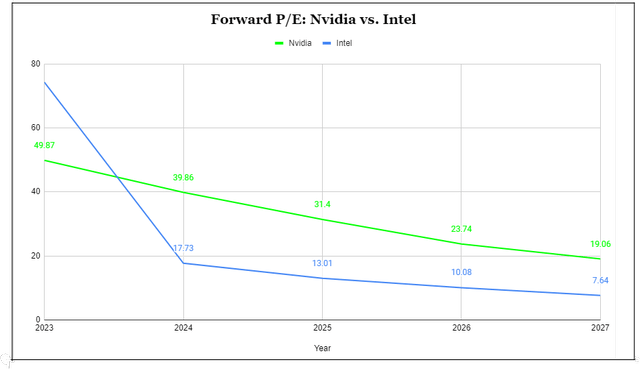
From a business standpoint, Nvidia is absolutely crushing it right now, whereas Intel is getting crushed! And I think the market is pricing these dynamics into NVDA and INTC stocks. However, Mr. Market may have swung too far in Nvidia’s direction after such a wild +200% YTD rally in NVDA stock. To see if this is the case, let us now review the absolute valuations for Nvidia and Intel.
Are These Stocks Fairly Valued?
1. Nvidia’s fair value and expected returns:
In light of Nvidia’s astonishing Q2 guidance and positive management commentary, I think Nvidia Corporation could clock $50B in revenue over the next twelve months. Given the seismic jump in near-term sales growth, we will be building the model based on this forward revenue estimate and then discounting the fair value output from the model to get a current fair value estimate.
Given Nvidia’s incredible pricing power and looming shift to a high-margin software business, I believe that steady-state free cash flow (“FCF”) margins for NVDA could be as high as 40-50%. And given the humongous total addressable market opportunity being unlocked by AI, Nvidia could realistically drive 20-30% growth per year beyond 2023.
All other assumptions are relatively straightforward. Please let me know if you have any questions via the comments section.
TQI Valuation Model (TQIG.org)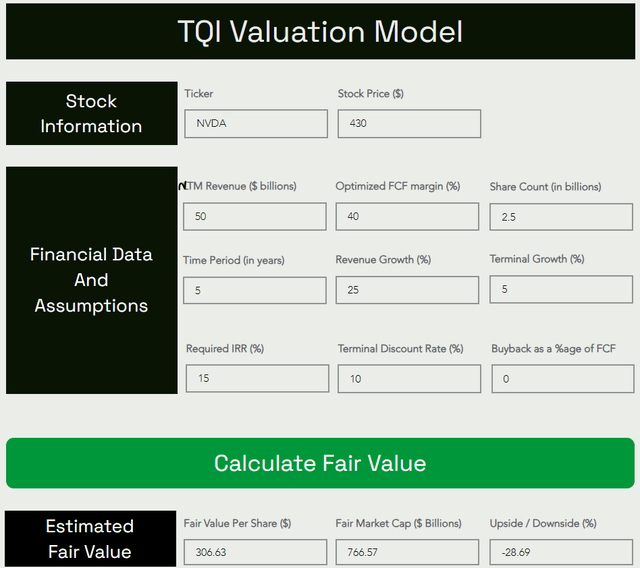
Applying a 15% discount to this 2024 fair value estimate, we get a current fair value estimate of ~$260 for NVDA stock. With Nvidia stock trading at $430 (at the time of writing), I continue to believe that the stock price is running way ahead of fundamentals at this moment in time.
That said, Nvidia Corporation’s risk/reward is not as terrible as I had estimated before. By 2028, I can see Nvidia rising to $610 per share at a CAGR rate of 7.3% based on an exit multiple of ~25x P/FCF.
TQI Valuation Model (TQIG.org)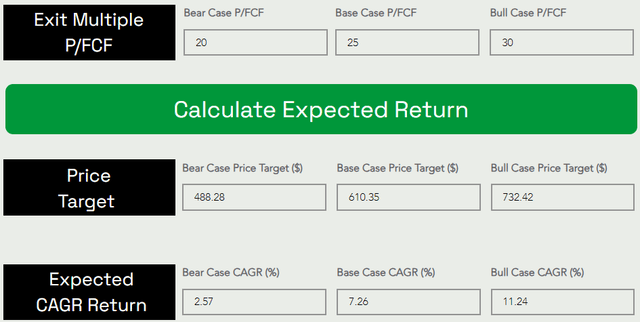
However, with NVDA’s expected returns falling short of my investment hurdle rate of 15% (despite generous modeling assumptions), I am still not a buyer of Nvidia stock.
2. Intel’s fair value and expected returns:
Just like in the case of Nvidia, we shall model Intel based on the next twelve-month revenues. All other assumptions are straightforward, but please let me know if you have any questions.
TQI Valuation Model (TQIG.org)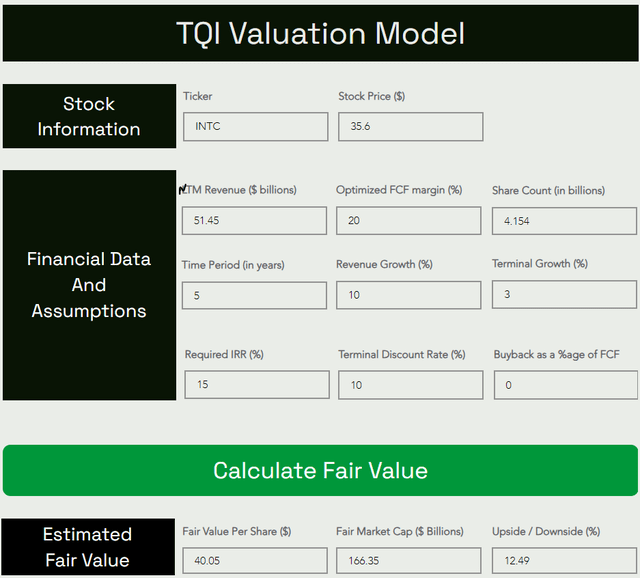
Applying a 15% discount to this 2024 fair value estimate, we get a current fair value estimate of ~$34 for INTC stock. Since Intel stock is trading at ~$35.6, it is slightly overvalued (but a lot more reasonable than Nvidia).
By 2028, I can see Intel rising to ~$60 per share at a CAGR rate of ~11% based on an exit multiple of ~15x P/FCF.
TQI Valuation Model (TQIG.org)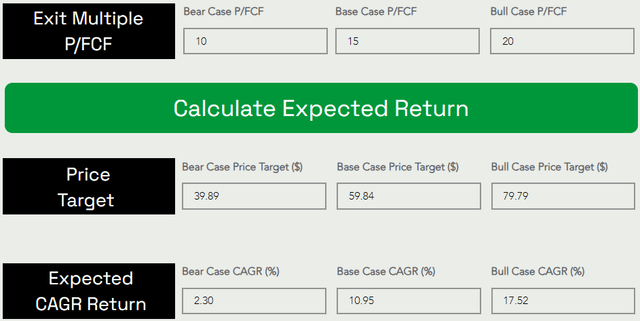
Since Intel falls short of my investment hurdle rate of 15%, I am not a buyer in INTC at current levels either.
Summary Table:
| Current stock price | TQI’s Fair Value Estimate | TQI’s 5-yr Price Target | TQI’s 5-yr Expected CAGR Return (%) | |
| Nvidia | $430 | $260 | $610.35 | 7.26% |
| Intel | $35.6 |
$34 |
$59.84 | 10.95% |
Is NVDA or INTC Stock A Better Buy?
From a valuation and risk/reward standpoint, neither Nvidia nor Intel is lucrative enough to be deemed a “Buy” at current levels. As of today, I rate both Nvidia and Intel “Hold/Neutral,” and SA’s Quant Rating system agrees with our assessment.
Author (Seeking Alpha Quant Ratings)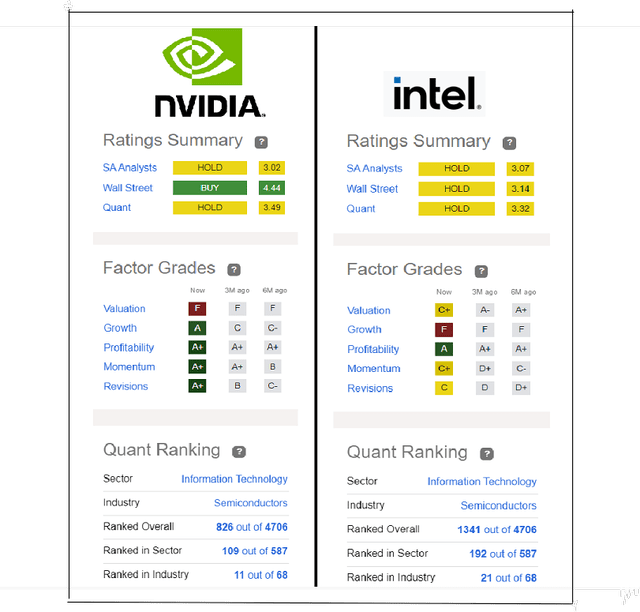
From a quant factor grade perspective, Nvidia looks far superior to Intel despite both companies getting a “Hold” rating, as the “Valuation” grade is the only negative spot for Nvidia. If Nvidia’s valuation corrects to a more fathomable level or improves with time, then NVDA stock could become interesting again.
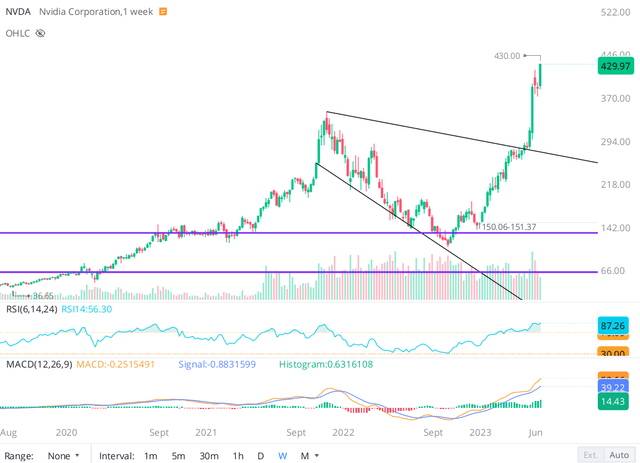
With Nvidia Corporation stock breaking out to new all-time highs in yesterday’s session, NVDA stock has no technical resistance for now. In recent weeks, Mr. Market seems to have turned valuation agnostic on AI-related equities, and investors are jumping into NVDA to play the AI rush, as it is the most obvious “picks and shovels” play out there today. In my view, the momentum could carry NVDA to crazy high levels beyond our wildest imaginations.
Conversely, we may form a blow-off top in the near future, given the wild ride-up in NVDA stock in 2023 and the fact that this stock is massively overbought from a technical standpoint. Any sort of reversal in the broader market could result in a significant pullback in NVDA stock.
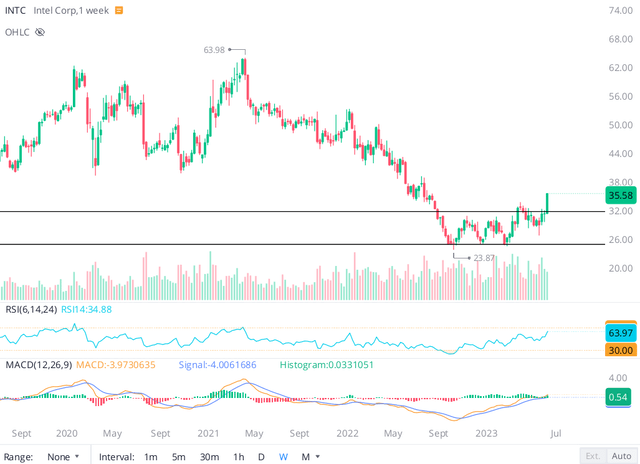
While Nvidia is flying high in the sky, Intel is just taking off, with the stock breaking out of a Stage-I base over the last few trading sessions.
Technically, Intel is not in overbought territory yet, and the stock may continue to head higher in the near term. If we do get a pullback here, the $30-32 level (upper trendline of Stage-I base) should serve as support for INTC stock.
Concluding Thoughts
Based on business fundamentals, Nvidia is clearly the better pick over Intel; however, once we factor in valuations, INTC stock seems to offer significantly better risk/reward than NVDA stock. As we noted in this report, Nvidia Corporation’s stock is running far ahead of its fundamentals, whereas Intel Corporation is only slightly overvalued. Furthermore, Intel’s 5-yr expected CAGR return of ~11% is far better than Nvidia’s 5-yr expected CAGR return of ~7%. From a quant factor grade standpoint, I prefer Nvidia over Intel despite both of them getting a “Hold” rating. Lastly, technical charts for both NVDA and INTC stock show more room for near-term upside; however, Nvidia is in overbought territory, and Intel is not!
Hence, if I had to buy one of these stocks today, I would go for Intel over Nvidia. Luckily, I don’t need to do that! For now, I am just going to remain on the sidelines on both of these names and wait for better entry points.
Key Takeaway: I rate both Nvidia and Intel “Neutral/Hold/Avoid” at current levels.
Thanks for reading, and happy investing! Please share your thoughts, questions, or concerns in the comments section below.
Analyst’s Disclosure: I/we have a beneficial long position in the shares of INTC either through stock ownership, options, or other derivatives. I wrote this article myself, and it expresses my own opinions. I am not receiving compensation for it (other than from Seeking Alpha). I have no business relationship with any company whose stock is mentioned in this article.
Seeking Alpha’s Disclosure: Past performance is no guarantee of future results. No recommendation or advice is being given as to whether any investment is suitable for a particular investor. Any views or opinions expressed above may not reflect those of Seeking Alpha as a whole. Seeking Alpha is not a licensed securities dealer, broker or US investment adviser or investment bank. Our analysts are third party authors that include both professional investors and individual investors who may not be licensed or certified by any institute or regulatory body.
Are you looking to upgrade your investing operations?
Your investing journey is unique, and so are your investment goals and risk tolerance levels. This is precisely why we designed our marketplace service – “The Quantamental Investor” – to help you build a robust investing operation that can fulfill (and exceed) your long-term financial goals.

We have recently reduced our subscription prices to make our community more accessible. TQI’s annual membership now costs only $480 (or $50 per month). New users can also avail of a special introductory pricing deal!

