Summary:
- NVIDIA’s current market price appears expensive compared to its intrinsic value, making it a potential sell for investors.
- To justify the current share price, NVIDIA’s sales growth must be at least 50% compounding and the adjusted operating margin must be at least 42.5% in perpetuity.
- The company’s focus on artificial intelligence and its transition from a GPU chip designer to an AI hardware and software business could drive future growth, but the current market price may not accurately reflect the risks and uncertainties associated with the business.
Justin Sullivan
Background
My primary investing process involves identifying high quality companies with sustainable competitive positions and buying them when their intrinsic value is at a discount from the market price. I adjust my holdings and start to progressively take profits when this discount is recognized by the market and the company becomes expensive.
I particularly look for high quality companies whose price is very volatile. My objective is to be able to “rinse and repeat” with companies that I understand reasonably well.
NVIDIA fits this criteria perfectly.
NVIDIA’s (NASDAQ:NVDA) price is heavily influenced by market sentiment and investors are often encouraged by management’s expansive view of the potential long-term market demand for NVIDIA’s products. This can see the stock’s price rise rapidly and often exceed the intrinsic value of the company by a significant margin.
Long term market watchers have seen this before and when the company fails to meet short term targets the inevitable price correction can be severe. The price can be driven well below the company’s intrinsic value thus providing investors with an opportunity to be able to “load up” again.
I update the intrinsic value of my target companies on an annual basis or when there is a significant change in the company’s market position.
My 2022 valuation can be found here.
What has happened since the last update?
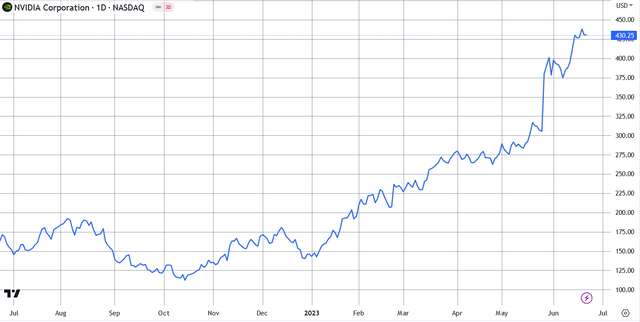
Let’s look at the price action on the following chart:
When I value NVIDIA in June 2022 I found that the price was higher than my intrinsic value of $137. My advice to existing investors at the time was to HOLD and my advice to those looking to invest was to wait for a cheaper price. I formed the view that I thought that the price could go lower and provide a better opportunity.
This advice proved to be prudent and the price got as low as $111 in October 2022.
It’s now time to update my intrinsic value for NVIDIA.
Company Description
NVIDIA Corporation (NVDA) is a US based multinational technology company. It is thought that NVIDIA is the technology leader in the design of graphics processing units (GPU’s). These semiconductor chips are used in several end-markets including high-end PC’s for gaming, data centers, mobile computing and auto infotainment systems. Over the last few years the company has been expanding its markets into artificial intelligence and autonomous vehicles. NVIDIA is currently the largest semiconductor company globally by market capitalization.
NVIDIA purely designs, markets and sells its products. It does not directly manufacture semiconductors. It operates a so-called “fabless” model where it contracts 3rd parties to perform the various manufacturing steps to get its products to market. The key step of manufacturing the semiconductor wafers is performed both by Taiwan Semiconductor Manufacturing Company (TSMC) and Samsung Electronics.
NVIDIA’s key markets include:
- Gaming.
- Professional visualization.
- Data Centre.
- Automotive.
The company currently has 2 reportable operating segments and the 2023 full year sales and margins are shown in the table below:
Author’s compilation using data from NVIDIA’s 2023 10-K filing.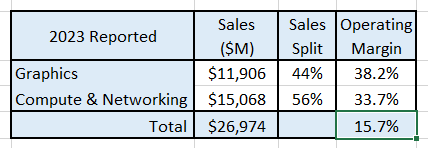
Business Overview
Global demand for semiconductors has been in a long-term secular upswing as shown by the following chart:
Author’s compilation using data sourced from Statista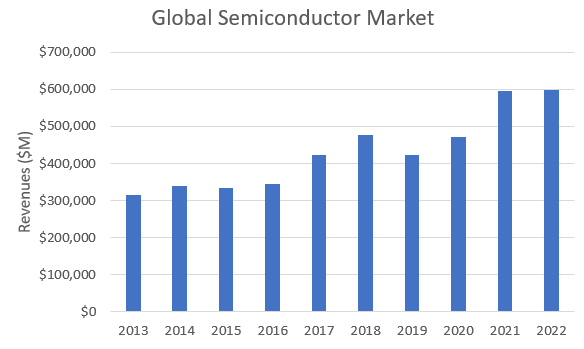
The key takeaways from the chart are:
- The semiconductor market is cyclical.
- Demand is heavily influenced by the health of the global economy and downturns can be quite severe.
- The compound annual market growth rate over the last 10 years was 7%.
There is often conjecture amongst market participants about the exact size of their market. The semiconductor sector is no different. Although there can be arguments about the exact size of the market, investors should perhaps focus on the near term forecasts for market timing opportunities and for the expected medium term rate of change in market size for longer term investing.
The semiconductor sector’s trade association (World Semiconductor Trade Statistics) comprises 42 member companies. It publishes historical market data, and each quarter provides a global market forecast.
The WSTS’ current forecast for 2023 is for a 10% decline in global revenues compared to the previous year but they expect the market to bounce back in 2024 by 12%.
The key issue here is will a near-term decline in revenues be a catalyst for a market correction for this sector?
NVIDIA’s Addressable Market
NVIDIA’s product portfolio is a subset of the total semiconductor market. It markets 3 types of devices – DPU, CPU and GPU.
GPU’s are used for accelerated computing, CPU’s for general purpose computing and DPU’s are used for data processing and for moving data around data centers.
NVIDIA has a history of being very expansive in projecting the size of its addressable market. Their latest update claims that the potential addressable market into the future is $1 Trillion in size as shown in the following chart:
NVIDA Investor Presentation, Feb 2023.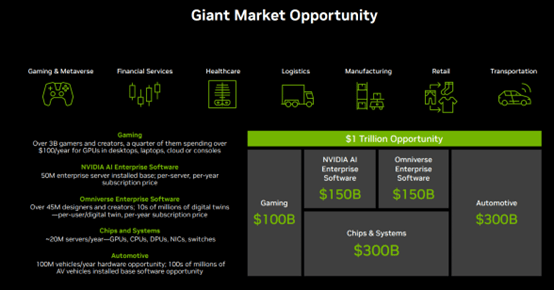
NVIDIA offers no time-frame for when this opportunity will come to fruition.
It should be noted that NVIDIA’s competitors are far more circumspect with their market forecasts. Intel (INTC) recently engaged industry consultants IDC to develop a forecast for the size of its addressable market. IDC concluded that by 2027 Intel’s addressable market will be nearly $500 B in size and that the current market will grow by 7.2% per year for the next 5 years.
I recognize that Intel’s business is quite different to NVIDIA but nevertheless their target markets are almost the same.
NVIDIA’s Strategy
NVIDIA built its business by developing the best graphics processing units predominantly used by the PC-based gaming market and then expanding its application into other markets. At the core of NVIDIA’s strategy is the focus on product innovation through research and development.
NVIDIA’s reinvestment (a combination of R&D expenditure, capital spending and acquisitions) into its business has been substantial as shown in the following chart:
Author’s compilation using data from NVIDIA’s 10-K filings.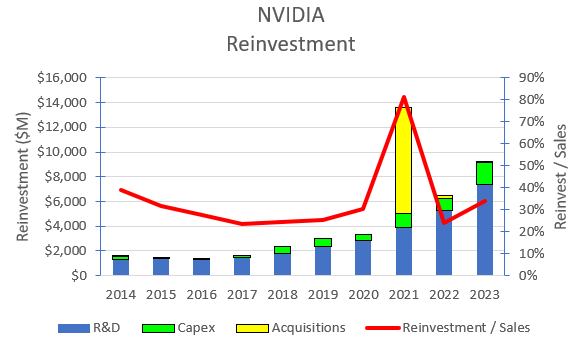
NVIDIA has maintained an average Reinvestment to Sales ratio of 36% for the last 10 years (if acquisitions are excluded this ratio falls to 29%). This ratio compares favorably with other leading technology companies as shown in the following table:
Author’s compilation using data sourced from GuruFocus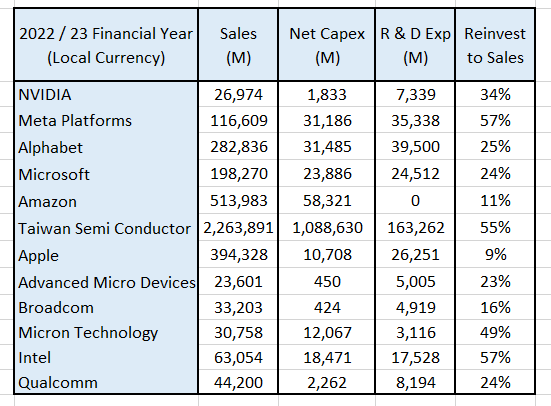
This table was constructed by classifying reinvestment as the sum of expensed Research & Development plus net capital expenditure for the most recent financial year.
The output of NVIDIA’s research and development has been several hundred patents which have been used to develop new markets for its innovations. NVIDIA has focused on products where it can deliver dramatically improved performance relative to its competitors. This has enabled NVIDIA to expand from the relatively mature gaming and visualization markets into the expected higher growth / high performance computing markets such as Data Centers and Automotive which have a growing focus on Artificial Intelligence.
The success of NVIDIA’s approach can be seen in the following chart which shows the company’s historical revenues by end market:
Author’s compilation using data from NVIDIA’s 10-K filings.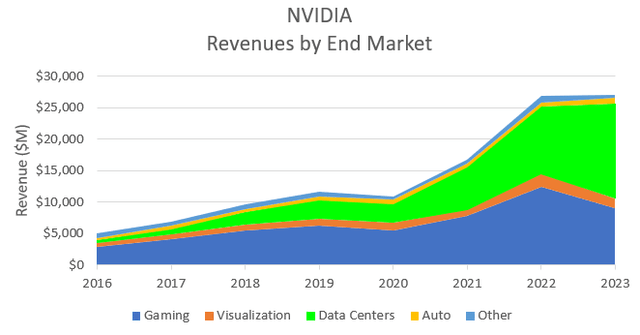
NVIDIA’s Data Centre exposure increased significantly following the acquisition of Mellanox Technologies in April 2020 (annualised revenue of approximately $1,600 M).
At the end of the 2022 financial year, for the first time, Data Centre revenues exceeded Gaming revenues. This marked an important strategic evolution for NVIDIA as the company started to focus on its next growth phase which is expected to be dominated by AI applications.
The financial year just ended (January 2023) saw significant declines in NVIDIA’s Gaming segment revenues. Quarterly data indicates that the Gaming segment’s revenue growth peaked in January 2021 and growth has been declining ever since.. There is conjecture about the cause of this decline but it appears to be related to the decline in the price of cryptocurrencies and it certainly suggests that there is a strong relationship between Gaming revenues and the popularity of cryptocurrencies.
NVIDIA’s focus on Artificial Intelligence will drive its future strategy.
NVIDIA’s strategy is to dominate the AI market. The opportunity presented by AI will enable the company to transition from being a GPU chip designer business to an AI hardware and software business.
NVIDIA has created a full suite of AI products which includes hardware, software (or operating system) and AI implementation skills (consulting).
This strategy transition is shown in the following chart:
NVIDIA’s Investor Day presentation, March 2022.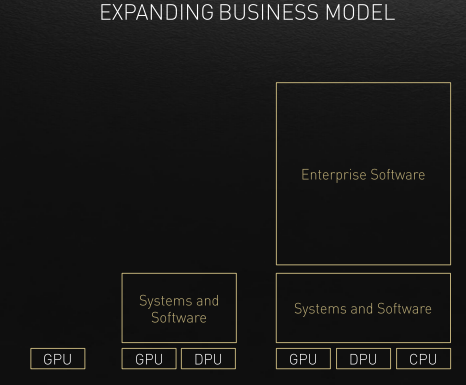
In the new business model, software revenues become the biggest long term opportunity because they potentially represent multiples of hardware revenues. Software revenues are more “sticky” than one-off hardware revenues as they include annual licenses and subscriptions. This may also allow the potential expansion of margins (particularly gross margins) as software margins are typically much higher than hardware margins.
NVIDIA’s Historical Financial Performance
NVIDIA’s historical revenues and adjusted operating margins are shown in the chart below:
Author’s compilation using data from NVIDIA’s 10-K filings.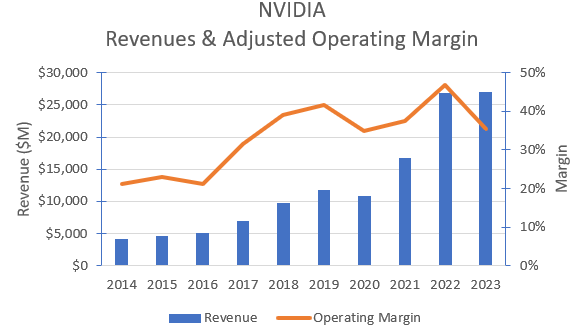
The operating margin has been adjusted for the impact of:
- One-off extraordinary expenses.
- Operating leases (converting the lease payments to debt and depreciation).
- Expensing of Research & Development (this expense has been converted back to a capital investment and a notional Research & Development asset was created with a 5-year expected life).
The adjusted operating margin declined in the most recent year due to an inventory charge related to the lower demand for product primarily from the Gaming segment. NVIDIA appears to have off-take agreements with its main suppliers and the lower product demand triggered the penalty provisions in these agreements.
In Q1 of the current year NVIDIA’s operating margin has recovered back to historical levels.
In this sector a company’s operating margin is predominantly driven by its gross margin. I estimate that NVIDIA’s margins are in the highest decile for the sector as can be seen in the following sector snapshot:
Author’s compilation using data from company 10-K filings.
Note that NVIDIA’s end of financial year is in January whilst the majority of the other companies tend to be later in the year.
My conclusions about the volatility in the data are:
- higher gross margins are generally driven by pricing (particularly by Taiwan Semiconductor and NVIDIA).
- lower gross margins are generally driven by inventory adjustments (lower than expected volumes), poor efficiencies and higher amortization charges.
The key question is whether high gross margins can be sustained over the long term?
NVIDIA’s strong competitive position comes from its superior technology and know-how which is protected through numerous patents. Of course, they do not have the market all to themselves. There are competitors who currently produce relatively inferior products in areas where performance is important. Although not necessarily a consumer brand, the NVIDIA brand is well regarded in the markets who value their products.
The strength of NVIDIA’s competitive position can be estimated by its return on invested capital which is shown in the chart below:
Author’s compilation using data from NVIDIA’s 10-K filings.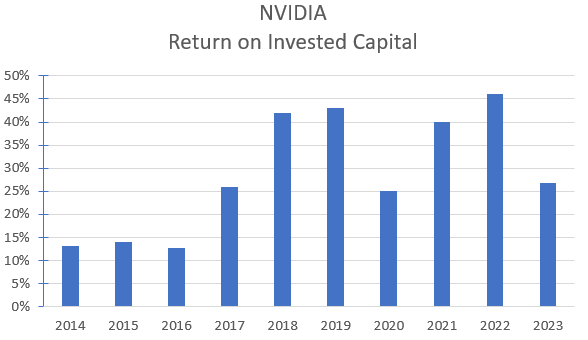
NVIDIA’s ROIC is quite volatile due to the volatility in its underlying operating earnings.
It should be noted that NVIDIA pays a relatively low rate of effective tax on its income and this helps to artificially increase the ROIC. Over the last 10 years NVIDIA has paid an average effective tax rate of approximately 7%. There are several reasons for this low rate:
- 70% of sales are outside of the US in countries where tax rates are generally lower (or zero).
- NVIDIA gains significant tax benefits on its US R & D investments.
The low effective tax rate coupled to NVIDIA’s high operating margins (generated by their fabless model and the ability to generate higher prices for their products because of their superior performance) means that NVIDIA generates a high return on invested capital.
I estimate that the current return on invested capital is in the highest decile for the sector.
NVIDIA’s high and sustained return on invested capital is a clear indication that its competitive position is currently reasonably strong and should remain that way for some time provided that its research and development investments continue to produce market leading products.
NVIDIA’s Capital Structure
I have no significant concerns over NVIDIA’s current capital structure. The following chart shows the shift in the mix of its debt and equity over time:
Author’s compilation using data from NVIDIA’s 10-K filings.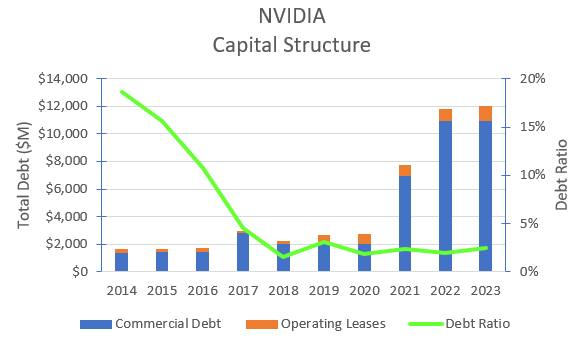
It should be noted that this is not a net debt discussion.
NVIDIA increased its debt to fund the acquisition of Mellanox Technologies (the transaction took place in 2019) and it was increased again during 2021 (NVIDIA was positioning to acquire Arm Limited).
The Arm acquisition did not proceed due to anti-competitive concerns raised by both customers and competitors and as a result the additional debt was used to buy back shares.
NVIDIA’s debt ratio is reasonably typical for a company in the semiconductor sector.
NVIDIA’s Cash Flows
The following table summarizes NVIDIA’s restated cash flows over the last 10 years:
Author’s compilation using data from NVIDIA’s 10-K filings.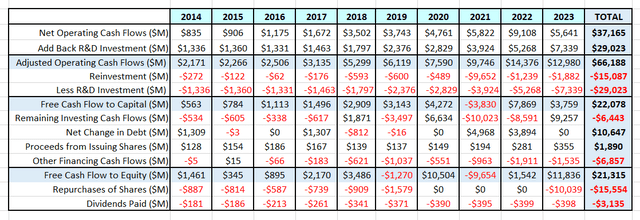
Note that I have made some adjustments to the published Cash Flow Statements. I have moved the R & D expenses to the investing section of the cash flow statement to better reflect the true sources and uses of cash.
Prior to the acquisition of Mellanox Technologies, NVIDIA regularly used its excess cash to fund share buybacks. Last year NVIDIA restarted its buybacks after a 3-year hiatus. Providing that there are no significant acquisitions in the future, I see no reason why the buybacks should not continue.
NVIDIA is not a large generator of free cash flow after reinvestment compared to some of the other leading technology companies as shown in the following table:
Author’s compilation using data from each company’s 10-K filings.
The table was constructed by summing the last 10 years of financial data. It indicates that although NVIDIA is a high margin business (high operating cash flow to sale ratio) it has the highest reinvestment ratio within the group therefore it generates the lowest free cash ratio.
These are important issues in assessing the value of a company.
Key Risks Facing NVIDIA
I see three key long term risks facing NVIDIA:
- NVIDIA’s research and development investments fail to sustain its technology leadership which would allow competitors to gain a larger share of the market. China / US relationship – approximately 21% of NVIDIA’s revenues come from the Chinese market (it has been higher). A long-term dispute between China and the US would have a significant near-term impact on revenues.
- NVIDIA’s “fabless” operating model exposes the company to several supply chain risks including margin compression and potential production capacity constraints. NVIDIA is very dependent upon good relationships with its two major suppliers Taiwan Semiconductor and Samsung.
- The geo-political tensions between China and Taiwan are a major concern and NVIDIA’s business would be severely impacted if China threatened the safety of Taiwan.
My Investment Thesis for NVIDIA
I last valued NVIDIA a year ago (my mid-point value was $136 and the market price at the time was $162). My investment thesis at that time was for NVIDIA to complete the transition from being a gaming and data center GPU technology supplier to becoming an AI / business enterprise software technology supplier over the life of the valuation.
My thesis a year ago assumed that NVIDA would grow its total revenues by 23% per year for 6 years and margins would continue to increase due to the higher proportion of revenues coming from software and not hardware.
My updated thesis now has NVIDIA growing its revenues by 28% per year for the next 6 years (as a result of increased demand from Data Centre customers). Based on NVIDIA’s current end-use definitions the following table summarizes my new revenue projections for each segment in 10 years’ time. I have also included my estimate of each segment’s growth rate for the next 6 years:
Author’s end-use revenue forecast.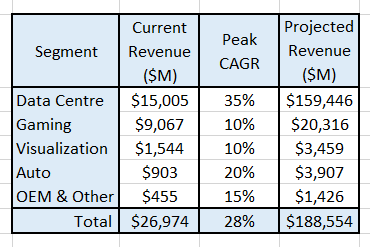
Over the last couple of years NVIDIA has been able to increase its underlying gross margin and operating margin (probably as a result of its product mix change). I think that these margins are sustainable therefore I expect that NVIDIA’s typical gross margins will settle around 65%, which would be in the highest decile for the sector. Adjusted operating margins, which are currently on average around 40% will remain at these levels for the foreseeable future. This is also a change from my previous forecast of 35%.
I have not modeled for any major interruptions to the foundry market, but I suspect that the political tensions between China and Taiwan may increase over time. If this impacted the output of Taiwan Semiconductor Manufacturing Company, it would have major ramifications for NVIDIA.
By traditional measures NVIDIA appears to require relatively little reinvestment to generate its revenues. This is because NVIDIA’s largest reinvestment, research and development, is expensed. Once we reorganize NVIDIA’s financial statements to better reflect research and development as an investment then we get a clearer picture of the level of reinvestment that is required to support this business. As a result of NVIDIA’s innovation strategy, I expect that current reinvestment levels will have to be maintained into the future
In summary I am projecting a very bullish market outcome.
Key Inputs into NVIDIA’s Valuation
The assumptions from the investment thesis are then summarized into the following inputs for the valuation model:
Author’s key valuation model inputs.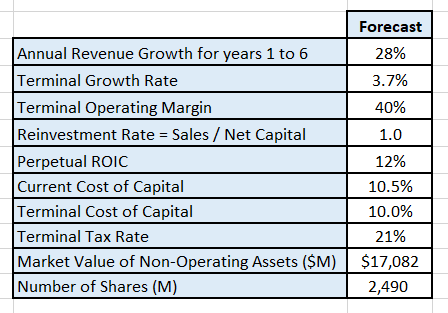
There are 2 important discussion points associated with the valuation inputs:
- Cost of Capital – NVIDIA has a relatively high cost of capital compared to the average US company due to its low debt ratio and because of the high unlevered beta for the semiconductor sector. I think that the higher cost of capital is appropriate for the underlying business risks (in revenue growth and the macro uncertainty associated with its supply chain).
- Terminal tax rate – I have assumed that NVIDIA’s effective tax rate will increase over time and be at least commensurate with the US marginal tax rate.
Discounted Cash Flow
A Free Cash Flow to the Firm approach is used with a 3-stage model (high growth, declining growth and maturity). The model only seeks to value the cash flow of the operating assets. The valuation has been performed in $USD.
The output from my DCF model is:
Author’s model output. Author’s model output.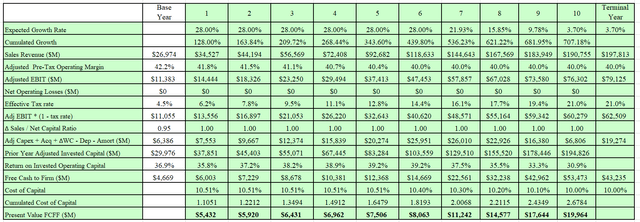
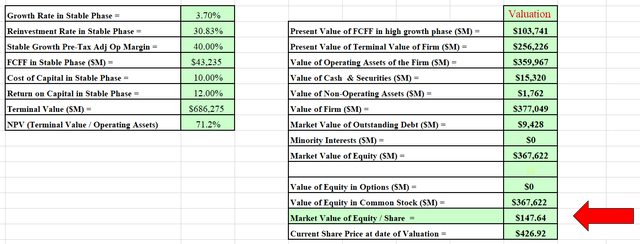
I have also developed a Monte Carlo simulation for the valuation based on the range of inputs for the valuation. The output of the simulation was developed after 100,000 iterations.
Author’s Monte Carlo simulation output.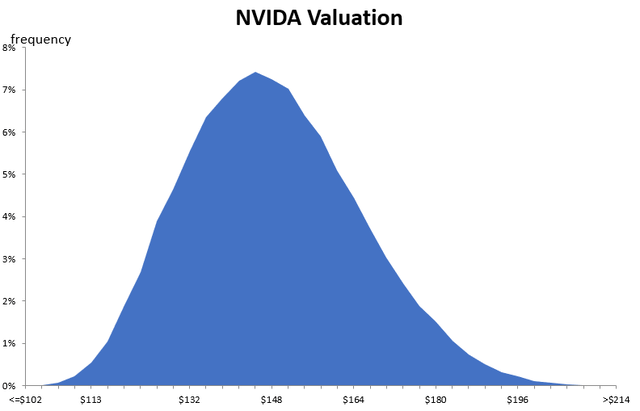
The Monte Carlo simulation not only indicates the extremes of the valuation, but it can also be used to help understand the major sources of valuation sensitivity.
The greatest source of uncertainty in the NVIDIA valuation is the expected revenue growth. I have modeled a growth rate of 28% ± 5% and this accounts for 75% of the spread in the valuation.
The simulation indicates that at a long-term discount rate of 10%, the valuation for NVIDIA’s equity per share is between $102 and $214 per share with an expected value of $148.
Inputs Required to Justify Current Market Price
To test what inputs would be required to justify NVIDIA’s current market price ($426) I have constructed the following table which shows the resulting valuation if either the terminal adjusted operating margin or the expected sales growth were changed:
Author’s reverse engineered valuation model.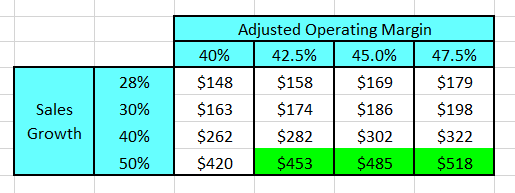
The table indicates that to justify the current share price, NVIDIA’s sales growth for the next 6 years must be at least 50% per year and the adjusted operating margin must be at least 42.5% in perpetuity.
Given that NVIDIA’s adjusted operating margin exceeded 42.5% in 2022, I think that it is possible that margins could remain above 42.5% particularly if NVIDIA can sustain its technical superiority.
Now thinking about NVIDIA’s sales forecast. I have currently projected that NVIDIA’s sales growth will be between 23% to 33% each year for the next 6 years.
To justify the current share price, sales revenue must almost be double my estimate. This means that NVIDIA’s sales revenue in 10 years’ time would be approximately $644 B.
Based on the current market size estimates, NVIDIA has an almost 50% share of its current addressable market. Earlier in the report I indicated the long-term estimate for the market’s size is between $500 B (IDC’s estimate) and $1,000 B (NVIDIA’s estimate).
In order to justify the current share price, NVIDIA’s estimate for the future size of the market needs to be correct and NVIDIA needs to hold a market share above 60% in this expanded market.
I think that it is unlikely that NVIDIA’s optimistic forecast will prove to be correct and for this reason I conclude that NVIDIA currently appears to be expensive relative to its intrinsic value.
Final Recommendation
Readers of this report are reminded that an investment is nothing more but a claim to the future cash flows that the investment is expected to generate over time.
It is not overly complex to develop a range of cash flow scenarios for any particular investment. In the case of an equity – all that is required is a forecast for revenues, margins and the reinvestment required to support the business. The resulting cash flow forecasts then need to be discounted back to the present time using a discount factor which takes into account the risks or uncertainty associated with the forecasts.
I have provided readers with an insight into how to reverse engineer NVIDIA’s current share price back to the inputs required to generate the necessary cash flows. Readers should then be able to draw their own conclusions about whether the current share price is reasonable based on the business fundamentals.
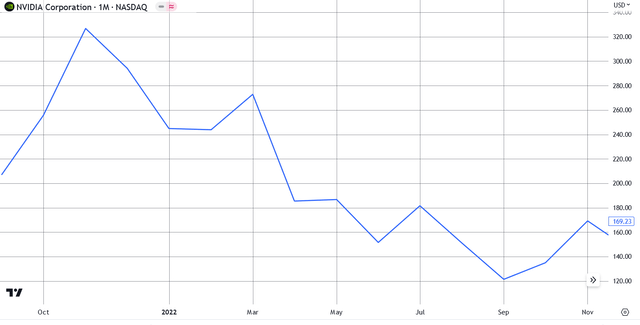
NVIDIA has been a wonderful long-term investment for those shareholders who have ridden the volatility of the stock price. I estimate that a 5-year investor has enjoyed returns of 45% per year. However, timing is important. The stock has had periods of significant draw-downs as shown below:
The stock price in November 2021 reached $329 before falling to $113 by October 2022.
I suspect that we may be entering another period where the risks of ownership may outweigh any potential near-term benefits.
Is NVIDIA currently a buy, hold or sell?
Based on my analysis I think that NVIDIA appears to be expensive at the current market price and I would not recommend purchasing stock at these prices. I think that NVIDIA is currently a SELL (or at least a TRIM).
I am a believer in the NVIDIA story but only at the right price. I think that current holders of NVIDIA should be making careful assessments about their allocation to the stock in their portfolio and making sure that their exposure is commensurate with good risk management practices.
Is NVIDIA a short?
I do run a long / short book but the experience it is not for everybody and it can be painful. In order to be successful the short investor must not only get the direction correct but must also get the timing correct. This can prove to be very difficult and expensive.
For this reason one of my risk management rules is not to short individual companies but to only short sectors. I am reasonably confident that the NVIDIA price will decline significant but my “crystal ball” is very cloudy about the timing for this to happen. For this reason I am not a short seller of NVIDIA.
Analyst’s Disclosure: I/we have no stock, option or similar derivative position in any of the companies mentioned, and no plans to initiate any such positions within the next 72 hours. I wrote this article myself, and it expresses my own opinions. I am not receiving compensation for it (other than from Seeking Alpha). I have no business relationship with any company whose stock is mentioned in this article.
Seeking Alpha’s Disclosure: Past performance is no guarantee of future results. No recommendation or advice is being given as to whether any investment is suitable for a particular investor. Any views or opinions expressed above may not reflect those of Seeking Alpha as a whole. Seeking Alpha is not a licensed securities dealer, broker or US investment adviser or investment bank. Our analysts are third party authors that include both professional investors and individual investors who may not be licensed or certified by any institute or regulatory body.

