Summary:
- The market is heavily invested in generative AI technology as the next big thing.
- The recession will put everything in its place.
- Nvidia Corporation’s valuation is very hard to justify.
Veni vidi…shoot
Main thesis
Nvidia Corporation (NASDAQ:NVDA) shares have been straight-up flying this year, almost tripling in six months.
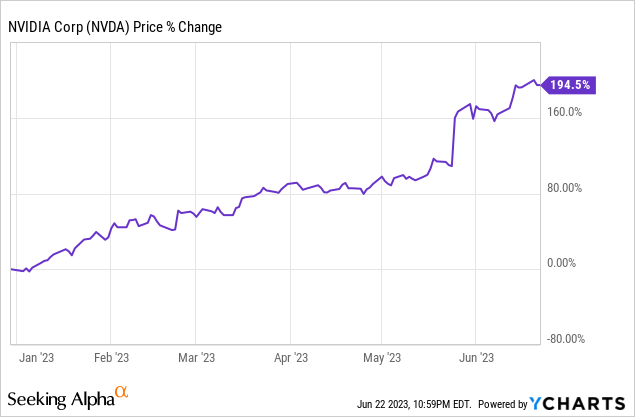
The market is still ruled by an AI (artificial intelligence) mania centered on the leader in the GPU market. And while the rally still looks strong and buoyant, I don’t believe it can continue because it’s the standard “market trends vs common sense” story and the current environment is not one in which a massive bubble could inflate.
So, here are three reasons why I think Nvidia’s insane rally is coming to a logical end:
Reason 1: AI is a baby bubble and the Fed’s going to pop it
There has been a debate for over a decade on what will be the next big thing for the global economy after the advent of the Internet in the 1970s and smartphones in the 2000s and will be the basis of a new technology cycle. Well, it looks like the market participants are “all in” the generative AI idea.
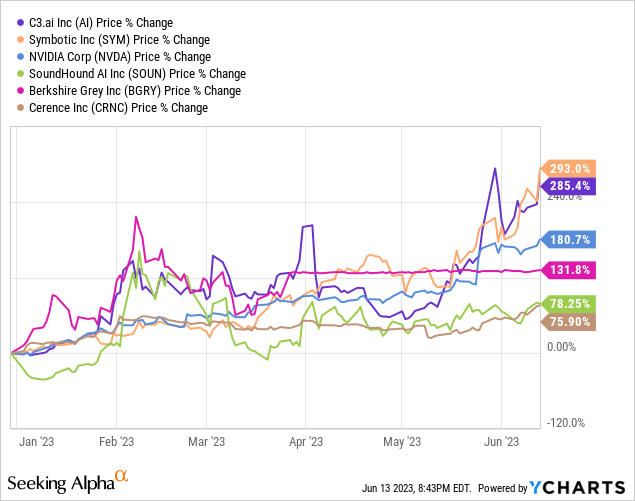
A set of companies operating in the field of generative AI has generated triple-digit returns this year. This crazy spark in asset prices is not supported by almost any financial results, everything is accelerated solely by the hype around the technology.
The media is blowing up the hype at an incredible pace and the corporations love it. The number of AI-related online articles has soared by 5 times since the end of 2022.
Bloomberg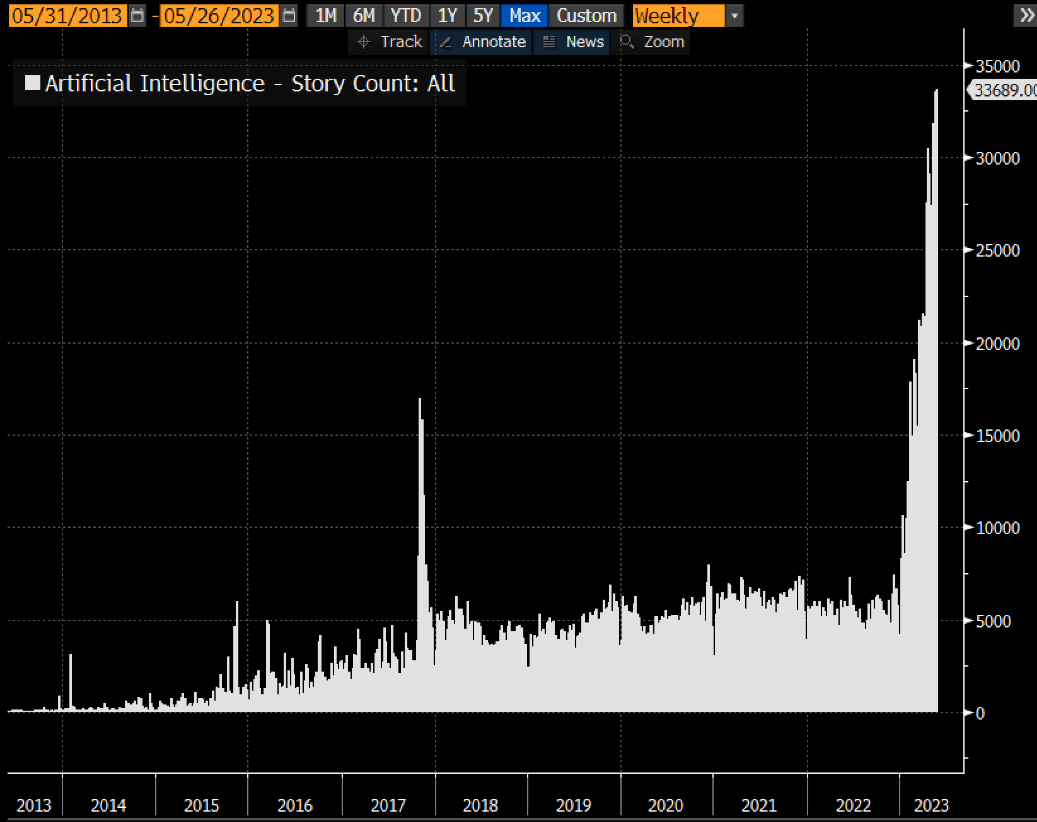
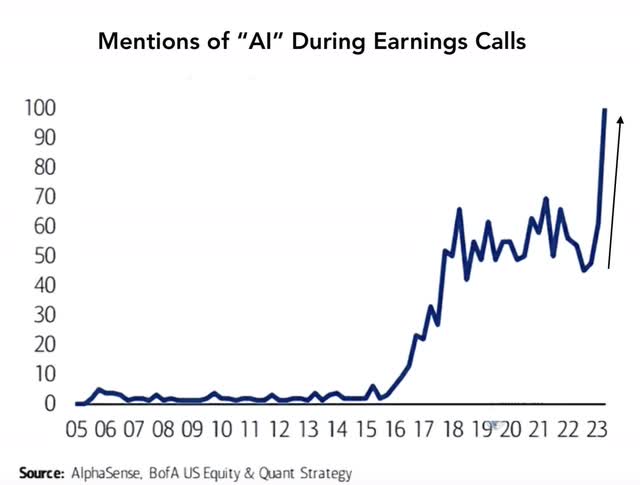
Management fuels the interest of investors. There were 1070 mentions of AI during Q1 earnings calls.
The exception of this madness is that the bubble inflates amid high Fed rates. All known bubbles in history were inflated precisely during the soft policy of the regulator. As we know, the Fed’s hiking cycle tends to always break something and AI mania is going to fall flat, in my opinion, as the system starts to feel real troubles like the cracks in the financial sector.
soundmindinvesting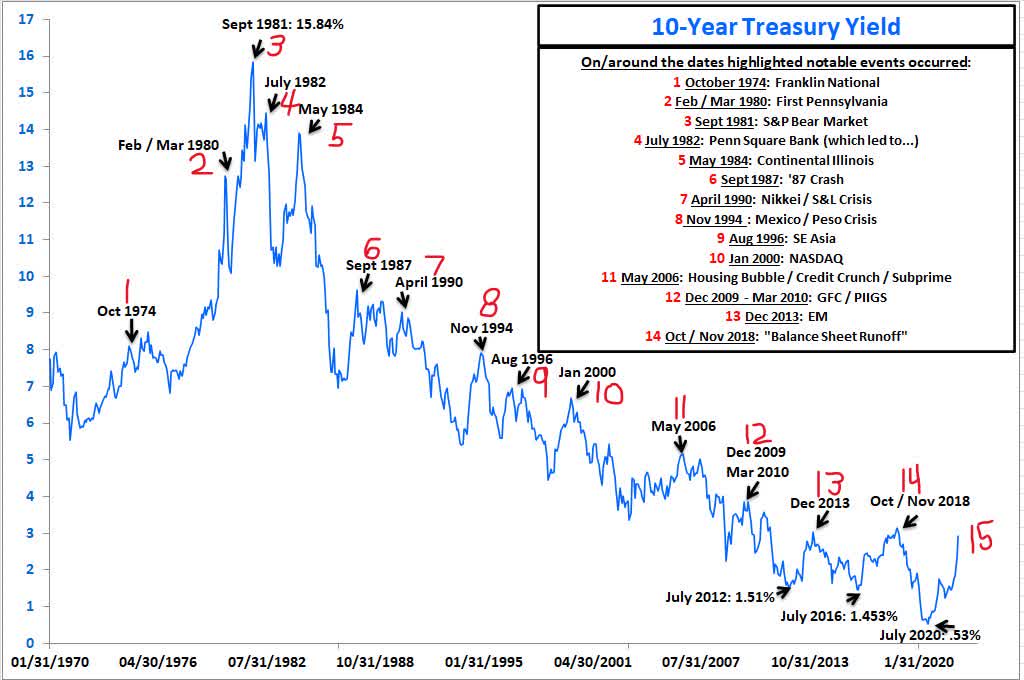
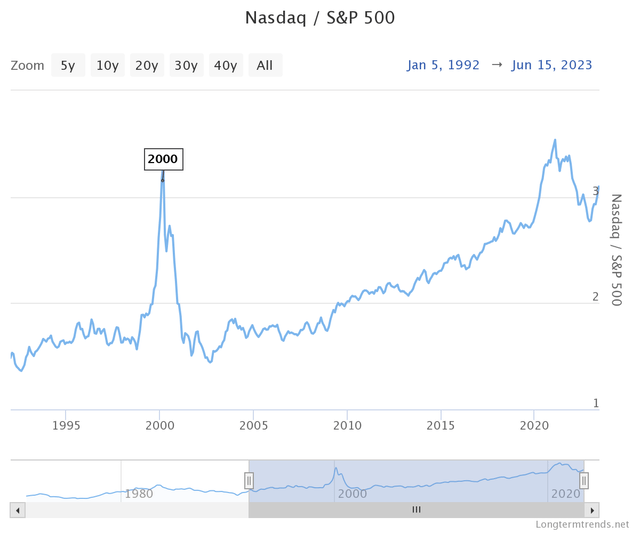
And yeah, there are things to break. The NASDAQ/S&P 500 ratio is back at >3x, thanks to the AI euphoria. The level that was only seen in 2000, when the dot-com bubble popped, and in 2021. Techs are still way overvalued compared to the rest of the market. I don’t think the current environment will allow this baby bubble to inflate into an adult one.
Reason 2:The recession factor
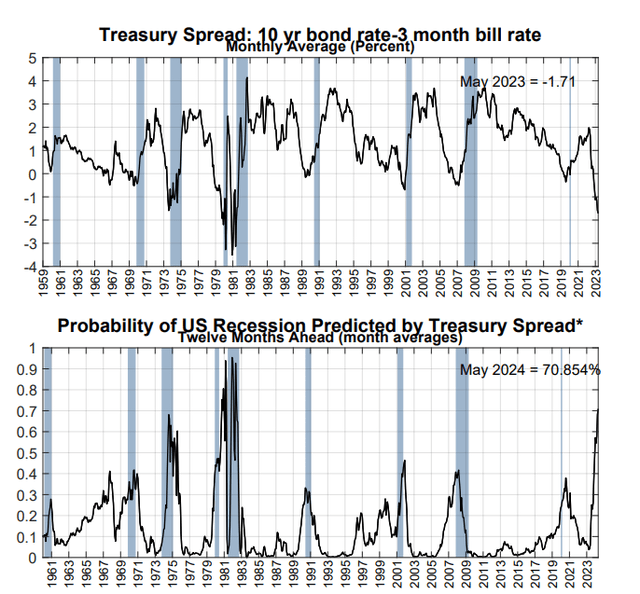
The fact that a prolonged recession will occur in the near future, to my surprise, is still in question among some analysts. The deeply inverted 3M10Y treasury spread actually speaks of the full confidence of the debt market in the coming storm.
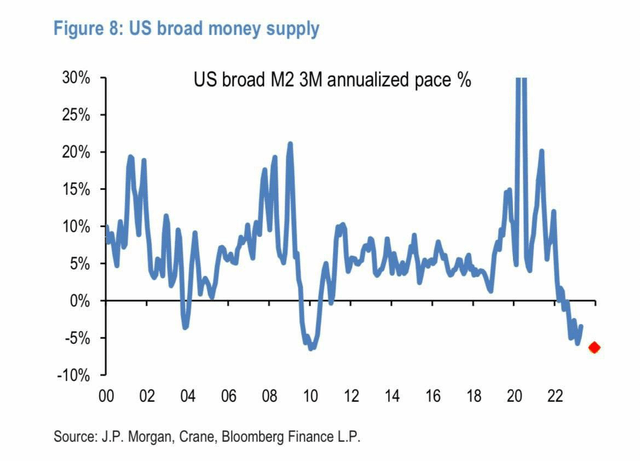
M2 continues to decline at an incredible pace, almost on par with 2008 levels.
Elevated inventory levels, problems in the CRE market, accumulated losses in the financial sector, dwindling savings from consumers, and other red flags prevent from maintaining a positive outlook on economic growth.
It is important to understand that the recession risk is not a structural risk for Nvidia.
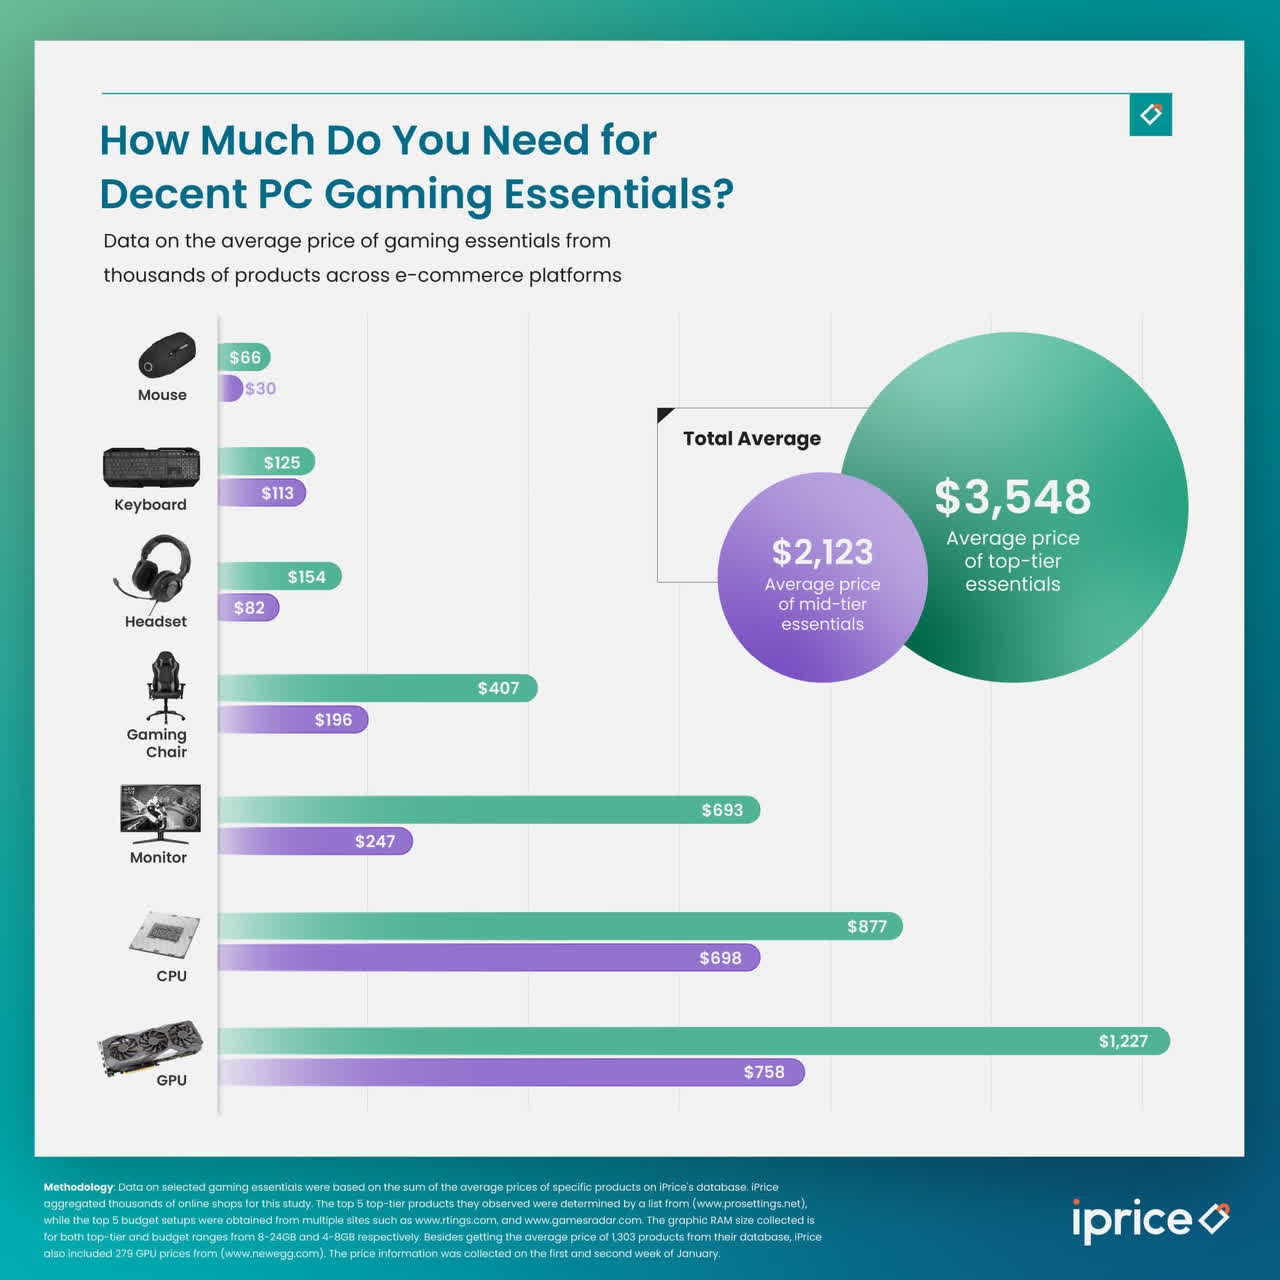
The gaming segment is under a massive risk as it directly depends on the well-being of the consumer. The gaming experience has become more and more expensive over the years. The main component of the price rise was the GPU and Nvidia became the main beneficiary.
With the overall decline in consumer spending, spending on flagship graphics cards will fall faster than most non-essential goods. The consumer can also get a good performance on lighter versions. At the same time, the consumer can easily choose a non-flagship model, since Nvidia products do not have such brand strength. Thus, it would be logical to expect a drop in demand for the company’s most marginal products, which will continue to put pressure on the segment’s revenue.
tomshardware.com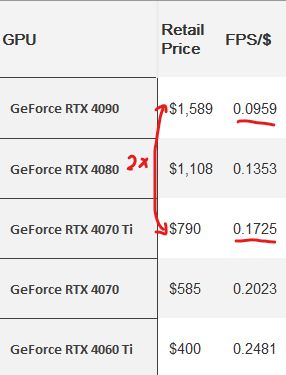
Nvidia raised its guidance to $11 billion for the next quarter, primarily citing strong momentum in the data center segment. Given the simply incredible growth in the company’s capitalization to historical highs since the beginning of the year, market participants also expect explosive growth in the segment, since, in fact, no other new growth drivers, except for AI, have appeared. Analysts raised their estimates massively for the next years.
Quatr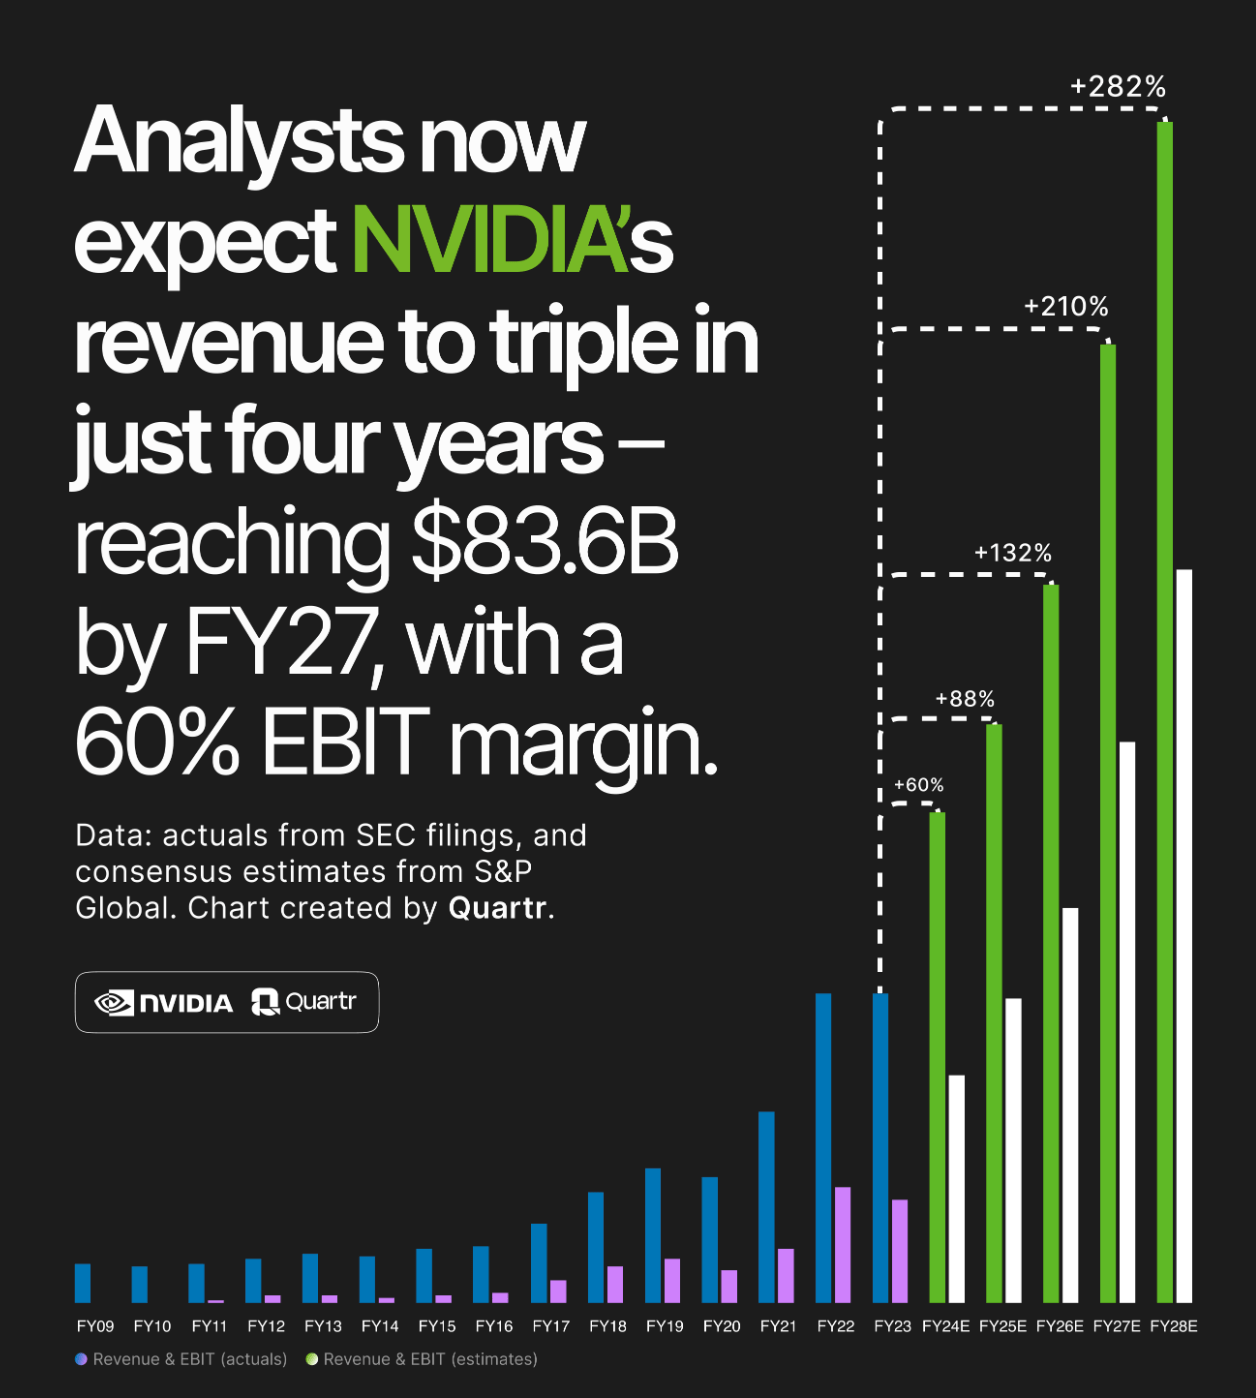
And while these numbers look impressive, it’s worth questioning whether the company can actually do it. We haven’t seen any real results yet, the market lives on expectations and guidance.
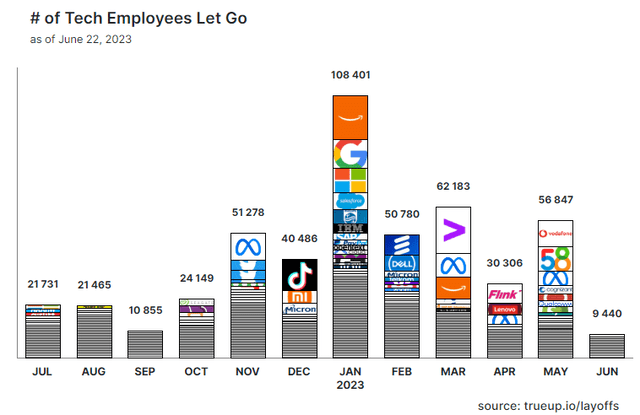
Given how massively IT companies began to lay off employees in fear of a recession six months ago, when layoffs reached 100,000 per month, they can just as well start cutting CapEx as part of deep cost optimization, which will also affect investment in AI development.
Reason 3: Valuations are way too excessive (DCF)
Using analysts’ forecasts, whose optimism increased several times after the release of the Q1 earnings report, the table shows the company’s free cash flows up to the fiscal year 2030, and its value in the post-forecast period is calculated using the multiplier method, using the historical average EV/EBITDA ratio of 25x.
| Ratio (in $mln) | 2Q-4Q 24 | 2025 | 2026 | 2027 | 2028 | 2029 | 2030 |
| EBIT | 15 637 | 27 289 | 33 422 | 44 057 | 53 072 | 60 237 | 68 369 |
| + Amortization | 1 152 | 1 724 | 1 910 | 2 182 | 2 393 | 2 554 | 2 727 |
| – Income Tax | -1 642 | -3 820 | -4 679 | -6 168 | -7 430 | -8 433 | -9 572 |
| – CapEx | -1 267 | -1 897 | -2 101 | -2 400 | -2 632 | -2 810 | -2 999 |
| – Changes in operating accounts | -944 | -1 747 | -1 671 | -2 877 | -2 445 | -1 953 | -2 216 |
| FCF | 12 936 | 21 550 | 26 881 | 34 794 | 42 958 | 49 596 | 56 309 |
| WACC | 13.86% |
| Present value of cash flow, $mln | 139 226 |
| FY2030 EBITDA, $mln | 71 096 |
| Target EV/EBITDA | 25x |
| Terminal value, $mln | 796 094 |
| Target enterprise value, $mln | 869 256 |
| Net debt, $mln | -9 221 |
| Target equity value, $mln | 878 477 |
| Target stock price, $ | 355.6 |
| Upside/Downside | -17.5% |
| Risk-free rate | 4.00% |
| Stock market premium | 6.00% |
| Beta | 1.6 |
| Cost of equity | 13.99% |
| The after-tax cost of debt | 2.06% |
| WACC | 13.86% |
| Source: Finam, Reuters data |
Even truly optimistic forecasts cannot justify Nvidia’s current excessive valuation.
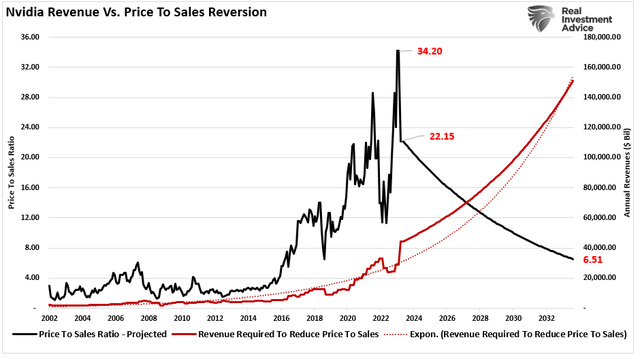
Nvidia looks overvalued by every single metric. If we take into account forward P/S, we’ll see the company needs to grow revenue to $150 billion just to justify a 6.5 forward sales estimate, which is already quite a lot, by 2033.
The market does not give management a chance to make a mistake and, in my opinion, that is why it is worth avoiding Nvidia at these levels.
Conclusion
All in all, Nvidia Corporation has a good position in rapidly growing markets. However, I expect the economy to fall into a fairly deep recession on the horizon over the next 12 months and, regardless of how this crisis is handled, the stock market should cool down. At the same time, we have a company trading at 22x forward sakes. I think Nvidia stock will get a reality check pretty soon, so I believe it would be logical to sell it now.
Analyst’s Disclosure: I/we have no stock, option or similar derivative position in any of the companies mentioned, and no plans to initiate any such positions within the next 72 hours. I wrote this article myself, and it expresses my own opinions. I am not receiving compensation for it (other than from Seeking Alpha). I have no business relationship with any company whose stock is mentioned in this article.
Seeking Alpha’s Disclosure: Past performance is no guarantee of future results. No recommendation or advice is being given as to whether any investment is suitable for a particular investor. Any views or opinions expressed above may not reflect those of Seeking Alpha as a whole. Seeking Alpha is not a licensed securities dealer, broker or US investment adviser or investment bank. Our analysts are third party authors that include both professional investors and individual investors who may not be licensed or certified by any institute or regulatory body.

