Summary:
- Apple has become the market leader in China with a 20% share in Q1 2023, thanks to aggressive pricing strategies and dominance in the premium smartphone market.
- The company stands on the same ground as local Chinese competitors in terms of supply chain, government incentives, localization, and trade war impacts.
- Apple’s growth prospects in China remain strong, with a 5-year forward average of 10% for the premium market segment, leading to a higher price target of $222 and a Buy rating.
Scott Olson
In our last coverage of Apple Inc. (NASDAQ:AAPL), we determined that as a premium smartphone marker, Apple performed resiliently among the top 5 companies despite the market contraction and increased competition from smaller brands such as Honor. Although we concluded that Apple does not possess a performance advantage, we acknowledge its significant edge in terms of branding and feature quality. The company consistently receives top ratings for its camera, audio, display, and battery features. Upon analyzing regional data, we identified the Americas (North and South America) as the most promising market for Apple’s future growth. This assessment is primarily based on the region’s large population and relatively low market penetration overall, which we believed aligns favorably with Apple’s dominant market position in the Americas.
We also held the view that China was not the most advantageous region for Apple, given its relatively weak market position. However, Apple’s standing in China has since strengthened, with the company becoming the market leader in Q1 2023, boasting a share of 20%. This was also highlighted by CEO Tim Cook in its latest earnings briefing, mentioning that it has “four out of the top five” top-selling smartphones in Urban China according to Kantar and gained share in the quarter. Management also mentioned other countries such as “India, Indonesia, Turkey and the UAE” performing well but we focused on the Chinese market specifically because it is the largest smartphone market globally accounting for nearly a quarter of the market in 2022 according to the Counterpoint Research (22.6% of total shipments).
We examined the reasons behind Apple’s market share growth in China and analyze the factors that contributed to it securing the lead in Q1 2023. Next, we will examine whether Apple is likely to maintain its dominant position in the Chinese market over the long term. Finally, we assess whether Chinese smartphone makers have any competitive advantages over foreign firms such as Apple in their home market.
New Chinese Smartphone Market Leader
China Market Share
Counterpoint Research, Khaveen Investments 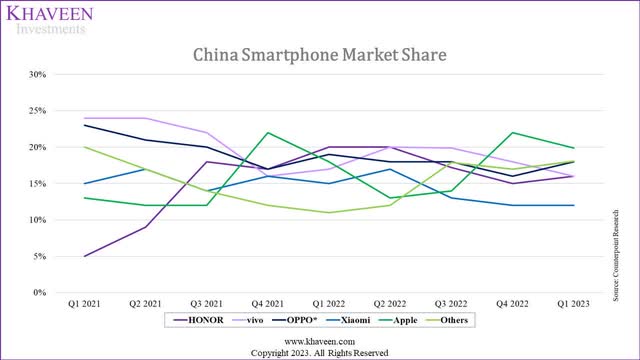
Based on the IDC, in 2022, the Chinese smartphone market had a total of 285.8 mln sales which represented a decline of 13.3% YoY. For the full year, vivo ranked first overall, while HONOR and Apple ranked second and third respectively. However, Apple performed resiliently against competitors in the Chinese market in terms of market share based on Counterpoint Research in the chart above and also reached an all-time-high market share of 18% for the full year in China due to “its aggressive promotions and demand in the high-end segment remained resilient”, according to Canalys.
In Q4, Apple took first place in the market following the launch of its flagship iPhone14 in September. In Q1 2023, Apple continued to maintain its lead with sales growing by 6% YoY despite the market decline. According to Counterpoint Research, its share was almost 20% that quarter and was “its highest Q1 share since 2014, while its sales were also the highest Q1 sales since 2015.”
However, Apple’s shipments in China for Q4 2022 and Q1 2023 combined growth was a decline of 8.4% in the period YoY. In comparison, the total Chinese market declined by 12.2%. Thus, indicating that Apple performed more resiliently than its competitors.
Although vivo maintained its position as the leading company for the full year of 2022, its market share for the full year declined slightly from 21.5% to 19.2%. Additionally, Oppo and Xiaomi’s (OTCPK:XIACF) market share for 2022 also declined compared to 2021. We believe this is because Xiaomi, Oppo and Vivo focus more on the low to mid-range market segment which declined more than the non-premium market segment in 2022. However, Honor was the only local Chinese brand that gained market share among the top companies with total sales of 38% YoY. According to Counterpoint Research, this was due to “this growth was mainly due to a lower base in 2021 when the brand had started its resurgence in the Chinese market”. Another explanation for Honor’s solid performance is its strong product lineup with the launch of its popular X30 series according to Canalys which was launched in December 2021. Additionally, Counterpoint Research also stated that Honor has “stabilized with more product lines covering all price segments”. For example, the launch of its Honor Magic 4 series in March 2022.
Samsung (OTCPK:SSNLF), on the other hand, accounted for only 0.6% of the market share in 2021 compared to 20% in 2013 as the company “became irrelevant due to higher prices and a failure to localize” in the Chinese market against local competitors according to Korea Times.
Aggressive Promotions
According to Canalys, Apple’s superior performance in China was attributed to “aggressive promotions and demand in the high-end segment remained resilient”. Retailers in China cut prices for high-end iPhone 14 models by 10%. According to CNBC…
E-commerce site JD.com (JD), an authorized Apple distributor, is selling the basic version of the iPhone 14 Pro for 7,199 Chinese yuan ($1,062) after an 800 yuan promotion. The basic iPhone 14 Pro Max is listed for 8,199 yuan after an 800 yuan reduction. Suning, another major retailer, is selling the basic model of the iPhone 14 Pro for 7,199 after discounts and the iPhone 14 Pro Ma for 8,199”. – CNBC
Also, the last time that Apple allowed retailers to cut prices was in June 2020. In comparison, our research did not yield any results that indicated that Chinese competitors reduced pricing to a similar extent to Apple. Furthermore, we believe that Apple’s strong profitability supported its ability to cut pricing relative to other competitors who have very low margins in comparison to Apple based on the table below which shows the low margins of Xiaomi, Oppo and Vivo.
|
Companies |
Estimated Operating Margins |
|
Apple |
23.2% |
|
Xiaomi |
1.4% |
|
Oppo |
5.2% |
|
Vivo |
5.0% |
Source: Counterpoint Research, Consumer Technology Association, Khaveen Investments
Resilient Premium Smartphone Market
Another factor for Apple’s performance could be attributed to the stronger premium smartphone market compared to the overall Chinese market.
Counterpoint Research, Khaveen Investments 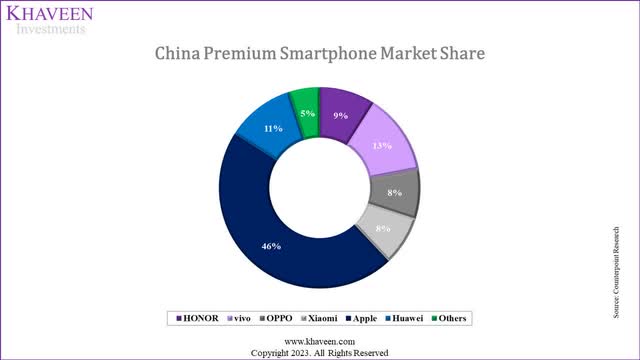
From the chart above, Apple remained the dominant leader in the Chinese premium smartphone market in Q2 2022 with a 46% share. In Q2 2022, the Chinese premium smartphone market contracted by 10% which was below the overall market decline of 14% in the period according to Counterpoint Research, indicating a stronger premium market relative to the overall market. For the full year, we estimated the China premium smartphone had a growth rate of -3.9% based on the share of premium smartphones of 26% in 2022 and an increase of 3% compared to 2021 based on its 6-year average share increase. This is in contrast with the total Chinese smartphone market decline of 13.3% in 2022 and our estimated decline of 16.2% for the Chinese non-premium smartphone market segment.
Overall, we believe that Apple’s superior performance over Chinese competitors in a poor market in China for 2022 could be attributed to its aggressive pricing cuts which we believe highlights the advantage of Apple compared to Chinese competitors due to its high margins which could support its ability to cut prices more than competitors and increase its competitiveness. Also, we believe its strong dominance over the premium smartphone market, which performed more resiliently than the broader market, also supported its share growth and allowed it to be the market leader.
China Superior Premium Market Growth Outlook
Increasing Premium Smartphone Share
|
China Smartphone Market Sales |
2016 |
2022 |
CAGR |
|
China Smartphone Sales |
464.6 |
285.8 |
-7.8% |
|
Premium Smartphone Share of Total |
11% |
26% |
|
|
Premium Smartphone Units |
51.1 |
75.5 |
6.7% |
Source: Counterpoint Research, IDC, Khaveen Investments
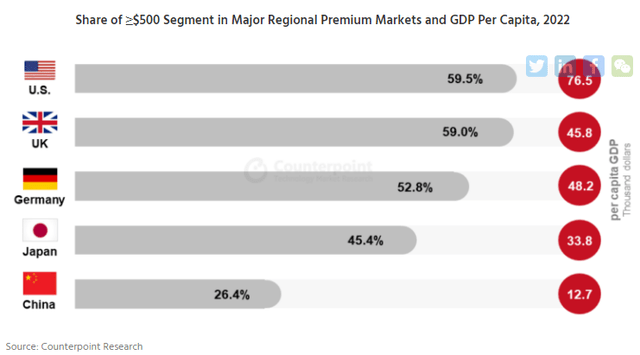
Based on Counterpoint Research, China’s smartphone market represented nearly a quarter or 22.6% of the total global shipments last year, followed by India (12.4%). Furthermore, premium smartphones (>$500) accounted for 26% of the total market in China, which has grown remarkably from a share of only 11% in 2016. We calculated a CAGR of 6.7% for premium smartphone unit sales over the period compared to a -7.8% CAGR for the total market in China. Additionally, Counterpoint Research highlighted the low share of premium smartphones in comparison to the US, UK, Germany, and Japan, highlighting the huge growth opportunities left.
China Income Growth
|
China Average Income |
2016 |
2017 |
2018 |
2019 |
2020 |
2021 |
2022 |
Average |
|
Average Monthly Income |
809.203 |
824.402 |
936.53 |
993.43 |
1070.8 |
1225.34 |
1392.9 |
|
|
Growth % |
-12.2% |
1.9% |
13.6% |
6.1% |
7.8% |
14.4% |
13.7% |
6.5% |
Source: CEIC Data
In terms of income growth, China has had an average gross wage growth of 6.5% in the past 7 years and reach $1,392 per month in 2022 based on CEIC Data. This is the country’s productivity continued to increase as its labor productivity growth averaged 6.5% in the past 8 years at 6.3% according to CEIC Data. Two factors are attributed to China’s fast economic growth which is “large-scale capital investment (financed by large domestic savings and foreign investment) and rapid productivity growth” according to EveryCRSReport. “Economic reforms led to higher efficiency in the economy, which boosted output and increased resources for additional investment in the economy”. Furthermore, the World Bank highlighted that improving productivity and refocusing away from agriculture to other “more productive” economic segments were factors for its growth.
China Population Growth
Statista, IMF, CEIC, National Bureau of Statistics of China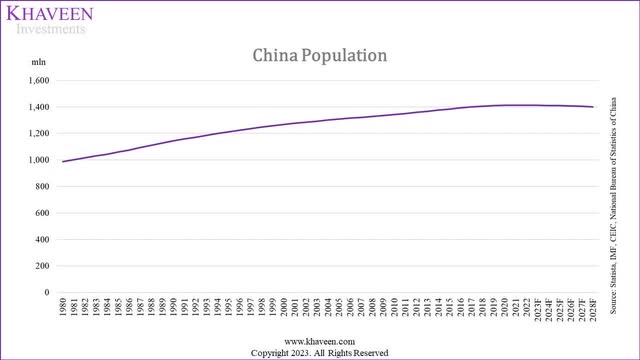
China’s population expanded to over 1.4 bln over the past 40 years from under 1 bln in 1980. However, according to the projections above, the country’s population is projected to stagnate and decline. According to Asia Nikkei, 30% of the population in China is projected to be 60 years old and above by 2035 (400 mln people). Moreover, China’s fertility rate had been on a declining trend and stood at 1.18 children per woman which is down in the past decade and well below the “replacement rate” of 2.1 children per woman despite the relaxation of family planning controls from the one-child policy in the 1980s to the two-child policy in 2016 and three child policy in 2021. Despite efforts to increase the fertility rate, Pew Research projects the population to contract. According to Pew Research, “the large population decline is projected even though it assumes that China’s total fertility rate will rise from 1.18 children per woman in 2022 to 1.48 in 2100”.
China Smartphone Penetration
|
China Smartphone Penetration Rate |
2018 |
2019 |
2020 |
2021 |
2022 |
|
China Population |
1,405 |
1,410 |
1,412 |
1,413 |
1,412 |
|
Growth % |
0.3% |
0.1% |
0.0% |
-0.1% |
|
|
Penetration Rate |
58.1% |
62.6% |
66.8% |
70.3% |
73.6% |
|
China Smartphone Users |
816 |
882.2 |
943.2 |
993.1 |
1,039 |
|
Growth |
8.1% |
6.9% |
5.3% |
4.7% |
Source: Statista, Khaveen Investments
China’s smartphone penetration rate has risen strongly in the past 5 years to 73.6% in 2022 from 58.1% as smartphone users grew rapidly. According to Counterpoint Research, the strong growth of the Chinese smartphone market in the past decade was attributed to factors such as “the popularity of mobile broadband networks, the booming mobile internet content and application ecosystem, and fast economic growth.”
China SAM Projections
|
China Smartphone Penetration Rate |
2019 |
2020 |
2021 |
2022 |
2023F |
2024F |
2025F |
2026F |
2027F |
|
China Population (‘mln’) (‘a’) |
1,410 |
1,412 |
1,413 |
1,412 |
1,412 |
1,411 |
1,409 |
1,407 |
1,404 |
|
Growth % |
0.3% |
0.1% |
0.0% |
-0.1% |
0.0% |
-0.1% |
-0.1% |
-0.2% |
-0.2% |
|
Penetration Rate (‘b’) |
62.6% |
66.8% |
70.3% |
73.6% |
76.6% |
79.1% |
81.2% |
83.0% |
84.3% |
|
Increase |
4.5% |
4.2% |
3.5% |
3.3% |
2.9% |
2.5% |
2.1% |
1.7% |
1.4% |
|
China Smartphone Users (‘mln’) (‘c’) |
882.2 |
943.2 |
993.1 |
1,039 |
1,081 |
1,116 |
1,145 |
1,168 |
1,184 |
|
Growth |
8.1% |
6.9% |
5.3% |
4.7% |
4.0% |
3.2% |
2.6% |
2.0% |
1.4% |
|
Net Increase (‘mln’) |
66.2 |
61.0 |
49.9 |
46.3 |
41.8 |
34.6 |
28.9 |
22.8 |
16.8 |
|
Replacement (‘mln’) (‘d’) |
300.4 |
264.7 |
279.6 |
239.5 |
249.1 |
257.1 |
263.8 |
269.0 |
272.9 |
|
Replacement Rate (‘e’) |
34.1% |
28.1% |
28.2% |
23.0% |
23.0% |
23.0% |
23.0% |
23.0% |
23.0% |
|
Growth % |
-6.0% |
0.1% |
-5.1% |
-3.7% |
-3.7% |
-3.7% |
-3.7% |
-3.7% |
|
|
China Smartphone Sales (‘mln’) |
366.6 |
325.7 |
329.5 |
285.8 |
290.9 |
291.7 |
292.6 |
291.8 |
289.7 |
|
Growth |
-8.0% |
-11.2% |
1.2% |
-13.3% |
1.8% |
0.3% |
0.3% |
-0.3% |
-0.7% |
|
Premium Share of Market |
26.4% |
28.1% |
29.9% |
31.9% |
33.9% |
36.1% |
|||
|
Premium Smartphone Sales (‘mln’) |
75.5 |
81.8 |
87.3 |
93.2 |
99.0 |
104.6 |
|||
|
Premium Smartphone Market Growth % |
8.4% |
6.7% |
6.8% |
6.2% |
5.7% |
||||
|
Non-Premium Share of Market |
73.6% |
71.9% |
70.1% |
68.1% |
66.1% |
63.9% |
|||
|
Non-Premium Smartphone Sales (‘mln’) |
210.35 |
209.16 |
204.43 |
199.42 |
192.87 |
185.08 |
|||
|
Non-Premium Smartphone Market Growth % |
-0.6% |
-2.3% |
-2.5% |
-3.3% |
-4.0% |
*c = a x b, e = c x d
Source: Statista, Khaveen Investments
We forecasted the SAM of the Chinese smartphone market in the table above. Firstly, we projected the number of smartphone users in China to grow based on the projected population forecasts by IMF through 2027 and multiplied with a forecasted penetration rate tapered down by an average of 0.4% per year.
Furthermore, based on the number of smartphone users’ forecasts, we calculated the net increase per year. In addition, we factored in the number of sales for replacement of existing phones based on the calculated replacement rate % which is the number of total smartphone unit sales less the net increase in smartphone users per year. Overall, we forecasted the total smartphone market based on the sum of the smartphone users’ net increase (new sales) and replacement sales (existing sales).
Additionally, we forecasted the premium smartphone market based on our projected smartphone sales growth rate multiplied by the average income growth rate of 6.5%. Based on our forecasts, we have a 5-year forward average of 6.7% for the premium market segment, which is higher compared to the total market average forecast of 0.3%. Thus, we believe this to be advantageous to Apple’s growth outlook as the company dominates the Chinese premium smartphone market.
Do Chinese Smartphone Makers Have Local Advantages?
Apple is the only foreign smartphone maker among the top 5 brands in China in 2022. We examine the advantages that local Chinese players have compared to foreign companies such as Apple.
Supply Chain
In our previous analysis of TSMC (TSM), we determined that China has the lowest cost of manufacturing among the major economies. “Based on KMPG’s CoDB Primary Cost index, China has the lowest score of 2.4 among the regions in the previous diagram which highlights its relatively low manufacturing costs”. Moreover, China is the world’s manufacturing hub as it has the highest share of manufacturing at 29% which is the highest followed by the US. Thus, we believe this provides advantages to local Chinese smartphone makers.
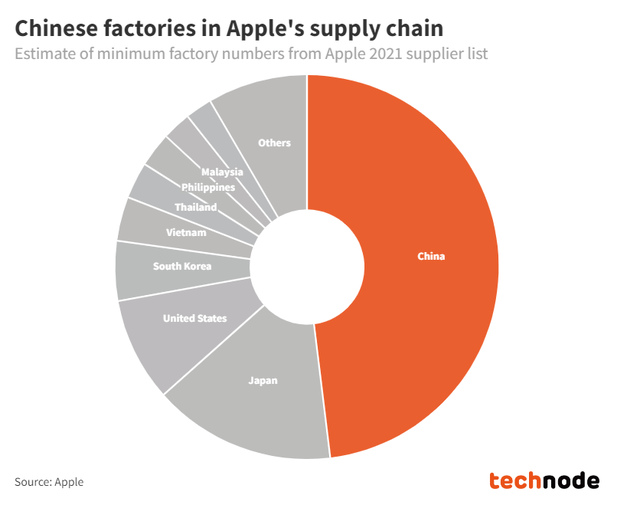
Based on the chart, the majority of Apple’s suppliers are based in China. However, in terms of its supply chain, the company has established its supply chain focus on China as “China is responsible for 95 percent of iPhone production” according to Jing Daily. Therefore, we believe that this does not benefit Chinese competitors exclusively as Apple also benefits from its large supply chain focused on China.
Government Incentives
Moreover, the Chinese government established the Shenzhen Special Economic Zone (SEZ). “SEZs are designed to encourage enterprise through relaxed planning regulations and generous tax incentives – and crucially, to facilitate foreign investment in local companies”. However, Shenzhen also provides benefits to foreign companies operating in Shenzhen such as income tax breaks according to the government website. According to the World Bank, “EZs have also aided China’s increased openness and resource clustering by offering a vehicle and platform for the entry of capital, technology, talents and R&D activities from all over the world”. For example, Hon Hai (OTCPK:HNHAF), Apple’s supplier established its first facility in China in Shenzhen in 1988 called Foxconn in the Special Economic Zone of Shenzhen. According to 9to5mac, “Apple relies on a huge network of suppliers and sub-contractors, some of which may make just a single tiny component. The majority of them are based in Shenzhen and its immediate surrounds”. Therefore, we believe this is not an exclusive benefit to local Chinese competitors as Apple also indirectly benefitted from government incentives through its suppliers in China.
Subsidies for Local Purchases
Furthermore, local governments in Chinese cities have provided consumer subsidies for the purchase of local brand products such as in Shenzhen based on an announcement by the Development and Reform Commission of Shenzhen Municipality. The subsidies go “up to 15 per cent, for a maximum reimbursement of 2,000 yuan (US$300) per person, on purchases of specified products” according to the South China Morning Post.
Furthermore, the announcement highlighted that foreign brands including Apple as well as Samsung are not included in the announcement and only included Chinese competitors such as Huawei, Oppo and Vivo but not Xiaomi. According to the announcement….
A preliminary catalogue released on April 30 of electronics and home appliances eligible for subsidies does not list any foreign brands such as Apple or Samsung, but more than 40 per cent of the 8,249 items listed – which includes different models of the same products – are from Shenzhen-based Huawei Technologies Co. Hundreds of Oppo and Vivo products are also listed, while Beijing-based smartphone giant Xiaomi is conspicuously missing. – South China Morning Post
Therefore, we believe subsidies for local purchases that exclude Apple would provide an advantage only enjoyed by local Chinese competitors and is negative to Apple.
Local Distribution
In terms of distribution and localization among smartphone makers, the competitiveness of foreign companies operating in China is also determined by how successful they are in establishing a solid distribution network in the country. According to Korea Times, the offline market accounted for between 65% to 70% of distribution in China, thus highlighting the significance of physical retail outlets across the country. Also, Korea Times highlighted Samsung’s challenge “to carve an offline distribution presence”.
Apple has over 520 retail locations around the world with the highest unsurprisingly in the US, its home market at 272 stores. However, China is in second place with the second the greatest number of stores for Apple at 45 stores, highlighting its strong footprint in the country. However, the number of stores pales in comparison with local competitors who have a much larger store count in China such as Xiaomi (10,000+) and Oppo (200,000+). Globally, Xiaomi had 1,000 stores in 2021 excluding China and India, which implies an average of around 10 stores per country as it operates in over 100 countries. Moreover, vivo has over 380,000 global offline sales and after sales centers globally in more than 60 countries, translating to an average of 6,333 centers per country.
Therefore, we believe that local Chinese smartphone competitors have an advantage over Apple with a larger distribution network in their home country compared to Apple in terms of the offline market. However, we note that Apple also online presence with Alibaba (Tmall) and JD.com which accounted for 66.7% of the e-commerce market share in China.
Localization
Furthermore, another aspect of localization of the consumer experience of foreign companies’ smartphone devices. Apple adapted to the Chinese market by providing a Chinese language user-friendly iOS system as well as a Chinese app store. Moreover, in comparison to Samsung,
Samsung default apps and services … simply didn’t feel relevant to Chinese consumers who are sealed into an entirely unique internet bubble with different habits, different preferences, different language requirements, etc.
Additionally, iOS remained unbanned in China as Apple complies with the Chinese government but Androids which depend on Google Play Store was affected by the government ban on Google’s apps. According to Lemp, “Xiaomi’s operating system is based on the Android platform and is customized by the company” and its own MIUI app store. Whereas Oppo also has its own OS called ColorOS in China while HONOR launched its MagicOS.
Overall, we believe that local distribution and localization of consumer experiences is not an exclusive advantage for Chinese competitors as we believe Apple also benefits from it due to its vast footprint in the country and well-adapted smartphones.
Trade War
In 2019, the US announced tariffs on Chinese-made products “including phones and computers” at around 15%, affecting the import of consumer goods from China and consumers in the US. However, Apple was exempted from the tariffs as it raises concerns over its unfair competition with competitors such as Samsung which made its phones outside China. Thus, Apple managed to action in the trade war with China which would have resulted in higher prices for US consumers. Similarly, we believe Apple has not been affected by the Chinese government which did not impose tariffs on Apple’s products. The company’s products are still subjected to VAT of 13% in China but apply to all smartphone sales in the country. Therefore, we believe that the trade war has not impacted Apple’s competitiveness in China and is not an advantage for local competitors.
|
Factor |
Does Apple Stand on the Same Ground with Local Companies |
|
Supply Chain |
Yes |
|
Government Incentives |
Yes |
|
Subsidies for Local Purchases |
No |
|
Local Distribution |
No |
|
Localization |
Yes |
|
Trade War |
Yes |
Source: Khaveen Investments
Overall, we believe that Apple stands on the same ground with local Chinese smartphone competitors in terms of having a supply chain focused on China, government incentives and indirect benefits through suppliers such as Hon Hai, localized consumer experiences for Chinese consumers using its smartphones with local language settings and Chinese app stores and not being significantly affected by the US-China trade war. However, we believe local competitors have an advantage over Apple in terms of subsidies for local purchases as well as a strong local distribution network in the country.
Risk: Increasing Premium Smartphone Competition Within China
Despite the company dominating the premium market segment in China, we believe one of the potential risks to the company’s growth outlook in the long term is the increasing competition from local competitors in the Chinese premium smartphone market. This is as brands such as vivo and HONOR gain share based on Counterpoint Research. Furthermore, the research firm highlighted that Chinese smartphone makers are focusing on the premium segment with their strategies including “bringing foldable flagship models customized for Chinese consumers and partnering with traditional camera giants such as Leica, Zeiss and Hasselblad”. Canalys also highlighted the “premiumization product strategies” with Xiaomi’s partnership with Leica to feature its sensor in the 13 Pro series, Oppo’s foldable phones and HONOR’s new MagicOS.
As mentioned in the second point, the premium market segment had increased its share to 26% of the total market from just 11% in 2016, and we forecasted the premium market to grow at a 5-year average of 6.7% compared to our non-premium market average forecasted growth of -2.5%. Thus, we believe it is unsurprising that the local Chinese smartphone makers focus on the faster growth premium smartphone market segment which could affect Apple’s dominance in the market segment.
Valuation
|
Apple Revenue Forecasts ($ mln) |
2022 |
2023F |
2024F |
2025F |
2026F |
|
iPhone |
205.5 |
217.34 |
229.87 |
243.12 |
257.13 |
|
Growth % |
7.0% |
5.8% |
5.8% |
5.8% |
5.8% |
|
Mac |
40.2 |
41.03 |
41.91 |
42.80 |
43.71 |
|
Growth % |
14.2% |
2.1% |
2.1% |
2.1% |
2.1% |
|
iPad |
29.3 |
30.49 |
31.74 |
33.05 |
34.41 |
|
Growth % |
-8.1% |
4.1% |
4.1% |
4.1% |
4.1% |
|
Wearables, home and accessories |
41.2 |
48.07 |
54.61 |
60.40 |
65.00 |
|
Growth % |
7.4% |
16.6% |
13.6% |
10.6% |
7.6% |
|
Services |
78.1 |
96.14 |
118.09 |
144.92 |
178.32 |
|
Growth % |
14.2% |
23.1% |
22.8% |
22.7% |
23.0% |
|
Total |
394.3 |
433.1 |
476.2 |
524.3 |
578.6 |
|
Total Growth % |
7.8% |
9.8% |
10.0% |
10.1% |
10.4% |
Source: Apple, Khaveen Investments
We updated our revenue projections of Apple for its iPhone segment which we derived based on our projection of its shipment growth and ASP growth. We updated our shipment growth forecasts based on our projected premium smartphone CAGR for China multiplied by its share of revenues from China and we applied the smartphone market shipments forecast CAGR by Statista for its other regions multiplied by their respective share of revenue. Overall, we obtained a slightly higher forecast for its shipments at 4.4% compared to 4.1% previously and an overall iPhone revenue growth forecast rate of 5.8% with the same ASP growth forecast of 1.3% previously.
|
EV/EBITDA |
Weight |
Weighted Average |
|
Product |
80.2% |
13.55x |
|
Service |
19.8% |
31.10x |
|
Total |
100.0% |
17.03x |
Source: Khaveen Investments
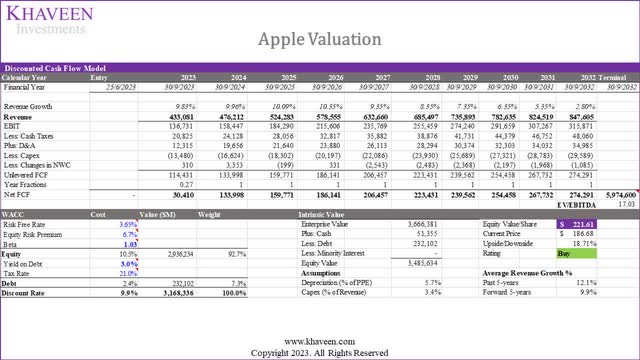
Based on a DCF analysis with a discount rate of 9.9% (company’s WACC) and terminal value based on a weighted average EV/EBITDA of the top software and hardware companies (17.03x), our model shows its shares are undervalued by 18.7%.
Verdict
In general, our analysis suggests that Apple’s superior performance in the challenging Chinese market in 2022 can be attributed to its aggressive pricing strategy, which underscores its advantage over Chinese competitors due to its stronger profit margins. This advantage allows Apple to cut prices more than its rivals, enhancing its competitiveness. Moreover, Apple’s dominance in the premium smartphone market, which proved more resilient than the broader market, supported its share growth and solidified its position as the market leader. Furthermore, we developed a forecast for the premium smartphone market, which takes into account our projected sales growth rate and the average income growth rate of 6.5%. Our forecast indicates a 5-year forward average of 10% for the premium market segment, which is higher than the total market average forecast of 3.3%. This forecast bodes well for Apple’s growth prospects, given its dominance in the Chinese premium smartphone market.
In terms of its competitive position compared to local Chinese smartphone competitors, we see Apple as standing on the same ground with Chinese competitors in most of the factors including its large supply chain in China, benefit from government incentives, localization and being relatively unimpacted by the trade war.
We last rated the company as a Strong Buy in January 2023 and the company’s stock price increased spectacularly by 38.5%. This time, we value Apple at a higher price target of $221.61 which is 14.7% higher compared to the previous analysis of $193.27 despite a fairly similar 5-year average of 9.9% (9.8% previously). The increase is mainly due to the higher average EV/EBITDA used of 17.03x which is 13.5% higher than our previous analysis of 15x. Regardless, we downgrade our rating from a Strong Buy to a Buy given the 38% increase in its stock price since our last coverage.
Editor’s Note: This article discusses one or more securities that do not trade on a major U.S. exchange. Please be aware of the risks associated with these stocks.
Analyst’s Disclosure: I/we have a beneficial long position in the shares of AAPL either through stock ownership, options, or other derivatives. I wrote this article myself, and it expresses my own opinions. I am not receiving compensation for it (other than from Seeking Alpha). I have no business relationship with any company whose stock is mentioned in this article.
No information in this publication is intended as investment, tax, accounting, or legal advice, or as an offer/solicitation to sell or buy. Material provided in this publication is for educational purposes only and was prepared from sources and data believed to be reliable, but we do not guarantee its accuracy or completeness.
Seeking Alpha’s Disclosure: Past performance is no guarantee of future results. No recommendation or advice is being given as to whether any investment is suitable for a particular investor. Any views or opinions expressed above may not reflect those of Seeking Alpha as a whole. Seeking Alpha is not a licensed securities dealer, broker or US investment adviser or investment bank. Our analysts are third party authors that include both professional investors and individual investors who may not be licensed or certified by any institute or regulatory body.

