Summary:
- Visa is still the largest US credit card network. Mastercard has traded at a premium for some time due to its higher returns on equity and returns on invested capital.
- It appears a large part of the premium for Mastercard is due to accounting practice differences between Visa and Mastercard. Mastercard reduces its’ equity capital base by not retiring shares.
- I prefer to look at margins versus returns on capital. If both used the same accounting for buybacks, the ROIC chasm would not be as large.
- Both have a similar emphasis on more B2B/C and G2C/B solutions is focused on international markets where digital payment systems are not yet commonplace among governments and businesses.
- Both are excellent businesses and somewhat insulated from defaults on debt compared to banks.
miniseries
The two largest payment networks
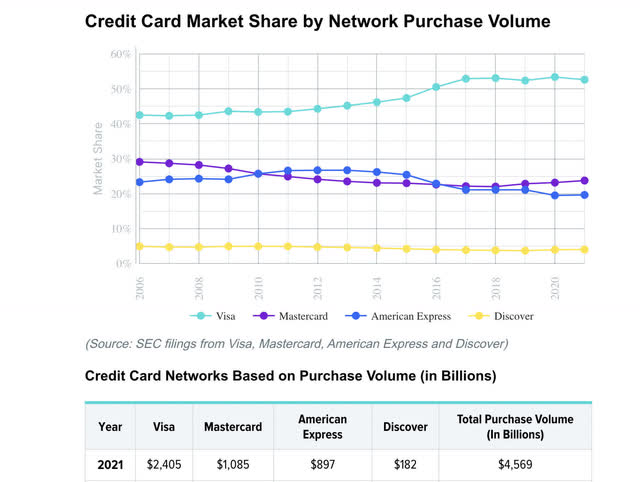
Visa Inc. (NYSE:V) and Mastercard Incorporated (NYSE:MA) are the two largest payment networks in the US by purchase volume. While Visa is the largest, Mastercard has higher returns on equity and returns on invested capital which garners a premium to fair value larger than Visa. Let’s pit the two plastic pugilists against one another and see which is the cheaper stock after their epic runs.
The chart
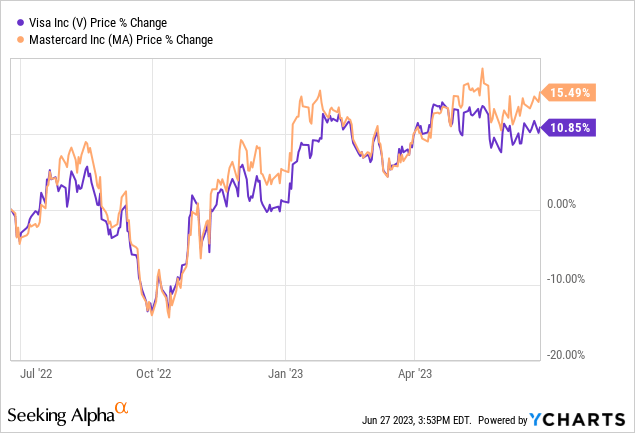
These charts virtually mimic one another over a one-year period with Mastercard outperforming by about 5% over this duration.
What they do
From the Visa 10-K:
Visa is one of the world’s leaders in digital payments. Our purpose is to uplift everyone, everywhere by being the best way to pay and be paid. We facilitate global commerce and money movement across more than 200 countries and territories among a global set of consumers, merchants, financial institutions and government entities through innovative technologies.
We offer a wide range of Visa-branded payment products that our clients, including nearly 15,000 financial institutions, use to develop and offer core business solutions, including credit, debit, prepaid and cash access programs for individual, business and government account holders.
From the Mastercard 10-K:
Mastercard is a technology company in the global payments industry. We connect consumers, financial institutions, merchants, governments, digital partners, businesses and other organizations worldwide by enabling electronic payments instead of cash and checks and making those payment transactions safe, simple, smart and accessible. We make payments easier and more efficient by providing a wide range of payment solutions and services using our family of well-known and trusted brands, including Mastercard®, Maestro® and Cirrus®.
We operate a multi-rail payments network that provides choice and flexibility for consumers, merchants and our customers. Through our unique and proprietary core global payments network, we switch (authorize, clear and settle) payment transactions. We have additional payment capabilities that include automated clearing house “ACH” transactions (both batch and real-time account-based payments).
Valuation models
Both of these are stable companies that grow with inflation. Here we will pit them against one another using a Buffett “owner earnings” model:
| stock | TTM net income | plus TTM Depreciation and Amortization | minus TTM Capex | Equals Owner earnings |
| Visa | 15787 | 917 | 989 | 15715 |
| Mastercard | 9660 | 886 | 406 | 10140 |
| stock | fair market cap: owner earnings discounted to risk free rate 3.7% 10 Year Treasury |
divided by shares outstanding |
| Visa | 424729 | $207 |
| Mastercard | 274054 | $289 |
Based on the first battle of the stocks versus fair value, Visa is currently priced at $228 vs $207 fair and Mastercard at $289 fair vs $381. Visa wins the first round being more fairly priced “cheap”.
Growth
Mastercard:
Visa:
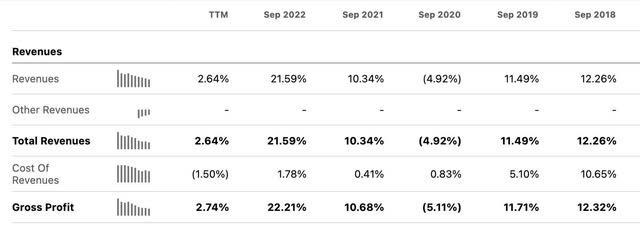
Looking at the top line, Mastercard has an 5 year average trailing annual growth rate of 12.874%. Visa’s average 5 year annual top-line growth is a bit weaker at 10.15%. The compound annual growth rate for Visa’s top line is 7.3% over this period and Mastercard’s 8.25%.
Net income
Mastercard trailing 5 year CAGR= 11.16%
Visa trailing 5 year CAGR= 7.73%
Revenue and net income growth advantage goes to Mastercard.
ROIC comparison
All data in millions courtesy of Seeking Alpha
Let’s take a look at the two using the following:
NOPAT (net operating income after taxes)/total LT + ST borrowings + total equity, aka “invested capital”.
- NOPAT=EBIT X (1- tax rate): Visa=17,277 Mastercard= 10,623
- MRQ total equity: Visa=34,565 Mastercard=5,407
- MRQ Long term debt + short term borrowings Visa= 34,799 Mastercard= 19,988
- Visa invested capital= 73,364 Mastercard invested capital = 25,395
- NOPAT/ Invested Capital=ROIC
| Stock | ROIC |
| Visa | 23.5% |
| Mastercard | 41.8% |
This is where Mastercard gets the premium price over Visa. With a larger ROIC than Visa by a fairly wide margin. This round goes to Mastercard.
Magic Formula Score
Joel Greenblatt’s Magic Formula is a good scoring system to find cheap stocks by both “good”, defined as having a high ROIC, and “cheap” defined as having a high earnings yield. Let’s score them:
| Stock | FWD GAAP Earnings Yield | ROIC | total score EY+ROIC |
| Visa | 3.7% | 23.5% | 27.2 |
| Mastercard | 3.3% | 41.8% | 45.1 |
While Visa is more fairly priced on a GAAP earnings yield basis, the large difference in ROIC swings this round to Mastercard.
Balance sheet trends
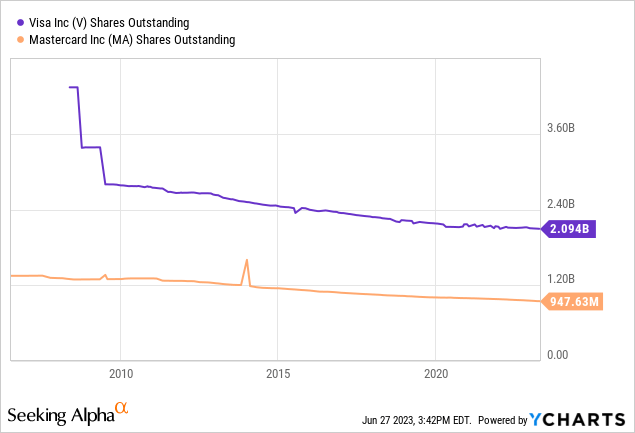
Both demonstrate a nice buyback trend and downward trajectory in shares outstanding. Let’s take a look at the current assets versus long term debt.
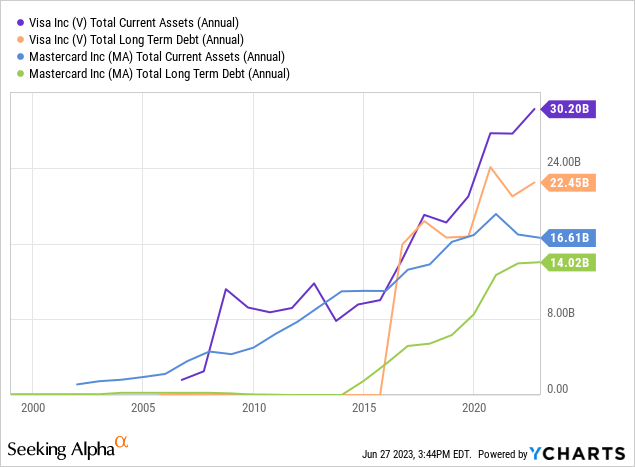
The spread between current assets and long-term debt is better for Visa than for Mastercard. Both have more current assets than LT debt, which is outstanding, but as we’ll see in the EBIT to net interest coverage, Mastercard employs more debt in its capital stack.
Advantage: Visa
EBIT to net interest coverage
| stock | EBIT | net interest expense | Coverage |
| Visa | 20,741 | (201) | 103 X |
| Mastercard | 12,987 | (382) | 33 X |
The interest coverage ratio on both are large and immaterial to the functioning of the businesses. However, the coverage ratio can show who is more levered up. The margin between LT debt and current assets is much thinner for Mastercard. More debt seems to be deployed towards buybacks in the case of Mastercard as well.
Winner: Visa
Margin trends
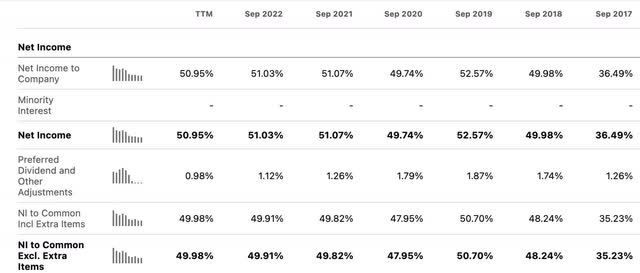
Visa net income margins:
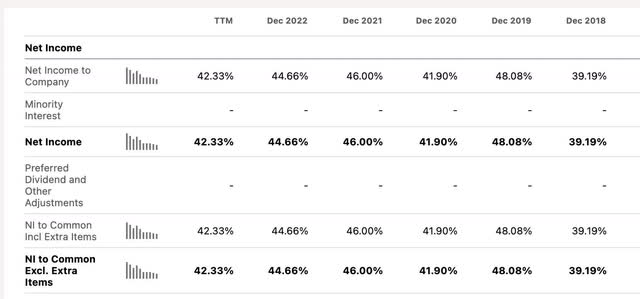
Mastercard net income margins:
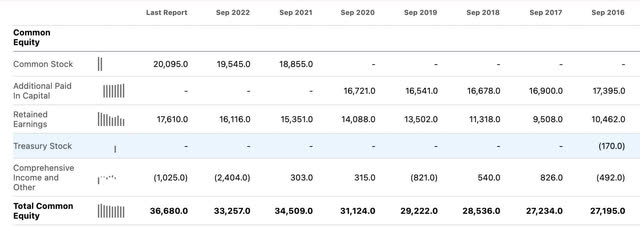
Interesting. Although Mastercard has a higher ROIC, Visa has the higher profit margins by a decent amount. The share buybacks without retirement decrease Mastercard’s equity capital base. Visa does not have treasury stock, therefore not creating the contra-asset. Basically, two different accounting practices, let’s observe:
Mastercard:
Visa:
The two different accounting methods, retiring versus not retiring shares, seem to be where the big difference in ROE and ROIC lies between the two companies. Since we can’t exactly compare apples to apples in this case since the capital bases follow different methodologies, I would defer to the margins versus the ROIC and ROE. This appears to be a situation of cost versus the constructive retirement method.
Winner: Visa
The dividend
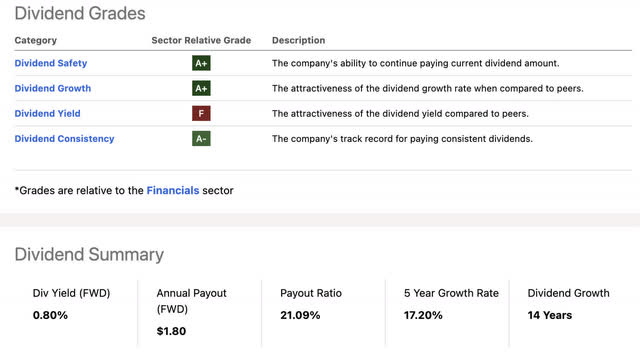
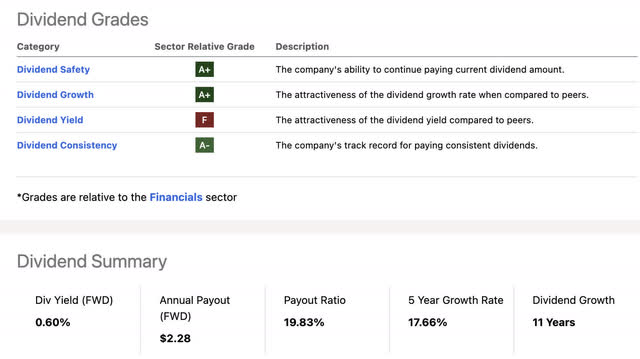
Both pay a small, well-covered and fast growing dividend. Nothing to write home about. Let’s call this one a tie.
Visa:
Mastercard:
Trajectories and markets:
Visa:
From the MRFY Visa 10-K:
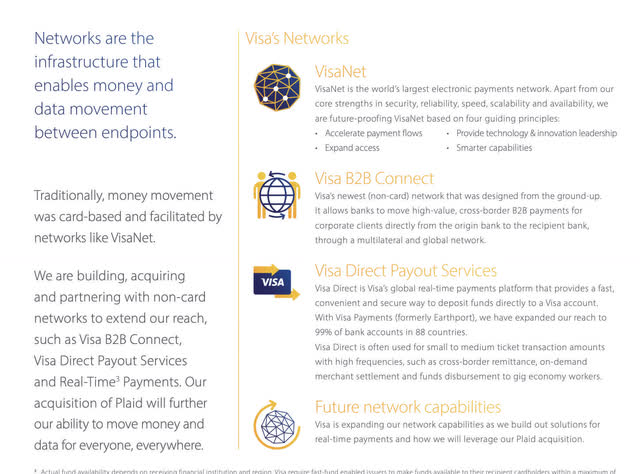
We are accelerating the migration to digital payments and continue to evolve to be a “network of networks” to enable the movement of money through all available networks. We aim to provide a single connection point so that Visa clients can enable money movement for businesses, governments and consumers, regardless of which network is used to start or complete the transaction. This ultimately helps to unify a complex payments ecosystem.
Visa’s network of networks approach creates opportunities by facilitating person-to person (P2P), business-to-consumer (B2C), business-to-business (B2B), business-to-small business (B2b) and government-to consumer (G2C) payments, in addition to consumer to business (C2B) payments.
A trend we see in digital payment networks to keep up with new payment processing systems is migrating more of the business to non-physical payments. The “network of networks” system seems to be aimed at being able to settle payments with non-network senders and recipients:
Mastercard:
From the Mastercard 10-K:
We focus on expanding upon our core payments network to enable payment flows for consumers, businesses, governments and others, providing them with choice and flexibility to transact across multiple payment rails (including cards, real-time payments, account-to-account transactions, crypto and others) while ensuring that all payments are safe, secure and seamless. We do so by:
• Driving growth in consumer payments with a focus on accelerating digitization, growing acceptance and pursuing an expanded set of use cases, including through partnerships
• Capturing new payment flows by expanding our multi-rail capabilities and applications to penetrate key flows such as disbursements and remittances, commercial point of sale transactions, business-to-business (“B2B”) accounts payable flows and consumer bill payments
• Leaning into new payment innovations such as our piloting in 2022 of Mastercard Installments (our buy-now-pay-later solution) and developing solutions that support digital currencies and blockchain applications
Very similar growth strategy to Visa with the one caveat being blockchain and buy-now-pay-later. The emphasis by both Visa and Mastercard on more B2B/C and G2C/B solutions is focused on international markets where digital payment systems are not yet commonplace among governments and businesses.
Risks
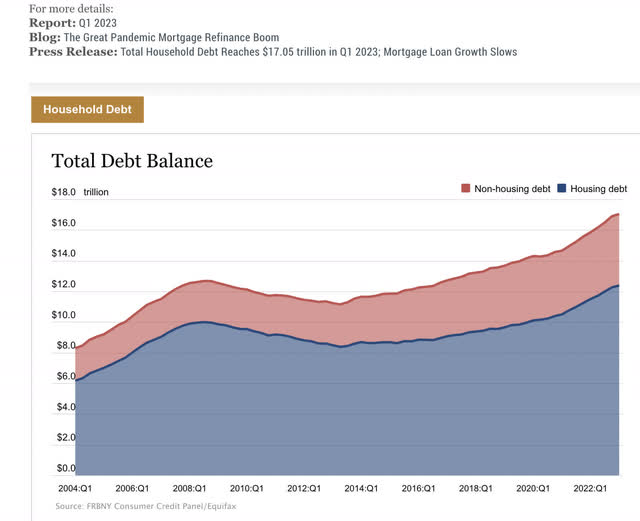
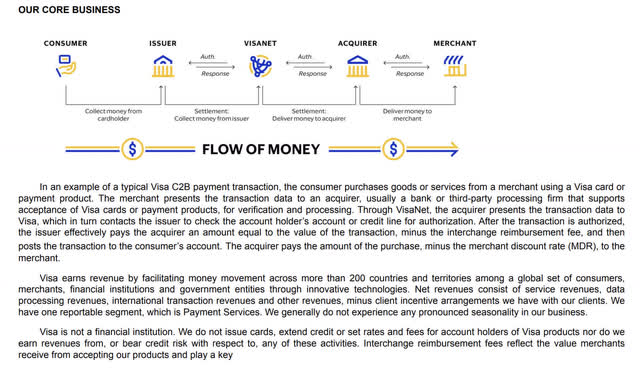
The total consumer debt balance cuts both ways. Increases can mean more revenue for payment networks as their products touch each terminal or checkout button. The higher the mountain, the greater the fall. If a dreaded recession does happen and rates can’t make up for bad, uncollectible debts, all involved will be touched. Luckily Visa and Mastercard operate in providing transaction processing services. Here is a well-laid-out description of the payment network business from the MRFY Visa 10-K:
While Visa and Mastercard are not the risk bearers of defaults, their revenue and income will be materially damaged in the case of:
- Lower consumer spending.
- Lower credit ratings due to defaults resulting in more difficulty extending credit by institutions.
The business is not riskless from a defaulting user perspective, but they are both far better insulated than the banking institutions behind the actual debt. This is different than American Express (AXP) which also is the facilitator to many of the actual loans to consumers.
Scorecard
| Value | (V) |
| Growth | (MA) |
| ROIC | (MA) |
| Magic Formula | (MA) |
| Balance Sheet | (V) |
| Net interest coverage | (V) |
| Profit Margin | (V) |
| Dividend | Tie |
4 checks for Visa and 3 for Mastercard with one tie. The win goes to Visa for being the better value at this time.
Conclusion
Consumer spending and GDP growth is a catalyst for both. The more that we turn into a cashless society, the more business credit card network companies will absorb by virtue. While there are new, burgeoning digital payment systems, these established credit providers will still rule the payment network market for years to come. This will be the case for both traditional payment and M&A activity (example, Visa acquiring Plaid, Mastercard acquiring CipherTrace).
That being said, Visa is still the largest US credit card network. Mastercard has traded at a premium for some time due to its higher returns on equity and returns on invested capital. It appears a large part of that is due to accounting practice differences between Visa and Mastercard. Mastercard reduces its’ equity capital base by not retiring shares. In this case, I prefer to look at margins versus returns on capital. If both used the same accounting for buybacks, the ROIC chasm would not be as large.
Visa is the winner in this battle and is more fairly valued.
Analyst’s Disclosure: I/we have a beneficial long position in the shares of AXP, V, MA either through stock ownership, options, or other derivatives. I wrote this article myself, and it expresses my own opinions. I am not receiving compensation for it (other than from Seeking Alpha). I have no business relationship with any company whose stock is mentioned in this article.
Seeking Alpha’s Disclosure: Past performance is no guarantee of future results. No recommendation or advice is being given as to whether any investment is suitable for a particular investor. Any views or opinions expressed above may not reflect those of Seeking Alpha as a whole. Seeking Alpha is not a licensed securities dealer, broker or US investment adviser or investment bank. Our analysts are third party authors that include both professional investors and individual investors who may not be licensed or certified by any institute or regulatory body.

