Summary:
- Nvidia Corporation is expected to nearly quadruple EPS through 2025.
- Opportunities in AI and accelerated computing within a broader industrial digitalization support a positive long-term outlook for Nvidia.
- Nvidia stock appears relatively inexpensive relative to mega-cap tech peers based on the price-to-earnings growth multiple.
BING-JHEN HONG
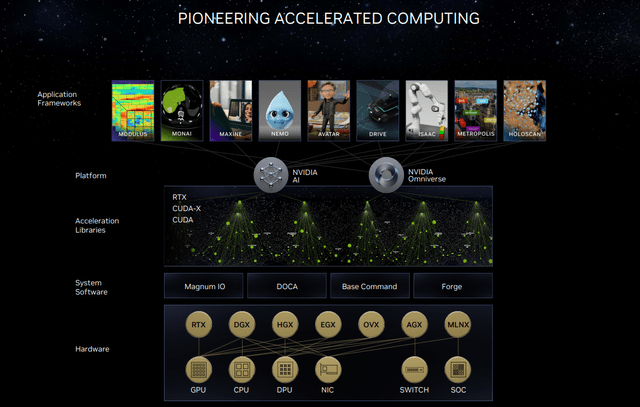
Nvidia Corporation (NASDAQ:NVDA) held its annual shareholder meeting on June 22nd, providing management a new opportunity to reiterate its optimism on what they are calling a “new era of computing.” The idea here is that Nvidia’s portfolio of GPU and superchip platforms are at the cutting edge of the biggest themes in tech, those being accelerated computing and artificial intelligence (“AI”).
While the event didn’t feature a major new announcement or financial guidance update compared to the last blockbuster quarterly report, the takeaway for us is that the growth drivers are much more than simply generative AI.
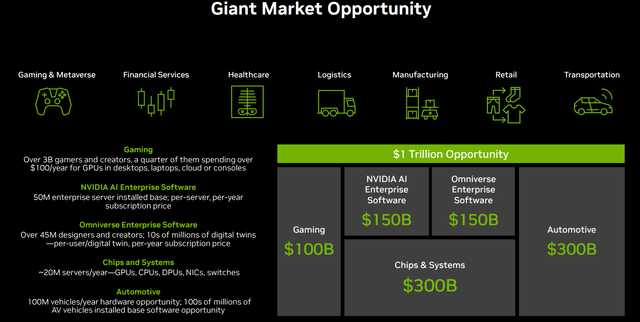
Everything from design, engineering, manufacturing, robotics, transportation, communications, healthcare and gaming are set to be transformed by the efficiency and performance breakthrough of Nvidia AI-powered technologies.
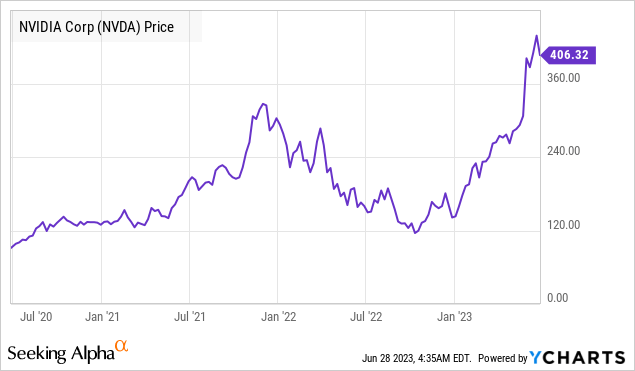
Indeed, the company is well positioned to capture what remains an early stage of secular growth tailwinds in a broader cross-sector industrial digitalization. At the same time, the setup is hardly a secret, with NVDA already up nearly 200% in 2023 as one of the biggest stock market winners this year, reaching a milestone $1 trillion equity capitalization.
We won’t blame anyone for simply looking at the stock price chart from the outside with a sense that the train has already left the station. Still, there are plenty of reasons to believe the rally can continue, and we’ll even make the case that NVDA’s valuation remains very reasonable. In our opinion, the momentum is warranted and supports a long-term bullish outlook on the stock.
NVDA is an Earnings Monster
The key for investors to recognize is that the explosive demand for Nvidia’s accelerated computing platform is translating into a bonanza for earnings. That was the message from the fiscal Q1 report, where Q2 sales guidance approaching $11 billion was well above the prior consensus looking for a figure closer to $7 billion.
Simply put, Nvidia counts on cloud service providers (CSPs) like Amazon.com Inc (AMZN), Microsoft Corp (MSFT), Alphabet Inc (GOOGL), Salesforce Inc (CRM) and even Alibaba Group Holding Limited (BABA) as key customers on the enterprise side. They are rushing to deploy the latest flagship GPUs to meet a rush of demand for AI applications.
The momentum is expected to continue through the rest of the year and into fiscal 2025 as a resurgence to the data center investment cycle. Separately, Nvidia is seeing a rebound in other related segments including its the consumer-facing gaming graphics business as well as strength in automotive sector products.
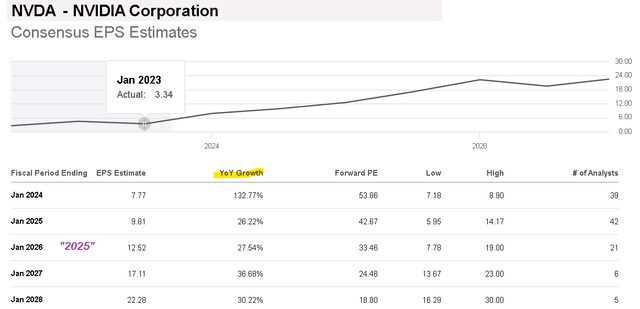
For the full year, the consensus is for EPS to reach $7.77, up 133% year-over-year. The market sees earnings growth above 26% next year and 27% into fiscal 2026, covering the calendar year 2025.
This is a very impressive outlook by any measure. We believe this helps place the stock’s current 54x forward P/E multiple into context as a premium justified by the operating and financial backdrop.
NVDA is Cheap Based on the FWD PEG Ratio
What we want to highlight here is that NVDA’s valuation stands out among a group of other mega-cap tech players, particularly through the price-to-earnings growth (PEG) ratio, implying the stock is undervalued at least according to this metric. All else equal, a stock trading at a lower PEG implies investors are paying less per unit of earnings growth.
For Nvidia, the stock trading at a forward P/E of 54x against expected EPS upside this year of 133%. This means NVDA shares are trading at a forward PEG of 0.4x. This is compares to a forward PEG ratio of 1.2x for Alphabet Inc, for example, which is trading at a forward P/E of 22x but only expected to see 18% earnings growth for 2023.
On the other hand, Microsoft could appear expensive given its forward PEG of 6.8x, considering it trades at a forward P/E of 34x while only expected to deliver 5% higher EPS this year.
The table below includes the same calculated forward PEG ratio for a group known as the “megacap-8” for their outsized importance in the U.S. stock market as tech leaders. Famous investor Peter Lynch has claimed a stock trading at a PEG ratio below 1x is relatively attractive.
| Company | Price | FWD P/E | Est. EPS Growth 2023 | FWD PEG Ratio |
| Nvidia | $415 | 54x | 132% | >>>0.4x |
| Meta Platforms (META) | $287 | 24x | 33% | 0.7x |
| Alphabet Inc | $118 | 22x | 18% | 1.2x |
| Netflix Inc (NFLX) | $418 | 37x | 13% | 2.8x |
| Microsoft Corp | $335 | 34x | 5% | 6.8x |
| Amazon Inc | $129 | 81x | neg. in 2022 | n/a |
| Apple Inc (AAPL) | $188 | 31x | (-2%) | n/a |
| Tesla, Inc (TSLA) | $250 | 70x | (-14%) | n/a |
Source: consensus estimates from Seeking Alpha.
We can note the limitations of the PEG ratio, which is evident by the table above with AMZN, where the ratio cannot be calculated because its EPS was negative last year, though expected to reverse into a positive figure for 2023. The ratio also has little meaning for companies with an expected decline in earnings, as is the case with Apple and Tesla this year.
The understanding is that no investing decision should ever be based on a single metric, and that the PEG ratio works best when used in conjunction with other quantifiable and qualitative analysis. We can look at trends in cash flow, financial margins, product roadmaps, and segment positioning as all playing a role in justifying a higher or lower valuation.
By this measure, the PEG is a tricky indicator. You’ll find varying definitions depending on the source using alternative calculations like utilizing the trailing-twelve-months P/E as the numerator or using a longer-term earnings growth forecast.
The table below attempts to smooth out some of those exceptions by taking the current forward P/E against the estimated average EPS growth rate through the next three years for the same group of stocks.
Going back to the consensus earnings growth for NVDA expected to reach EPS of $12.52 by fiscal 2026 (covering the calendar year 2025), nearly four times the fiscal 2023 result, this represents a composite annual growth rate of 55%; we can say that NVDA is trading at a forward PEG ratio of 1.0x through this alternative calculation. Again, the stock sizes up well next to GOOGL at 1.3x and MSFT at 1.5x.
| Alternative FWD PEG calculation based on estimated EPS growth through 2025 | ||||
| Company | Price | FWD P/E | Est. CAGR EPS Growth 3YR “CY2022A – 2025E” | alternative FWD PEG Ratio |
| Nvidia | $419 | 54x | 55% | >>>1.0x |
| Meta Platforms | $287 | 24x | 25% | 1.0x |
| Alphabet | $118 | 22x | 17% | 1.3x |
| Netflix | $418 | 37x | 24% | 1.5x |
| Amazon | $129 | 81x | 54% “2YR CAGR” | 1.5x |
| Microsoft | $335 | 34x | 11% | 3.1x |
| Tesla | $250 | 70x | 15% | 4.7x |
| Apple | $188 | 31x | 6% | 5.2x |
|
*AMZN uses a 2YR CAGR between 2023 and 2025 given 2022 EPS was negative. -source: consensus estimates from Seeking Alpha. |
||||
What’s Next for NVDA?
The point we’re attempting to drive home is that it may be a mistake for investors to look at Nvidia trading at an earnings premium to the market or even its sales multiple of 24x and claim the stock is in a “bubble” or widely overvalued. That’s far from the case, in our opinion.
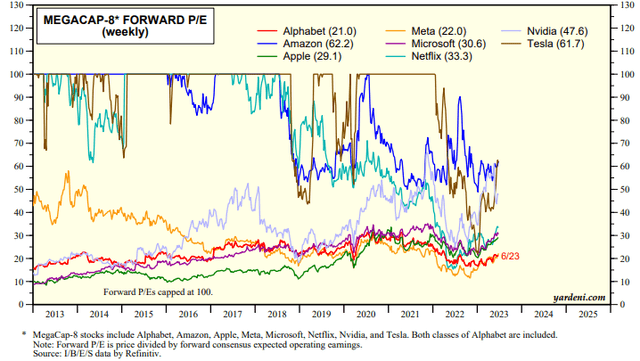
The chart below tracks the historical forward P/E for the same group of 8 mega-cap stocks over the past decade. We can point to names like TSLA and AMZN trading with multiples above 100x that have still been massive winners over the period. Even NVDA traded at a forward P/E multiple above 60x back in 2017, while shares have returned more than 730% in the period since.
I’s fair to argue that the earnings outlook may be too optimistic or debate reasons why shares could underperform going forward. For us, the growth runway and wave of profitability over the next few years is on firm footing and should be supportive for further upside.
We’re not suggesting NVDA is “the best” stock or the only stock that can run higher, but there is room to push back on calls suggesting it’s set for a big reset lower.
The next several quarters will be important for Nvidia to affirm the strength of the market demand, with the bullish case being that there is room to even exceed expectations with higher-than-expected earnings. Monitoring points will be the margin levels, reflecting both pricing power and an ongoing shift towards a services model given the AI data center service hardware subscription options.
What we find in tech is that the pace of developments can often sometimes be hard to keep up. The risk to watch is that competitors, including Advanced Micro Devices (AMD) and even Intel Corp (INTC), play catch-up, but ultimately arrive first to the next big breakthrough.
What we want to see from Nvidia is that company keeps its foot on the pedal to take advantage of this window of opportunity to both build market share and consolidate its relationship with key customers to remain the benchmark for innovation.
NVDA Stock Price Forecast
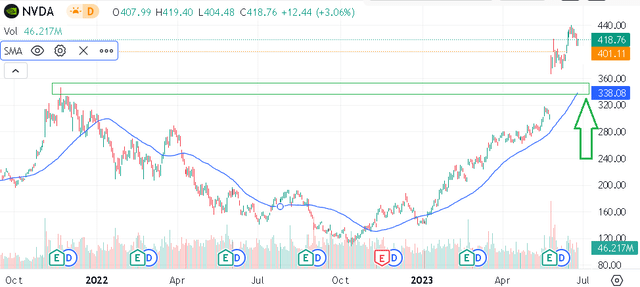
Looking at the NVDA price chart, there are a couple of levels in play. First, the $400 stock price level coinciding with the $1 trillion market cap should work as the first level of technical support.
We note that the stock is currently above the previous all-time high set back in late 2021, when it briefly approached $350. We make the case that the outlook today is stronger than ever, and that level should hold outside some major macro deterioration of broader financial market volatility event.
It would take a significant breakdown under that range, converging with the 50-day moving average, to suggest a bearish sentiment is taking over. The possibility of NVDA approaching that level would simply be a buy-the dip opportunity, and we would turn even more bullish.
In our view, the near-term momentum remains positive, and investors can look ahead toward the Q2 earnings release expected in late August as the next major catalyst for a leg higher. While we don’t see NVDA stock doubling against in the near future, a target for the rest of the year towards $500 per share could be on the table.
Analyst’s Disclosure: I/we have a beneficial long position in the shares of QQQ, NVDA, AMZN either through stock ownership, options, or other derivatives. I wrote this article myself, and it expresses my own opinions. I am not receiving compensation for it (other than from Seeking Alpha). I have no business relationship with any company whose stock is mentioned in this article.
Seeking Alpha’s Disclosure: Past performance is no guarantee of future results. No recommendation or advice is being given as to whether any investment is suitable for a particular investor. Any views or opinions expressed above may not reflect those of Seeking Alpha as a whole. Seeking Alpha is not a licensed securities dealer, broker or US investment adviser or investment bank. Our analysts are third party authors that include both professional investors and individual investors who may not be licensed or certified by any institute or regulatory body.
Add some conviction to your trading! Take a look at our exclusive stock picks. Join a winning team that gets it right. Click here for a two-week free trial.

