Summary:
- Following great results from Q3 2022, financials are growing at impressive CAGRs.
- AT&T’s insiders have significantly bought, possibly confirming growth tailwinds ahead and positive investor sentiments.
- Still strong dividend program with high yields, ranks above industry and SPY; AT&T has cheaper valuation compared to peers.
- My Conservative DCF Model with high WACC resulted in a 26.44% market undervaluation; 23 analysts reported from Yahoo Finance has similar valuation and price targets.
- Economy is slightly faring better and management is successfully adjusting to lowered interest rates activity.
Ronald Martinez/Getty Images News
Introduction
AT&T Inc. (NYSE:T) is the world’s largest Telecommunications company most known for its internet and telephone services in the Integrated Telecommunication Services Industry. In the first graph below, T stock has outperformed the broader market, gaining 2.99% in market capitalization while the S&P 500 index declined by 15.29% year to date. When looking at the total return of the past 10 years, SPY has returned a significant ~500% more to shareholders.
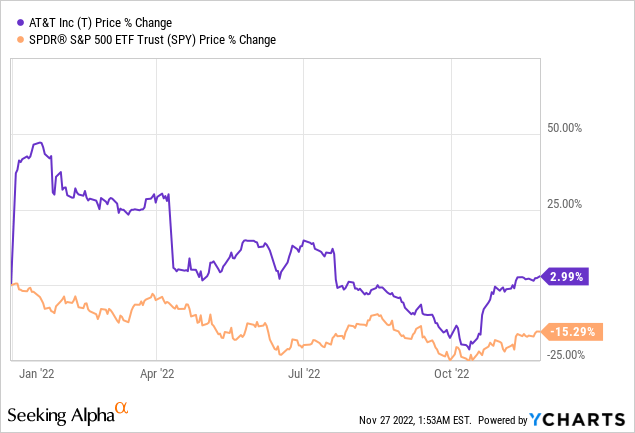
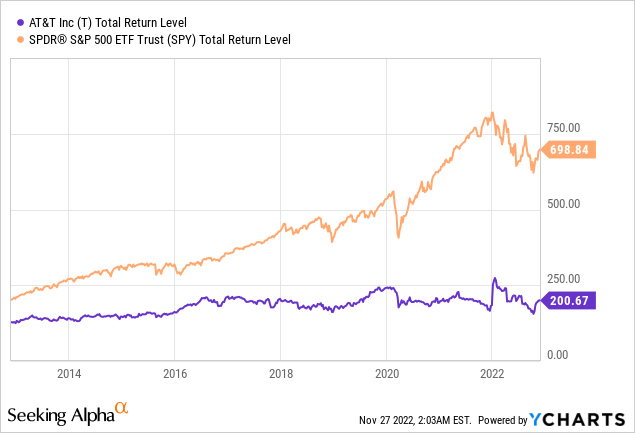
Despite this historical outperformance, I am still inclined to recommend a “Buy” rating for T stock. I see many bullish signs in favor of this company: strong financial performances, considerable insider buying activity, strong dividend yields, and more. Let’s take a look into the primary drivers for my assumptions on this bullish outlook.
Company Activity
AT&T recently released fiscal 2022 Q3 on October 20th, and it generally has had great financial results. Here is a quote from CEO, President & Director John T. Stankey on the Earnings Call Transcript page that I found helpful in recapping the performances coming out of the pandemic:
In fact, the third quarter marked our highest wireless service revenue growth year-over-year in more than a decade, and we now expect to achieve wireless service revenue growth at the upper end of the 4.5% to 5% range. This is about 200 basis points higher than where we expected to land at the start of the year, thanks to continued net add strength and ARPU growth. Now let’s jump to fiber, where we continue to invest in building out a premium network and deliver on our stated expectations for steady customer growth. The success of our strategy is evidenced by the fact that we just posted our 11th straight quarter with more than 200,000 fiber net adds, with 338,000 net adds this past quarter.
To further analyze the strong financial performances, I compiled the history of 3 important metrics: Normalized Basic EPS, EBITDA, and Levered Free Cash Flow (“FCF”) respectively. This data is provided by Seeking Alpha’s Financials section. We know that AT&T is a very mature company and yet, normalized Basic EPS is steadily growing at an impressive 10-year 8.49% CAGR (calculations from Dec 2012 to Dec 2021). I also calculated the 10-year CAGR on EBITDA and Levered FCF from the same time period to result in a staggering 6.94% and 11.42% CAGR, respectively. These growth rates are pretty high for a company in a mature industry, and AT&T seems like it has managed to drive decent financial performance in the past 10 years. Even so, if we take a look at the top companies in the Integrated Telecommunication Services Industry, AT&T is ranked 5th overall.
Normalized Basic EPS (Seeking Alpha) EBITDA (Seeking Alpha) Levered FCF (Seeking Alpha)


There has also been considerable insider buying activity within the past year. In the past 4 years, insiders purchased roughly $11.20 million of this stock. I believe that this demonstrates that insiders believe that there are bullish tailwinds that will boost growth for this company in the coming quarters and years.
MarketBeat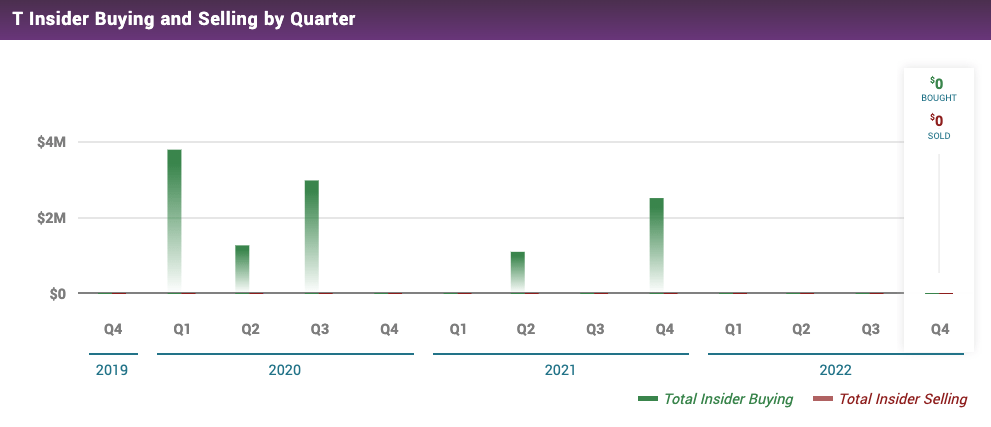
Breathtaking Dividend Yields
AT&T has still been living up to its reputation as a strong and consistent dividend payer. I want to highlight the fact that top management like CEO, President & Director John T. Stankey and Senior Executive VP & CFO Pascal Desroches in AT&T’s Q3 2022 Earnings Call are expressing their commitment to the dividend regime after another great financial performance.
Our results demonstrate that the strategy we put forward more than 2 years ago is the right strategy for not only the future of our business, but for the future of the communications industry […] All in all, we feel really good about the trajectory of the business. And when you look at an annual dividend commitment of $8 billion and a growing free cash flow, the model is working exactly as we anticipated.
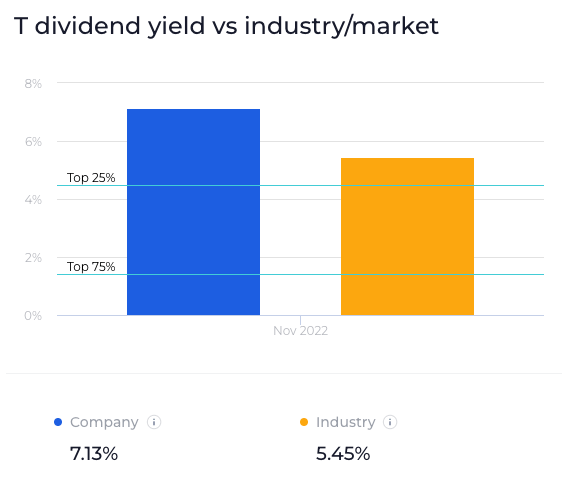
It is to no surprise that AT&T is a high dividend-yielding stock with excellent shareholder returns. Even though dividends has dropped by more than 10% in the last 10 years, the company has been growing back their dividends to their pre-pandemic yields (shown in the graph below). This CAGR is meaningful as it outpaces inflation’s 10-year CAGR of 2.32%. Furthermore, the company’s 7.25% dividend forward yield is much higher than S&P 500’s 1.82% annual yield and the 4.79% treasury yield. Its forward dividend yield compared to the industry places the company in the top 25% (second visual below). Comparisons like these and the ongoing growth moving forward makes me believe that AT&T is well-positioned to fulfill steady returns to investors during this inflation-heavy environment.
WallStreetZen WallStreetZen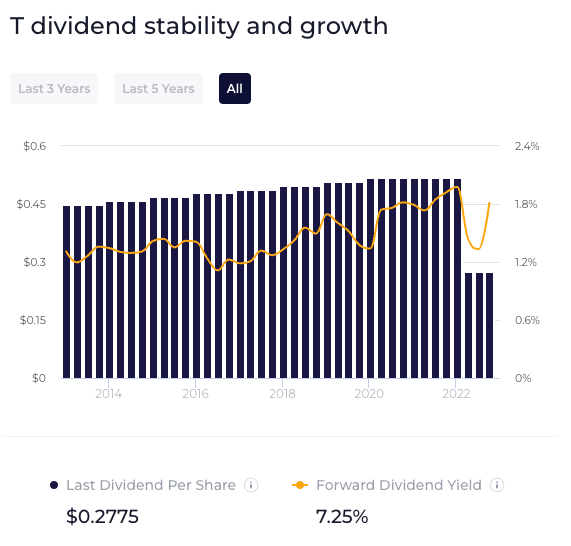
Stock Valuation
AT&T is a mature company with a track record of profitability. Because of this, I decided to employ the Discounted Cash Flow (‘DCF’) method with conservative approaches in order to obtain a more conservative and accurate intrinsic valuation. AT&T’s Free Cash Flow (‘FCF’) metric has been volatile in recent years, so I based this DCF model on the TTM FCF value to provide a more consistent and reliable metric of $13,091.00 million. I then assumed a 2% terminal growth rate to indicate growth that is in line with long-term anticipated inflation and a 4.00% FCF growth rate derived from management’s trajectory for historical performance growth. Finally, with a high WACC of 10%, my DCF resulted in an intrinsic price of $24.18 corresponds to a 26.44% upside from its current stock price.
Google Sheets
To further support my valuation, I found that Yahoo Finance Wall Street analysts are also bullish about this stock. We can see below that Yahoo Finance reports 23 analysts among professional analysts’ methodologies having an average price target of $20.28, with the range spanning from as low as $9.00 and $28.00. This is further evidence that T stock is currently undervalued by the market as it is approaching the average price target projections.
Yahoo Finance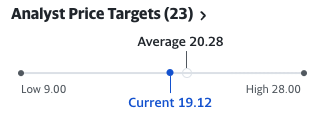
Risk Headwinds
The biggest systematic risk that I see for AT&T is the impact of inflation on the equity markets. Interest rates are still likely to rise as the economy worsens even though the annual inflation rate fell from its record high of 9.1% in July 2022 to 7.7% on a year-over-year basis recently. We can see this in the graph below of the inflation rates in the past 25 years.
TradingEconomics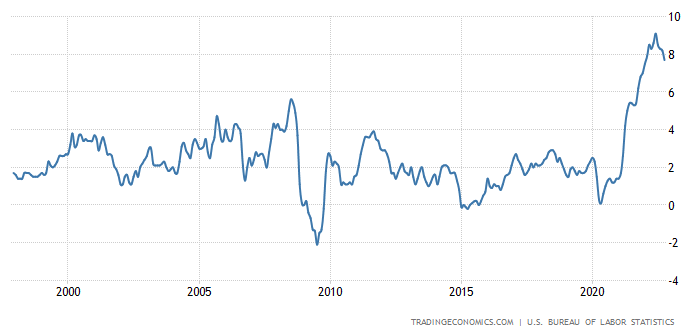
In addition, here’s a quote from TradingEconomics that recaps these news:
The annual inflation rate in the US is set to moderate only slightly to 8% in October from 8.2% reported in the previous month. Also, the core rate is likely to drop to 6.5% from a 40-year high of 6.6%. At the same time, the monthly gauge is projected to accelerate to 0.6% from 0.4% in September as gasoline prices rose for the first time in four months.
However, I think that T Stock still is a reliable choice because of their moats to prevent the inflation rates from having substantial effects. Here is Senior Executive VP & CFO Pascal Desroches on AT&T’s recapping management’s focus to adjust to these environments:
One of the things that we did […] over the last 2, 3 years is to really reconstruct our maturity towers and take advantage of historically low interest rates we were seeing coming out of the pandemic. As a result, right now, we have a dent tower — a series of debt outstanding that are yielding around 4% on average, and 95% of it is fixed. And if you look at our maturities over the next several years, our free cash flows after dividend could largely handle those. In the instance that there are slightly higher towers, we can always roll on a short-term basis. But what we’ve done is we’ve reconstructed the way we are managing capital such that we can really continue to deliver over the next several years without any meaningful need to go out to the market to raise debt.
Competitor Comparisons
The last part of my thesis is based on AT&T’s competitive positioning within the Telecommunications Industry. To see this, I compiled a table below to compare AT&T’s financial performances among top competitors such as Verizon (VZ), T-Mobile US (TMUS), and more that investors might seek out as an alternative investment.
My table of financial metrics such as P/E, P/S, and EBITDA from Yahoo Finance data yielded solid results. AT&T has a cheaper valuation compared to peers in terms of P/E and P/S, which is more attractive for investors. Furthermore, the company has the highest EBITDA, with only Verizon being ~$10 billion off, demonstrating strong financial performance and operating margins for the company. There is a reason why AT&T is ranked 5th overall in its industry. I strongly believe that their management already well-positioned themselves competitively to not only outperform the industry, but advance as an industry leader for the foreseeable future. Income-focused investors should not miss out on this opportunity while the company remains cheap.
|
Company |
Ticker |
P/S |
P/E |
EBITDA (Billions) |
|
AT&T |
T |
0.90 |
7.45 |
53.01 |
|
Verizon |
VZ |
1.20 |
7.69 |
43.44 |
|
T-Mobile US |
TMUS |
2.37 |
20.33 |
26.66 |
|
Comcast |
CMCSA |
1.32 |
9.42 |
36.85 |
|
Deutsche Telekom AG |
DTEGY |
0.86 |
11.95 |
32.13 |
|
Vodafone |
VOD |
0.66 |
10.68 |
12.98 |
|
American Tower Corporation |
AMT |
9.61 |
46.73 |
6.35 |
|
SBA Communications |
SBAC |
12.85 |
55.56 |
1.62 |
Concluding Thoughts
I believe that AT&T is a great investment proposition based on its dividend program and the company’s intrinsic valuation based on my DCF model. AT&T’s dividend program continues to be robust, and management has demonstrated a commitment to the current dividend program. My conservative Discounted Cash Flow model resulted in a minimum intrinsic price of $24.18 or a 26.44% undervaluation by the market. In addition, according to Yahoo Finance, 23 analysts have had similar valuation and price targets. With all of these supporting points and those discussed above, I am recommending a “Buy” rating on T stock as shares and valuation are too cheap to ignore.
Disclosure: I/we have no stock, option or similar derivative position in any of the companies mentioned, and no plans to initiate any such positions within the next 72 hours. I wrote this article myself, and it expresses my own opinions. I am not receiving compensation for it (other than from Seeking Alpha). I have no business relationship with any company whose stock is mentioned in this article.
