Summary:
- Apple Inc.’s valuation is becoming less reasonable, with a TTM P/E of 29.9x and slower growth leading up to the release of the iPhone 15 expected in September.
- Recent results show stagnant revenue and profit levels, with another decrease in product revenue offset by growth in the service segment.
- Apple’s strong profitability and share repurchases have helped drive EPS growth, but the company needs a new project to invest their cash flows in.
grinvalds/iStock Editorial via Getty Images
Apple Inc. (NASDAQ:AAPL) has been a great long-term investment for many, and one I have been fortunate enough to own at points over the years. Looking at the company has given me some valuable investing lessons, such as paying up for growth and holding on to winners in order to let tax-free unrealized capital gains compound. Apple still might be a great company with green pastures ahead of it, but the valuation is looking a little less reasonable today, as this article will discuss.
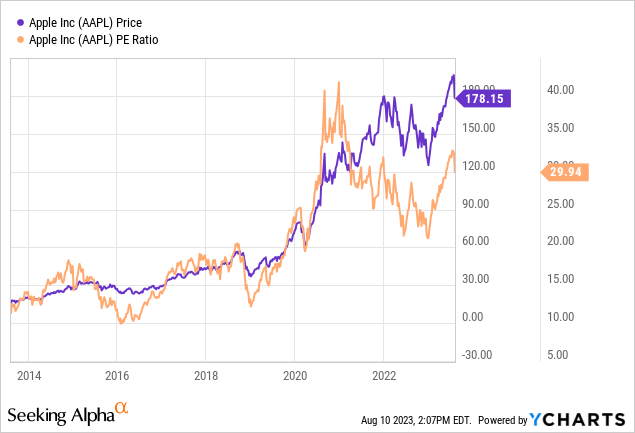
When I first invested in Apple back in May 2016, it sported a much different valuation and dividend yield, but yet was a smaller company with a larger growth path ahead of it. Apple now trades at a TTM P/E 29.9x (3.3% earnings yield), which makes the valuation harder to justify without considering significant growth. The increase in valuation multiples in recent years as shown in the below graph has awkwardly gone in the other direction to actual growth rates, as this article discusses.
Latest Results Show a Mature Highly Profitable Giant
Apple’s Q3 2023 results released August 3rd showed quarterly revenue of $81.8 billion (-1% YoY) and quarterly diluted EPS of $1.26 (+5% YoY). This follows a similar Q2 2023 which had revenues down 3% YoY and EPS unchanged. In Q3, Apple repurchased enough shares to lowered its diluted share count by a net 72 million shares (-0.5%) over the quarter. Since last year in Q3 2022, Apple has lowered its diluted share count by 402 million shares (-3.0%) which is helping to support that 5% EPS growth YoY reported in Q3.
The total revenue decrease for the quarter of $1.6 billion (-1.4%) and $10.4 (-3.4%) billion for the nine-month period was driven by Product revenue decreasing $2.8 billion (-4.4%) and $14.3 billion (-5.8%), respectively. This decrease in Product revenue was partially offset by Apple’s Service segment, which continued to grow by $1.6 billion (+8.2%) and $3.9 billion (+6.7%) for the quarter and nine-month periods, respectively.
Apple Q3 2023 Gross Margin (snapshot from company Q3 2023 financial results)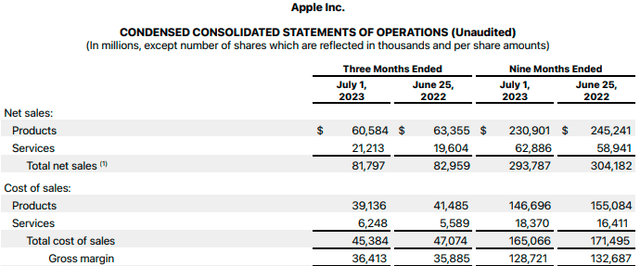
While these results do not sound too impressive, some long-term investors are not too concerned yet, as they know Apple’s revenues follow upgrade cycles and the iPhone 15 release is expected to be released mid-September 2023, which could help support the recovery in growth. Thinking about that thesis, below is a graph of Apple’s quarterly revenues, which shows the growth over the last few years. Keep in mind the iPhone 11, 12, 13 and 14 were released in September/October of each year, resulting in the peaks in Apple’s Q1 revenue seen each year (company has fiscal year end September 30). Highlighted in the past 5-year data are the Q3 results each year, which allow us to see revenue and profits stagnating around 2021 levels.
Apple 5-Year Income Statement Highlights (compiled by author from company financials)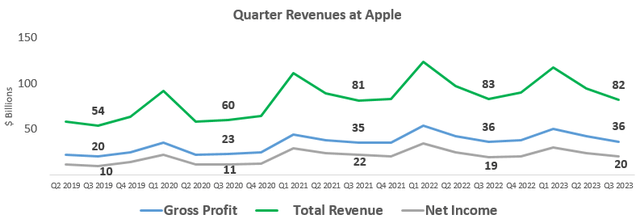
The sales for the next iPhone upgrade cycle will be very important to help confirm the growth trends being seen. Below is Apple’s quarterly TTM revenue growth, which shows great 43% growth in the Q2 2021 period, but it has been on a downward trend since. Apple has been relying a lot on its Service segment for growth as mentioned earlier when discussing the Q3 results. But as most followers of Apple probably know the service business is facing pressure and has faced lawsuits from clients (such as Fortnite) and trouble with regulators due to the possibly monopolistic fee levels being charged to merchants. While this lawsuit has been won for now in an April ruling, the high level of fees being charged in Apple’s service business will certainly drive competition and regulatory pressure in other markets.
Apple Quarterly TTM Revenue Growth (compiled by author from company financials)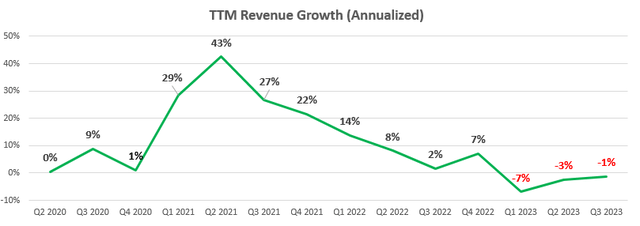
Highly Profitable and Growing
Apple’s strong brand and product portfolio have allowed it to achieve an average return on invested capital of 37.0% over the past five years. This level of profitability is well above my rule of and 9% ROIC, allowing me to be confident that, in my opinion, the company is able to maintain and continue to increase its intrinsic value over a business cycle whether through organic sales growth or investing in their own equity to drive EPS growth financially.
Apple Profit and Growth History (compiled by author from company financials)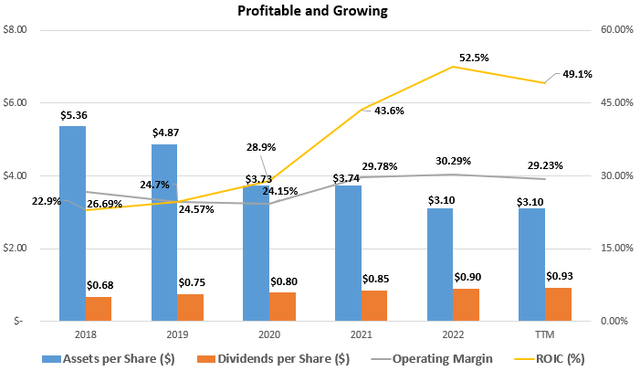
Since Apple’s 2018 fiscal year, the company has bought back 20.4% of their outstanding shares for an average 4.4% of outstanding shares repurchased each year. These 4.4% annualized repurchases have helped EPS grow at 15.7% annualized from 2018 to the TTM period, which has also been aided by 8.1% revenue growth annualized since 2018.
Readers of my articles will know that I also like to look for return on equity (ROE) over 15%, but the massive amount of share repurchases from Apple has made the ROE ratio pretty irrelevant. Apple has reduced equity on the balance sheet from $107 billion in 2018 to $8 billion in the latest quarter, helping to drive ROE to +150% in the TTM period! I would expect the total equity on the balance sheet to dip negative in the coming quarters as Apple joins the league of companies who have now repurchased more in equity capital dollar-wise than they ever issued. With that side note on equity discussed, let’s move on to discussing Apple’s cash flows.
Cash Flow Analysis
Apple does a good job of generating cash and returns it to shareholders through both dividends (0.54% forward yield) and share repurchases (3.0% TTM repurchased) for a total shareholder yield around 3.54%. To get an idea of the sustainability of dividends and share repurchases, we can take a look at what percent of cash flow from operations are available to be returned to shareholders after making the necessary capital expenditures.
As can be seen below, capital expenditures and acquisitions only used up on average 11% of cash flow from operations over the past decade. This is one of the best cash flow conversions I have seen, and it leaves approximately 89% to be returned to investors in the form of dividends and share repurchases. With an average cash flow from operations of $105 billion over the past three-year period, this 89% would imply free cash flow to shareholders of $93 billion for around a 3.3% free cash flow (“FCF”) yield at the current $2,850 billion market capitalization.
Cash Flow Analysis of Apple (compiled by author from company financials)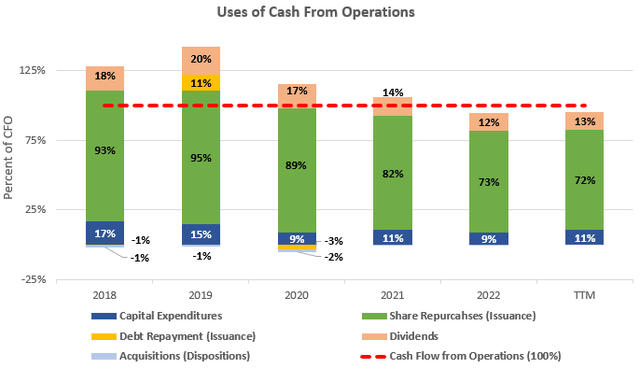
Estimating and Adding Growth for Apple
This FCF yield does not yet include growth which is critical to add in order to help make sense of these low pre-growth TTM and FCF yields. For a high growth company such as Apple, I will go beyond my conservative 3% growth rate to represent this mature company growing alongside global GDP, and will instead calculate Apple’s internal growth rate (IGR) by putting together a couple of financial ratios.
A company’s internal growth rate is the growth that can be achieved by investing in new assets without issuing additional equity or debt financing. Internal growth is achieved using only retained earnings not paid out as dividends to invest in new assets. If we look at Apple’s ROA of 22.3% from 2018 to 2022 and multiply is by the 84% of earnings not paid out as dividends in the latest period, we get an IGR of 18.7%.
This IGR is quite a high growth rate, and unfortunately one I think unrealistic in the long-term unless Apple comes out with a completely new product which is non-iterative or a substitute for their other tech product (ex. an electric car). We know from our cash flow analysis earlier that Apple is not ploughing back all these retained earnings into capital expenditures and new projects but is instead investing in their own shares which earn a lower FCF yield or forward earnings yield around 3.3% and growth have plateaued in recent years.
Below is a summary of the TTM earnings yield and free cash flow yield discussed earlier in the article. The two pre-growth figures are coincidentally similar at 3.3% which in my opinion further highlights the mature state of Apple with cash capital expenditures approximately the same as depreciation which is what would be expected in a mature steady state growth company.
Adding the two growth rates based on new assets being created/acquired or Apple investing in their own shares both are shown below. Apple’s share repurchases with the 98% could earn a good 3.3% rate of return and help with EPS growth, but these repurchases do not accomplish the same growth as Apple’s 18.7% IGR would suggest. Investors can choose which side of the growth thesis they fall on, but the mid-point would suggest cash yields and growth around 14.8% with the vast majority of that coming from growth expectations.
Apple Earnings and FCF Yield with Growth (compiled by author from company financials and market data)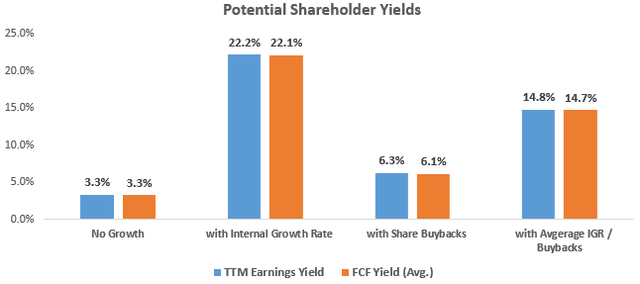
Takeaway for Investors
Apple is a great company, but that does not make it a great investment at any price such as its current 29.9x TTM P/E. Growth has slowed and even become negative at Apple in recent quarters, but the valuation seems to be going in the opposite direction. A lot is riding on the iPhone 15 release in September, but even if a great upgrade sales cycle happens, it would still make it hard to justify the growth expectations in Apple’s valuations.
Analyst’s Disclosure: I/we have no stock, option or similar derivative position in any of the companies mentioned, and no plans to initiate any such positions within the next 72 hours. I wrote this article myself, and it expresses my own opinions. I am not receiving compensation for it (other than from Seeking Alpha). I have no business relationship with any company whose stock is mentioned in this article.
While the information and data presented in my articles are obtained from company documents and/or sources believed to be reliable, they have not been independently verified. The material is intended only as general information for your convenience, and should not in any way be construed as investment advice. I advise readers to conduct their own independent research to build their own independent opinions and/or consult a qualified investment advisor before making any investment decisions. I explicitly disclaim any liability that may arise from investment decisions you make based on my articles.
Seeking Alpha’s Disclosure: Past performance is no guarantee of future results. No recommendation or advice is being given as to whether any investment is suitable for a particular investor. Any views or opinions expressed above may not reflect those of Seeking Alpha as a whole. Seeking Alpha is not a licensed securities dealer, broker or US investment adviser or investment bank. Our analysts are third party authors that include both professional investors and individual investors who may not be licensed or certified by any institute or regulatory body.
