Summary:
- Salesforce stock has risen over 61% this year due to expectations of slower rate hikes and strong top-line growth.
- Is now still a good time to invest in Salesforce from a technical analysis perspective?
- We break down Supply & Demand, Momentum, and Mean Reversion trends to better understand what could happen next.
- We think the stock is set to bounce after a few weeks of selling off, and it could be a great time to get involved given the otherwise strong momentum seen in 2023.
John M. Chase
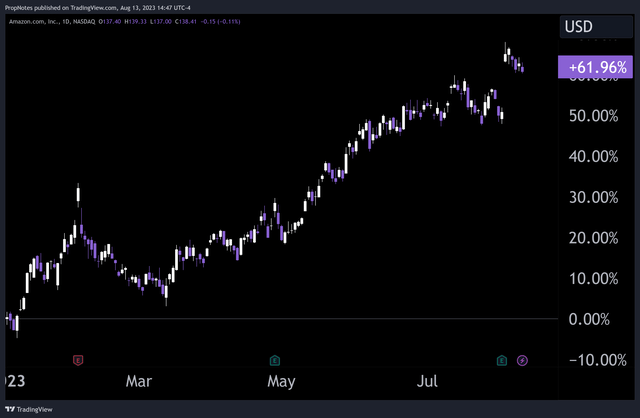
Over the last few months, Salesforce (NYSE:CRM) stock has been on quite the run, up more than 61% since the start of the year:
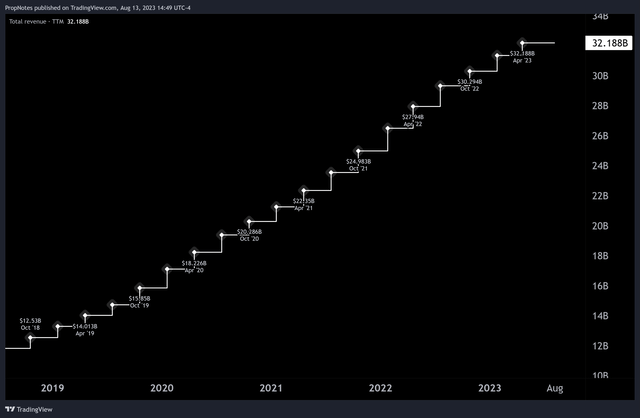
This rise has largely been driven by expectations for a slowing pace of rate hikes from the Federal Reserve as inflation has come down (which affects the valuation of all high growth, high multiple stocks), in addition to continued, strong, top-line growth:
The question remains, though; is now a good time to enter this well known, high-tech story?
Today, we thought we’d dive deeper into the stock, looking at historical prices from a technical perspective to see whether or not we can answer that question.
When it comes to Technical Analysis, we look at three things:
- Supply & Demand
- Momentum
- Mean Reversion
By combining these three disciplines of Technical Analysis, we can understand the chart at a much deeper level and help ourselves build a story about what we think is happening under the hood. Then, we can figure out whether or not it’s an advantageous time to get involved in the name.
Time to jump in!
Supply & Demand
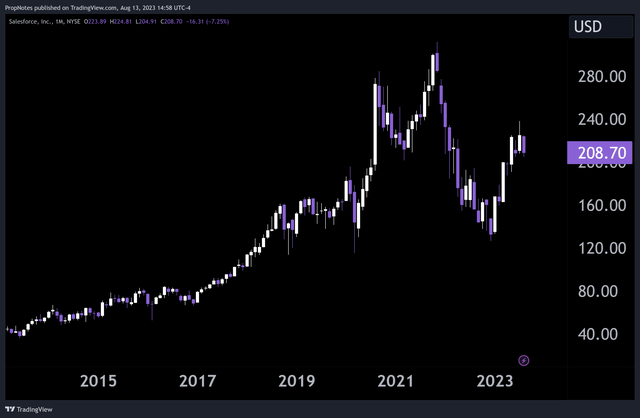
First up, let’s begin by orienting ourselves with Salesforce’s Monthly chart:
As you can see, the stock has performed strongly over the last decade, up about 440% from August 2013 through today. That favorably compares to a performance in the S&P 500 of only 176%.
Supply and demand is simply a way of pointing out where supply (sellers) and demand (buyers) are showing up in the market, depending on where the price is.
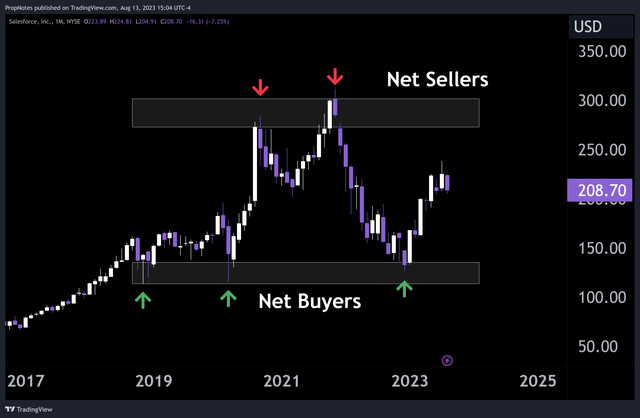
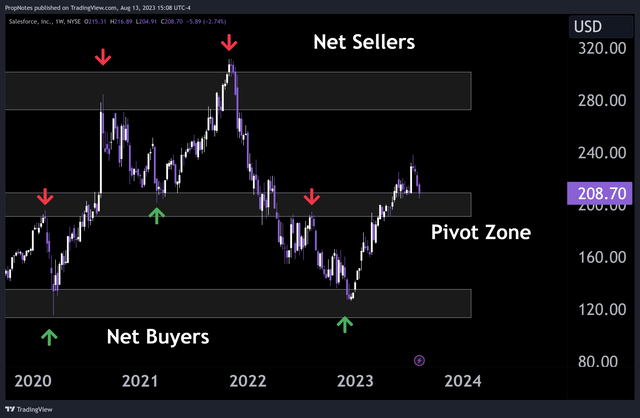
In the annotated chart below, there are a few obvious zones of interest, where no matter what the underlying fundamentals of the company are doing, the stock routinely gets net bought, or net sold:
The main ‘area’ of demand appears to be between $115 and $135, and the main ‘area’ of net supply appears to be between $275 and $300. At the moment, Salesforce stock appears to be right in between these major areas of interest, which signals a lack of a clear directional bias.
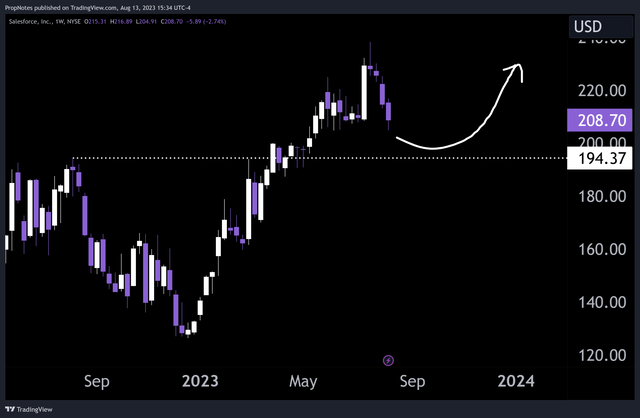
Zooming in somewhat, you can see another pivot zone between $190 and $205, which has acted as another zone of interest on shorter timeframes:
In the past, this zone has acted as both a level of support and resistance in the stock, depending on the mood of the market. The stock is trading near this zone at the moment; let’s keep this in mind as we move next into looking at Momentum.
Momentum
When it comes to gauging momentum, we prefer to use a Smoothed Heiken Ashi setup. It smooths out price action, but also is much more responsive to sudden movements than a traditional moving average setup.
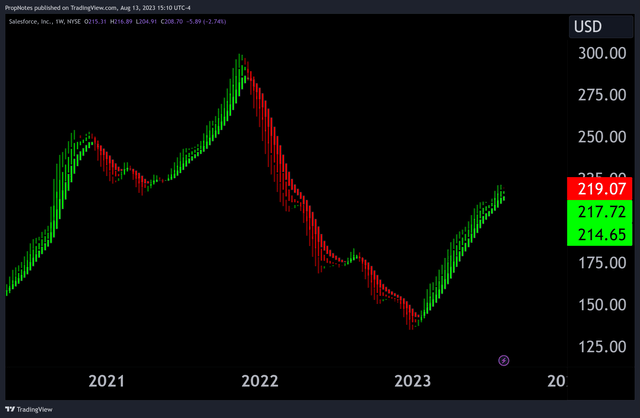
For us, viewing the markets like this is the best of both worlds when it comes to analyzing momentum at a glance. Here, you can see the same weekly Salesforce chart as above in a totally new light:
Quickly, one can see that the stock has had a few distinct trends over the last few years. The chart begins with a rally in 2020, followed by some consolidation in 2021, followed by renewed buying into 2022, then a massive collapse throughout most of that year as interest rates began to rise.
In 2023, Salesforce stock has been on a run, but the stock still remains only about halfway back to the all-time highs it reached in the previous cycle.
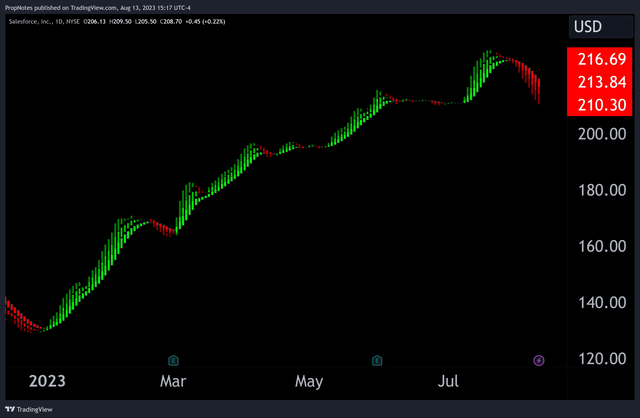
Zooming in to the daily chart, we can see that this trend is also weakening somewhat:
While this recent weakness is largely attributable to broad market weakness over the last two weeks in the indices and elsewhere, it still paints a mixed picture of momentum overall. Sure, the weekly trend is strong, but broadly, the stock is in the middle of a huge range, and recent weakness places the stock back in a pivot zone.
Let’s keep this in mind as well as we look at Mean Reversion next.
Mean Reversion
The final – highly useful – lens we focus on is called “Mean Reversion”. Another way to think about this category of metrics would be by calling it ‘short term fear and greed’. On higher timeframes, understanding the broad momentum and supply / demand dynamics can be useful, but finding alpha in trades, in our view, is more about using mean reversion analysis to pinpoint opportunities.
If a stock is in a strong trend, then a few days of sharp selling can be a great opportunity to enter for a bigger move.
If a stock is selling off hard into historical support, it could be a decent place to begin taking some risk.
The same goes on the short side of the market for both of these examples.
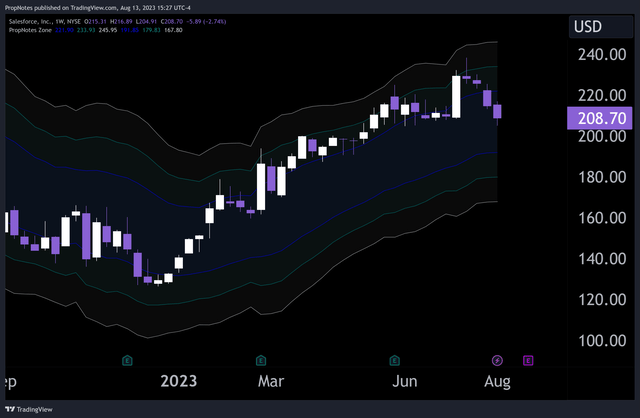
Right now, on a weekly chart, Salesforce stock exhibits no real signs of extension in either direction:
A simple Bollinger Band setup with a few different settings shows that in the short term, the stock is in a neutral area, which doesn’t bode well for any sort of mean-reversion action.
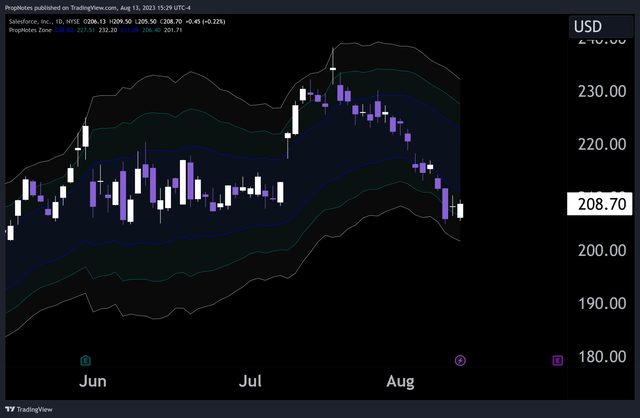
However, on a daily chart, it’s a different story:
A look at recent price action shows that the stock is extended to the downside past several of the standard deviation measures, which indicates that a mean reversion move to the upside could be likely.
Summary
In combination, we think Salesforce stock looks quite bullish from an overall Technical Perspective.
First, take the broad supply and demand situation.
The stock may be between two large zones of Supply & Demand, but shares have recently traded through, and are now trading above, an important pivot zone. Additionally, the stock has been on a strong bull run so far in 2023. In some cases, momentum can beget momentum, which is a strong advantage to take of in the market.
Finally, the stock has extended to the downside (into the pivot zone!), and could be primed for a bounce back as demand comes back into the stock and the bull trend resumes.
From a trading perspective, a decent area to place a stop would be around $195:
This is the bottom of the pivot zone, and if it is breached, then it’s possible that the stock could be stuck, rangebound for the foreseeable future, thus invalidating our trend trading plan.
Anyway; do you agree? Disagree? Let us know in the comments and tell us if you want us to do more technical breakdowns. This is our first such article, and we’re keen to make more of them if you enjoyed it.
Cheers!
Analyst’s Disclosure: I/we have no stock, option or similar derivative position in any of the companies mentioned, and no plans to initiate any such positions within the next 72 hours. I wrote this article myself, and it expresses my own opinions. I am not receiving compensation for it (other than from Seeking Alpha). I have no business relationship with any company whose stock is mentioned in this article.
Seeking Alpha’s Disclosure: Past performance is no guarantee of future results. No recommendation or advice is being given as to whether any investment is suitable for a particular investor. Any views or opinions expressed above may not reflect those of Seeking Alpha as a whole. Seeking Alpha is not a licensed securities dealer, broker or US investment adviser or investment bank. Our analysts are third party authors that include both professional investors and individual investors who may not be licensed or certified by any institute or regulatory body.

